| Param | Original file | Final file |
|---|---|---|
| Filename | modeM0/AS1A02_132T01_9000001068_07769cztM0_level2.evt | modeM0/AS1A02_132T01_9000001068_07769cztM0_level2_quad_clean.evt |
| Size (bytes) | 436,253,760 | 96,724,800 |
| Size | 416.0 MB | 92.2 MB |
| Events in quadrant A | 3,075,884 | 615,123 |
| Events in quadrant B | 3,352,037 | 630,289 |
| Events in quadrant C | 3,060,045 | 628,137 |
| Events in quadrant D | 3,272,056 | 592,243 |
| Mode M0 | |||
|---|---|---|---|
| Quadrant | BADHDUFLAG | Total packets | Discarded packets |
| A | 0 | 13629 | 3 |
| B | 0 | 14397 | 2 |
| C | 0 | 13565 | 2 |
| D | 0 | 14235 | 2 |
| Mode SS | |||
|---|---|---|---|
| Quadrant | BADHDUFLAG | Total packets | Discarded packets |
| A | 0 | 136 | 0 |
| B | 0 | 136 | 0 |
| C | 0 | 136 | 0 |
| D | 0 | 136 | 0 |
| Mode M9 | |||
|---|---|---|---|
| Quadrant | BADHDUFLAG | Total packets | Discarded packets |
| A | 0 | 20 | 0 |
| B | 0 | 20 | 0 |
| C | 0 | 20 | 0 |
| D | 0 | 20 | 0 |
| Quadrant | Total seconds | Saturated seconds | Saturation percentage |
|---|---|---|---|
| A | 6650 | 43 | 0.646617% |
| B | 6650 | 65 | 0.977444% |
| C | 6650 | 30 | 0.451128% |
| D | 6650 | 41 | 0.616541% |
Noise dominated data is calculated using 1-second bins in cleaned event files. If a bin has >2000 counts, and if more than 50% of those come from <1% of pixels, then it is considered to be noise-dominated and hence unusable.
| Quadrant | # 1 sec bins | Bins with >0 counts | Bins with >2000 counts | High rate bins dominated by noise | Noise dominated (total time) | Noise dominated (detector-on time) | Marked lightcurve |
|---|---|---|---|---|---|---|---|
| A | 8630 | 6651 | 2 | 2 | 0.02% | 0.03% | 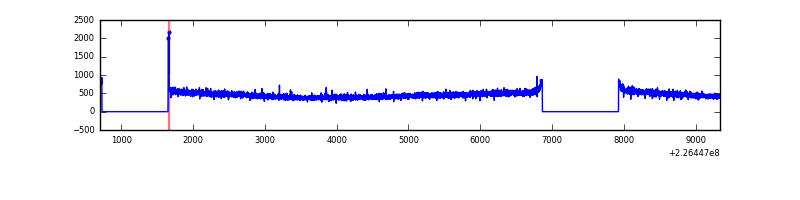 |
| B | 8630 | 6651 | 7 | 7 | 0.08% | 0.11% | 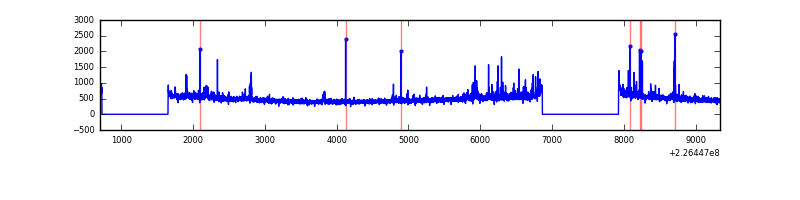 |
| C | 8630 | 6651 | 0 | 0 | 0.00% | 0.00% | 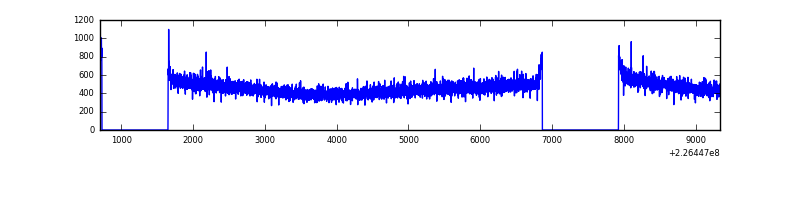 |
| D | 8630 | 6651 | 16 | 16 | 0.19% | 0.24% | 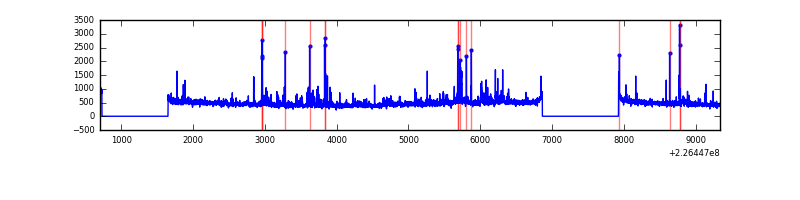 |
Top three noisy pixels from each quadrant. If the there are fewer than three noisy pixels in the level2.evt file, extra rows are filled as -1
| Pixel properties | Quadrant properties | ||||||
|---|---|---|---|---|---|---|---|
| Quadrant | DetID | PixID | Counts | Sigma | Mean | Median | Sigma |
| A | 8 | 6 | 12672 | 72.99 | 793 | 777 | 163.0 |
| A | 0 | 226 | 7488 | 41.18 | 793 | 777 | 163.0 |
| A | 12 | 194 | 6841 | 37.21 | 793 | 777 | 163.0 |
| B | 4 | 173 | 62704 | 397.44 | 809 | 791 | 155.8 |
| B | 4 | 239 | 62371 | 395.31 | 809 | 791 | 155.8 |
| B | 0 | 214 | 28367 | 177.02 | 809 | 791 | 155.8 |
| C | 13 | 61 | 5981 | 28.25 | 783 | 790 | 183.7 |
| C | 12 | 4 | 3589 | 15.23 | 783 | 790 | 183.7 |
| C | 8 | 222 | 2474 | 9.16 | 783 | 790 | 183.7 |
| D | 2 | 152 | 163829 | 859.61 | 773 | 751 | 189.7 |
| D | 1 | 52 | 107206 | 561.14 | 773 | 751 | 189.7 |
| D | 13 | 104 | 25803 | 132.05 | 773 | 751 | 189.7 |
Histogram calculated using DETX and DETY for each event in the final _common_clean file
| Quadrant A |  |
 |
Quadrant B |
|---|---|---|---|
| Quadrant D |  |
 |
Quadrant C |
| Plot type | Count rate plots | Images |
|---|---|---|
| Comparison with Poisson distribution Blue bars denote a histogram of data divided into 1 sec bins. Red curve is a Poisson curve with rate = median count rate of data. |
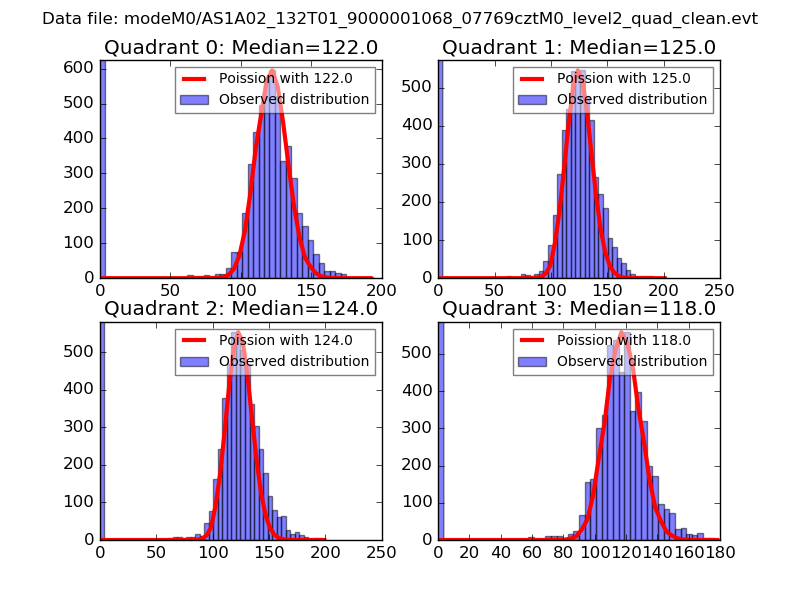 |
 |
| Quadrant-wise count rates Data is divided into 100 sec bins |
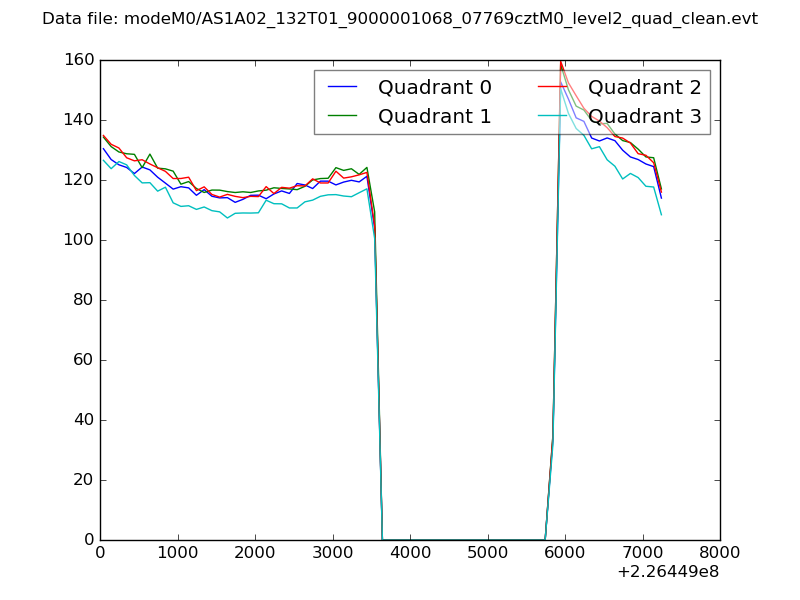 |
|
| Module-wise count rates for Quadrant A Data is divided into 100 sec bins |
 |
 |
| Module-wise count rates for Quadrant B Data is divided into 100 sec bins |
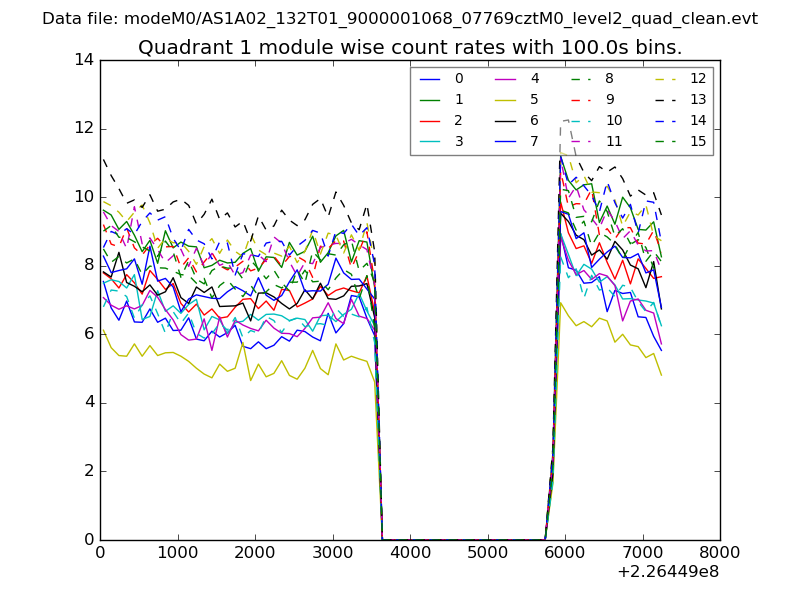 |
 |
| Module-wise count rates for Quadrant C Data is divided into 100 sec bins |
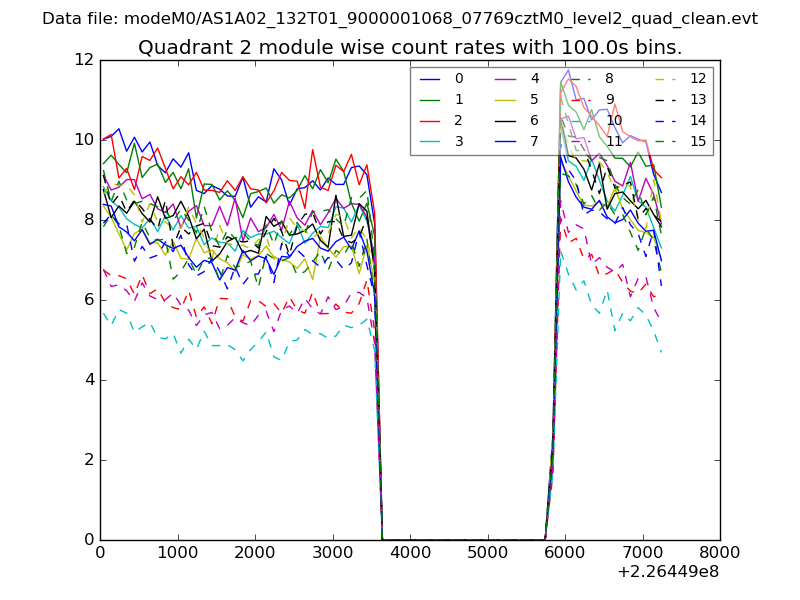 |
 |
| Module-wise count rates for Quadrant D Data is divided into 100 sec bins |
 |
 |
| Parameter | Plot |
|---|---|
| CZT HV Monitor | 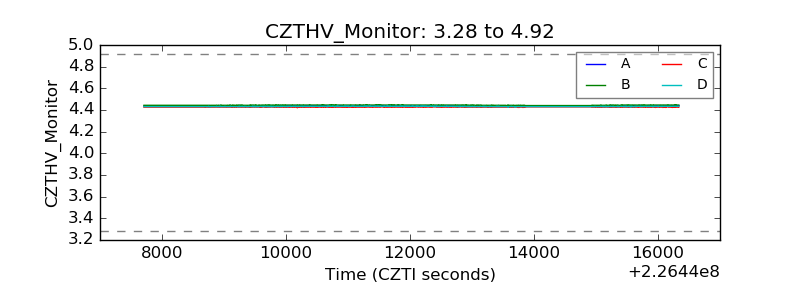 |
| D_VDD |  |
| Temperature 1 |  |
| Veto HV Monitor |  |
| Veto LLD |  |
| Alpha Counter | 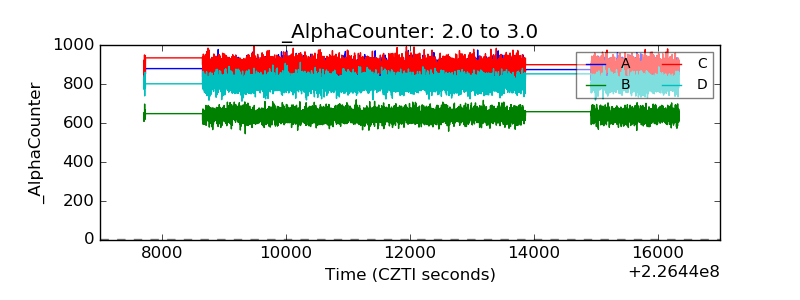 |
| _CPM_Rate | 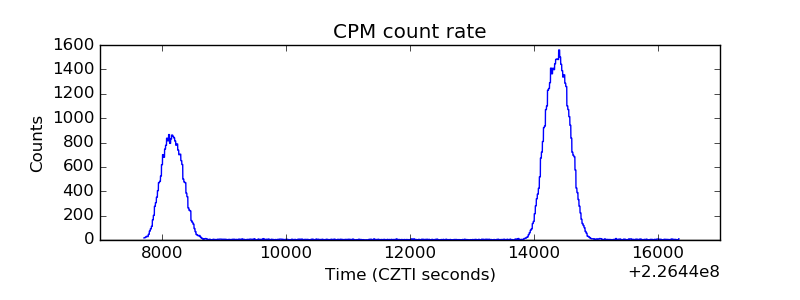 |
| CZT Counter |  |
| +2.5 Volts monitor |  |
| +5 Volts monitor |  |
| _ROLL_ROT |  |
| _Roll_DEC |  |
| _Roll_RA |  |
| Veto Counter |  |