| Param | Original file | Final file |
|---|---|---|
| Filename | modeM0/AS1A02_132T01_9000001068_07770cztM0_level2.evt | modeM0/AS1A02_132T01_9000001068_07770cztM0_level2_quad_clean.evt |
| Size (bytes) | 433,275,840 | 98,760,960 |
| Size | 413.2 MB | 94.2 MB |
| Events in quadrant A | 2,998,556 | 635,213 |
| Events in quadrant B | 3,258,278 | 652,019 |
| Events in quadrant C | 3,009,479 | 649,565 |
| Events in quadrant D | 3,418,111 | 605,338 |
| Mode M0 | |||
|---|---|---|---|
| Quadrant | BADHDUFLAG | Total packets | Discarded packets |
| A | 0 | 13195 | 3 |
| B | 0 | 13906 | 2 |
| C | 0 | 13184 | 2 |
| D | 0 | 14478 | 2 |
| Mode SS | |||
|---|---|---|---|
| Quadrant | BADHDUFLAG | Total packets | Discarded packets |
| A | 0 | 132 | 0 |
| B | 0 | 132 | 0 |
| C | 0 | 132 | 0 |
| D | 0 | 132 | 0 |
| Mode M9 | |||
|---|---|---|---|
| Quadrant | BADHDUFLAG | Total packets | Discarded packets |
| A | 0 | 19 | 0 |
| B | 0 | 19 | 0 |
| C | 0 | 19 | 0 |
| D | 0 | 20 | 0 |
| Quadrant | Total seconds | Saturated seconds | Saturation percentage |
|---|---|---|---|
| A | 6429 | 13 | 0.202209% |
| B | 6429 | 55 | 0.855499% |
| C | 6429 | 6 | 0.093327% |
| D | 6429 | 35 | 0.544408% |
Noise dominated data is calculated using 1-second bins in cleaned event files. If a bin has >2000 counts, and if more than 50% of those come from <1% of pixels, then it is considered to be noise-dominated and hence unusable.
| Quadrant | # 1 sec bins | Bins with >0 counts | Bins with >2000 counts | High rate bins dominated by noise | Noise dominated (total time) | Noise dominated (detector-on time) | Marked lightcurve |
|---|---|---|---|---|---|---|---|
| A | 7609 | 6430 | 0 | 0 | 0.00% | 0.00% | 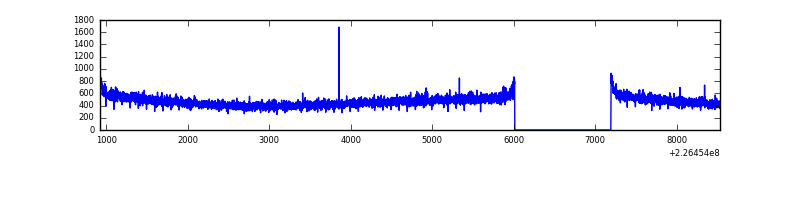 |
| B | 7609 | 6430 | 16 | 16 | 0.21% | 0.25% | 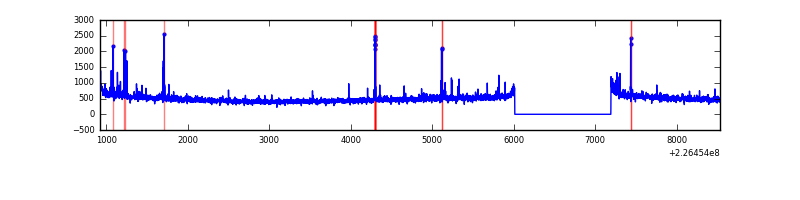 |
| C | 7609 | 6430 | 0 | 0 | 0.00% | 0.00% | 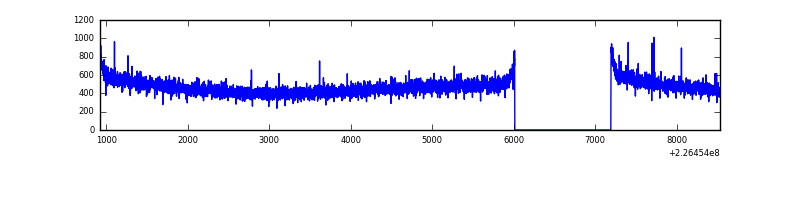 |
| D | 7609 | 6430 | 20 | 20 | 0.26% | 0.31% | 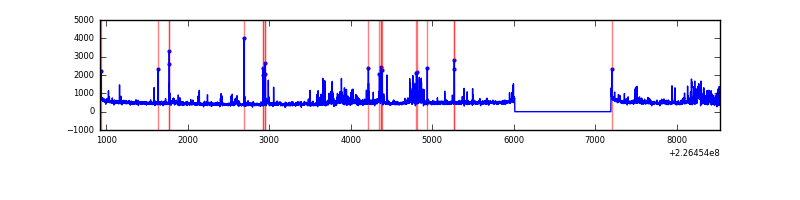 |
Top three noisy pixels from each quadrant. If the there are fewer than three noisy pixels in the level2.evt file, extra rows are filled as -1
| Pixel properties | Quadrant properties | ||||||
|---|---|---|---|---|---|---|---|
| Quadrant | DetID | PixID | Counts | Sigma | Mean | Median | Sigma |
| A | 0 | 226 | 7257 | 40.74 | 776 | 760 | 159.5 |
| A | 12 | 194 | 6707 | 37.29 | 776 | 760 | 159.5 |
| A | 8 | 15 | 4961 | 26.34 | 776 | 760 | 159.5 |
| B | 4 | 173 | 59013 | 385.31 | 792 | 773 | 151.2 |
| B | 4 | 239 | 53348 | 347.83 | 792 | 773 | 151.2 |
| B | 4 | 81 | 28711 | 184.84 | 792 | 773 | 151.2 |
| C | 12 | 4 | 6684 | 32.92 | 770 | 778 | 179.4 |
| C | 13 | 61 | 5864 | 28.35 | 770 | 778 | 179.4 |
| C | 8 | 222 | 2161 | 7.71 | 770 | 778 | 179.4 |
| D | 2 | 152 | 203383 | 1092.37 | 756 | 735 | 185.5 |
| D | 1 | 52 | 199865 | 1073.41 | 756 | 735 | 185.5 |
| D | 12 | 221 | 100117 | 535.72 | 756 | 735 | 185.5 |
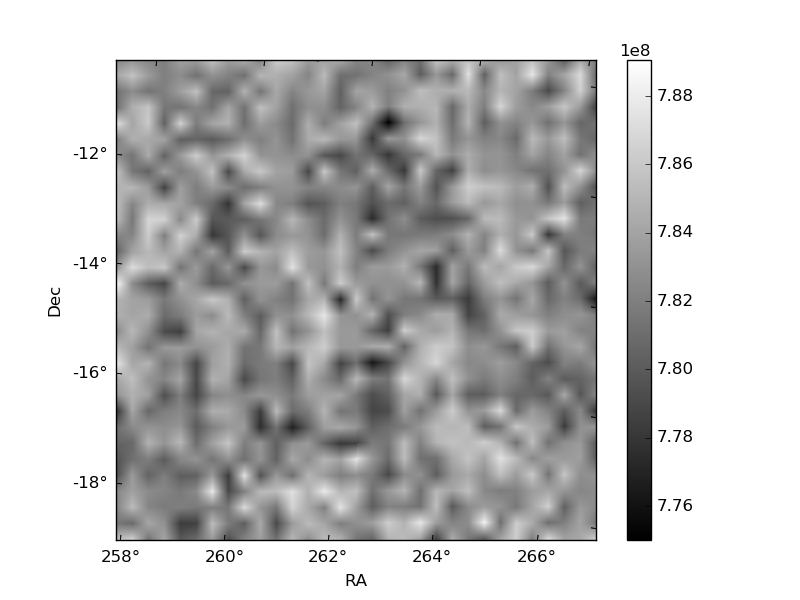
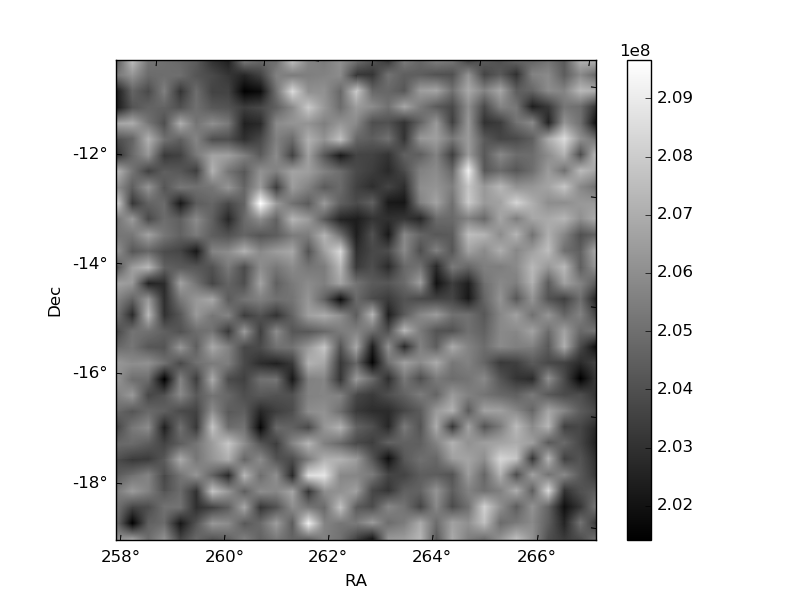
Histogram calculated using DETX and DETY for each event in the final _common_clean file
| Quadrant A | 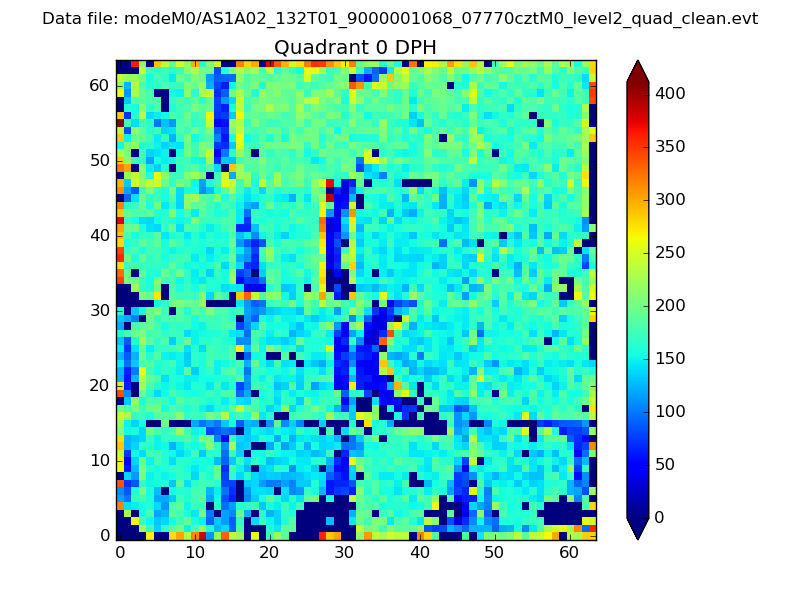 |
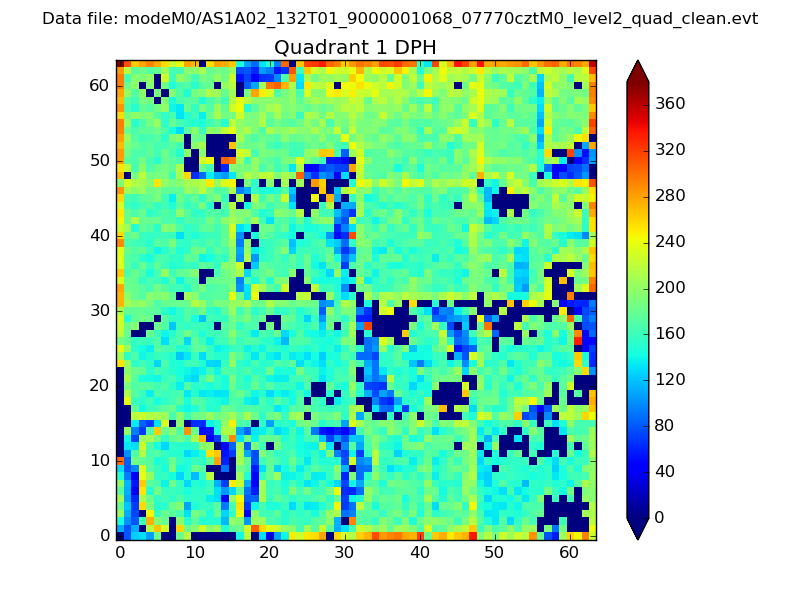 |
Quadrant B |
|---|---|---|---|
| Quadrant D | 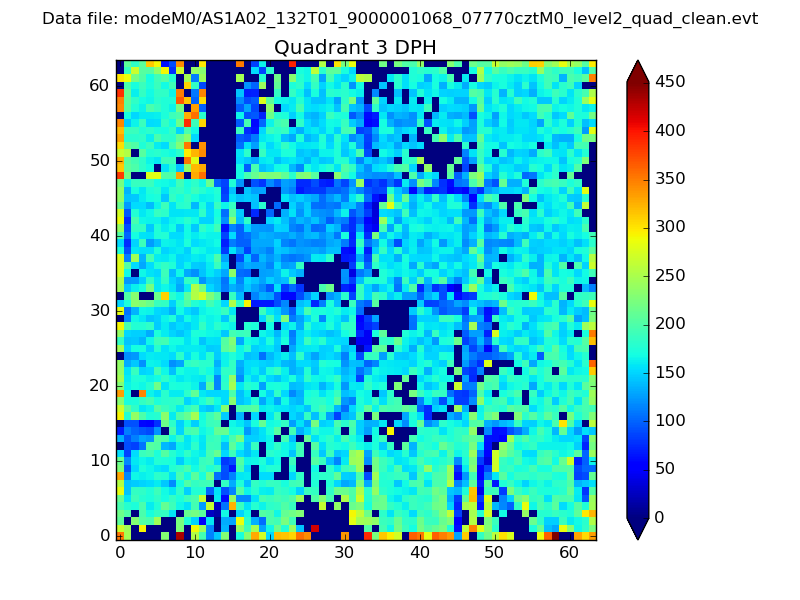 |
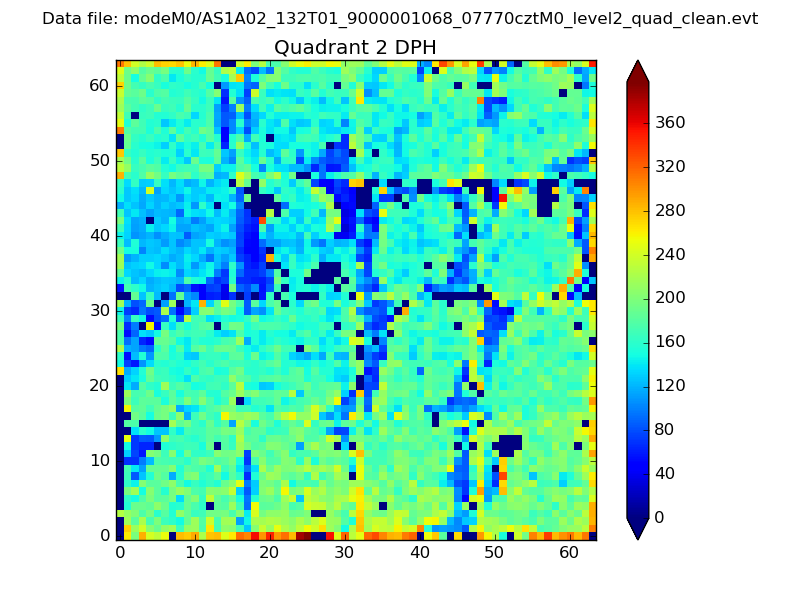 |
Quadrant C |
| Plot type | Count rate plots | Images |
|---|---|---|
| Comparison with Poisson distribution Blue bars denote a histogram of data divided into 1 sec bins. Red curve is a Poisson curve with rate = median count rate of data. |
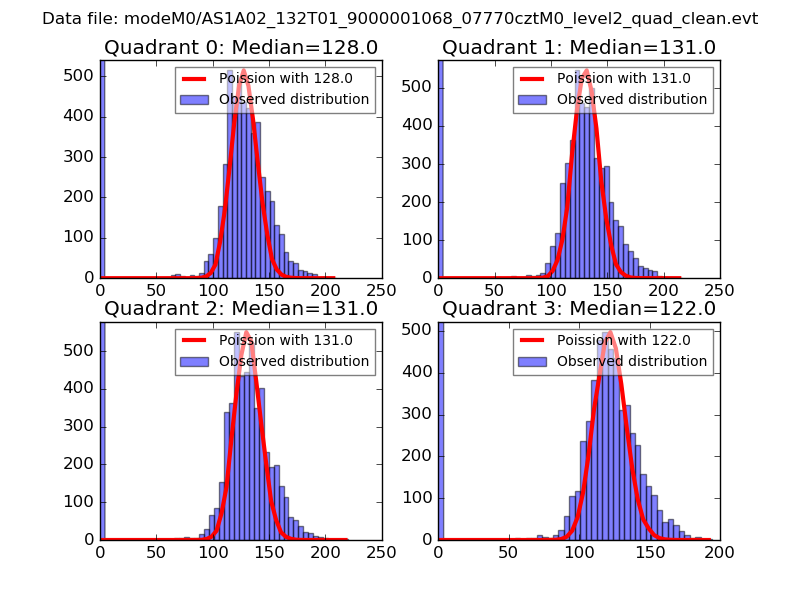 |
 |
| Quadrant-wise count rates Data is divided into 100 sec bins |
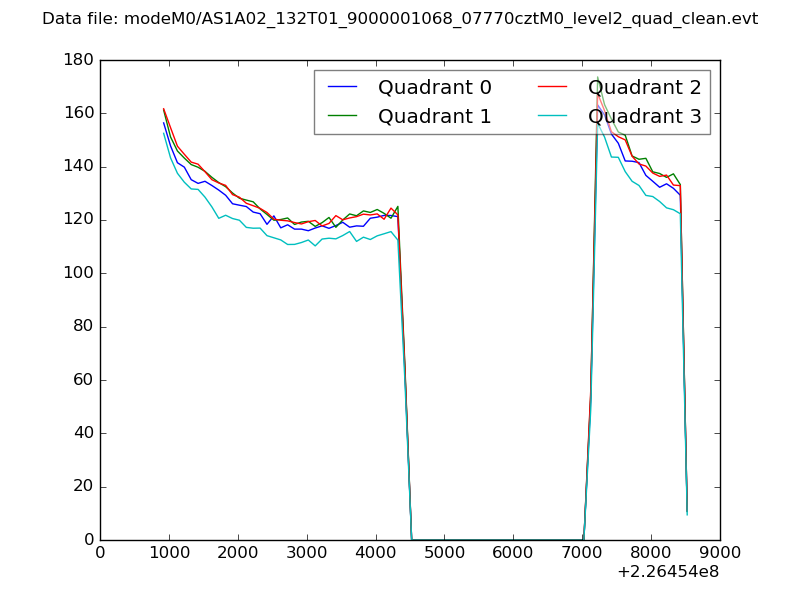 |
|
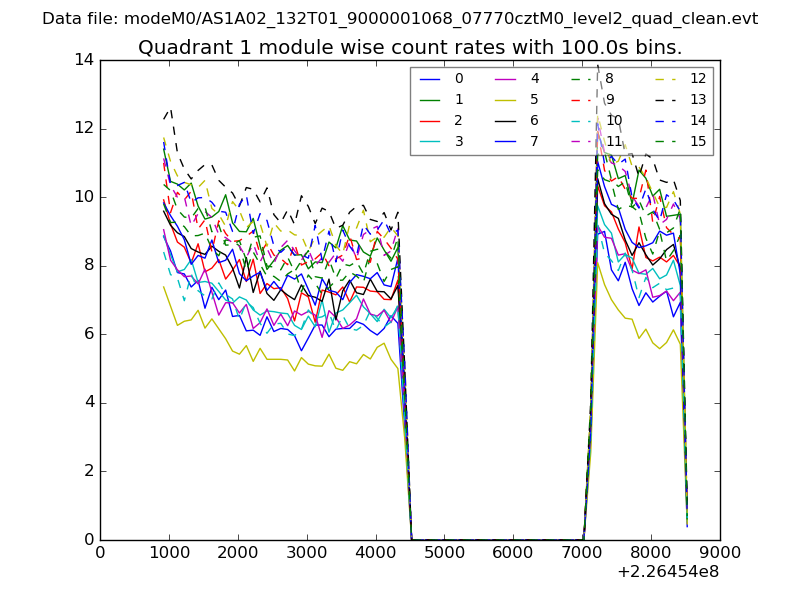
| Module-wise count rates for Quadrant A Data is divided into 100 sec bins |
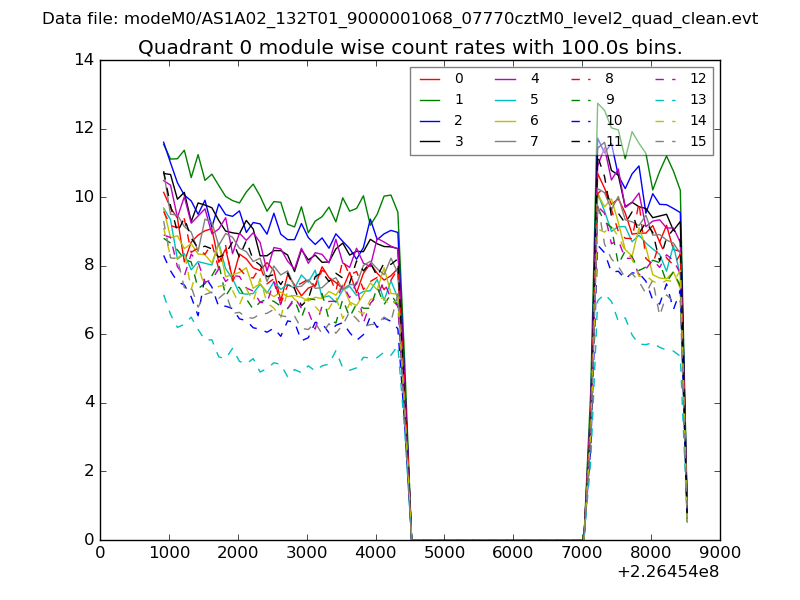 |
 |
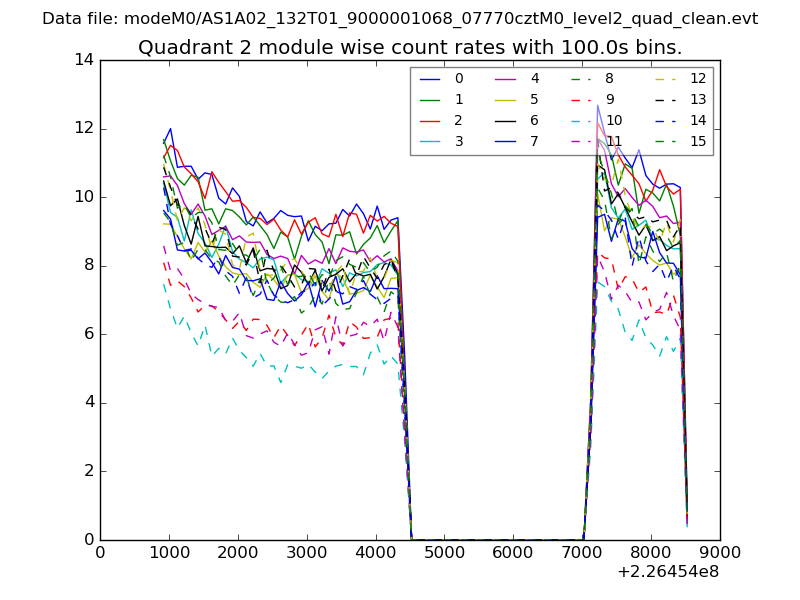
| Module-wise count rates for Quadrant B Data is divided into 100 sec bins |
 |
 |
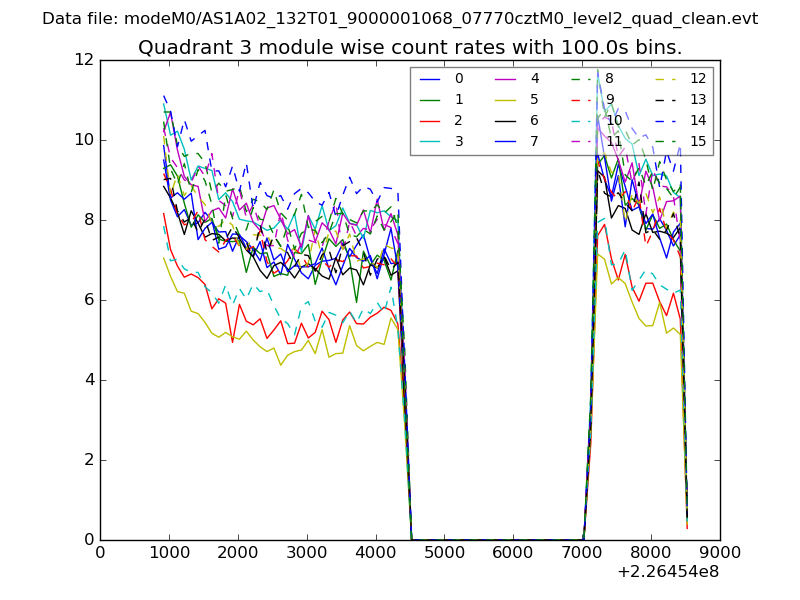
| Module-wise count rates for Quadrant C Data is divided into 100 sec bins |
 |
 |
| Module-wise count rates for Quadrant D Data is divided into 100 sec bins |
 |
 |
| Parameter | Plot |
|---|---|
| CZT HV Monitor | 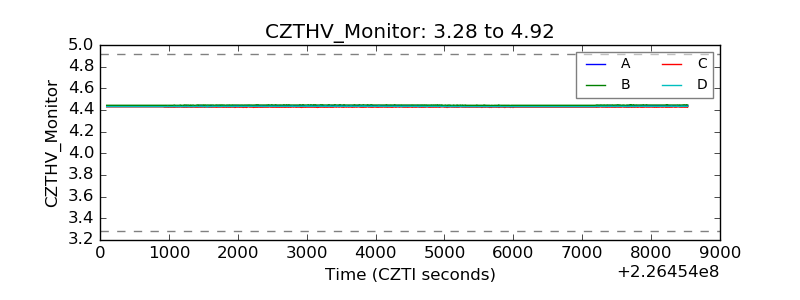 |
| D_VDD | 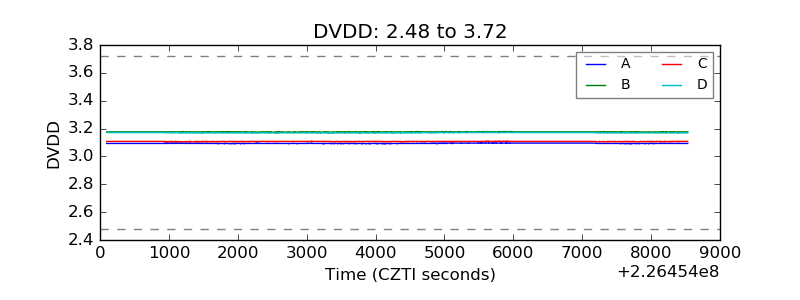 |
| Temperature 1 | 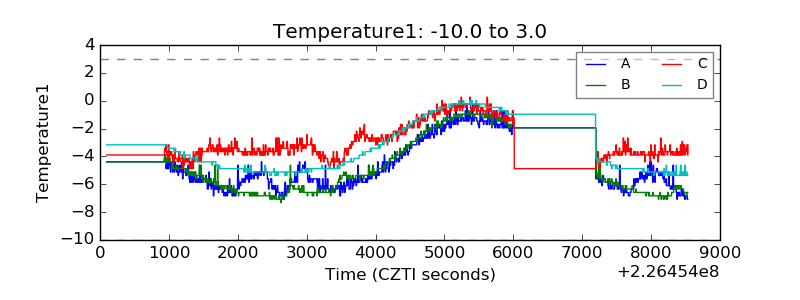 |
| Veto HV Monitor | 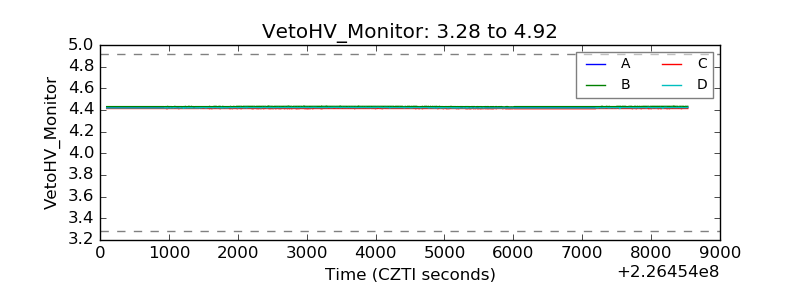 |
| Veto LLD | 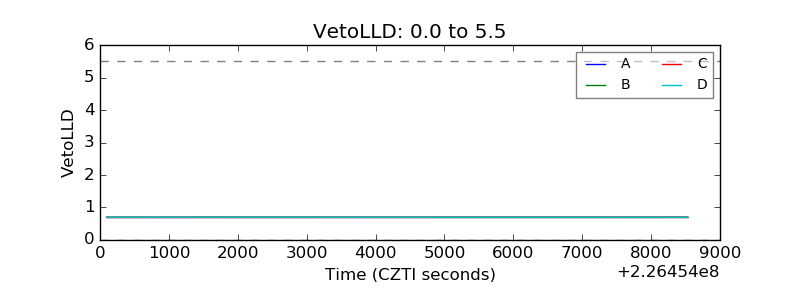 |
| Alpha Counter | 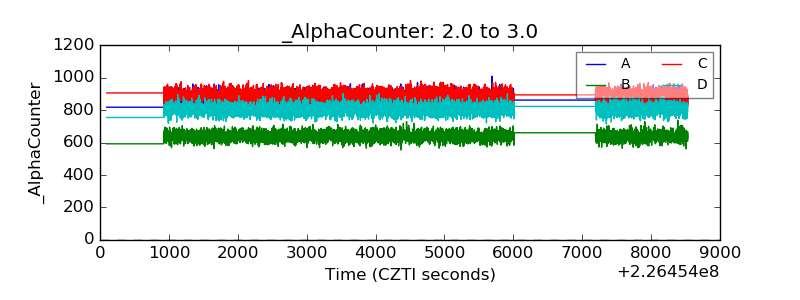 |
| _CPM_Rate | 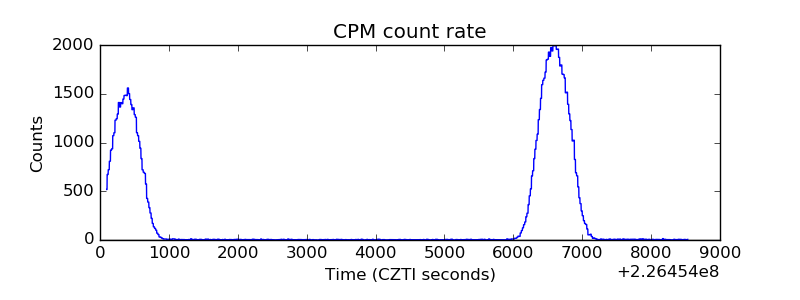 |
| CZT Counter | 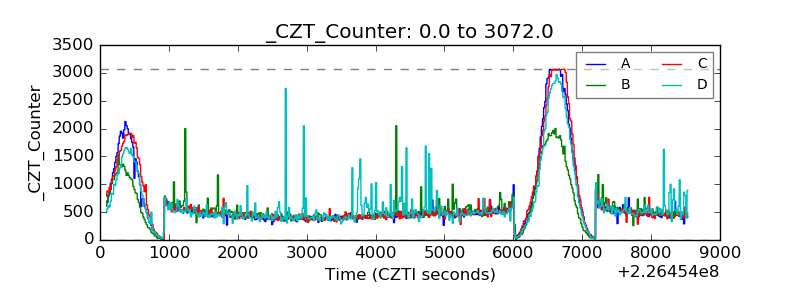 |
| +2.5 Volts monitor |  |
| +5 Volts monitor |  |
| _ROLL_ROT | 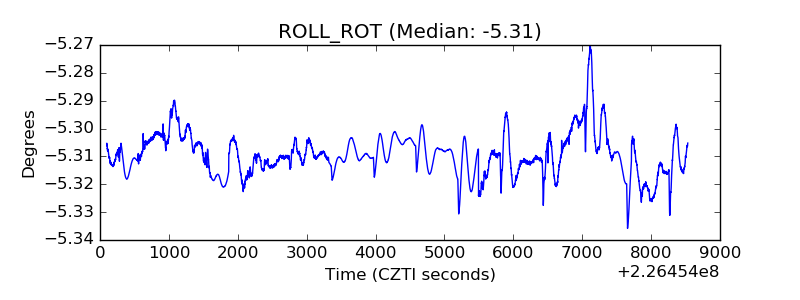 |
| _Roll_DEC |  |
| _Roll_RA | 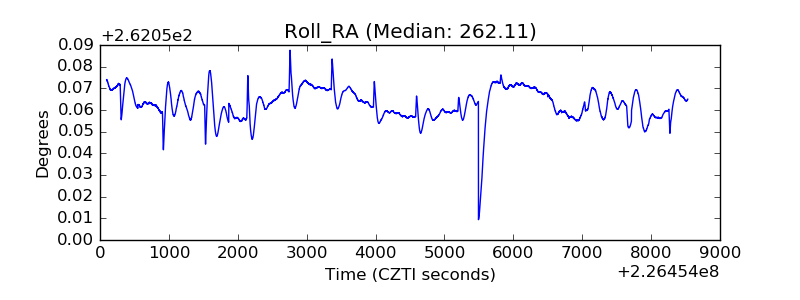 |
| Veto Counter | 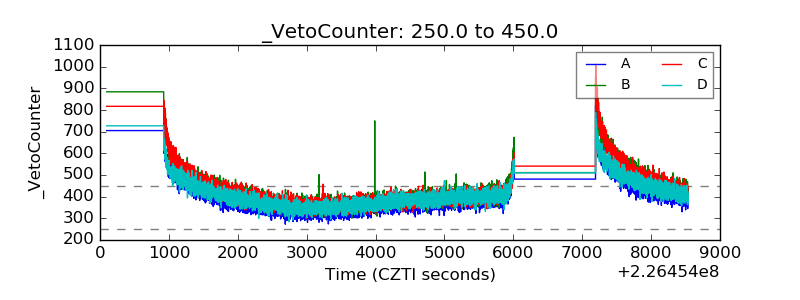 |