| Param | Original file | Final file |
|---|---|---|
| Filename | modeM0/AS1A02_132T01_9000001068_07771cztM0_level2.evt | modeM0/AS1A02_132T01_9000001068_07771cztM0_level2_quad_clean.evt |
| Size (bytes) | 473,774,400 | 101,448,000 |
| Size | 451.8 MB | 96.7 MB |
| Events in quadrant A | 3,170,183 | 654,685 |
| Events in quadrant B | 3,404,083 | 674,050 |
| Events in quadrant C | 3,156,503 | 666,125 |
| Events in quadrant D | 4,164,568 | 612,745 |
| Mode M0 | |||
|---|---|---|---|
| Quadrant | BADHDUFLAG | Total packets | Discarded packets |
| A | 0 | 13762 | 3 |
| B | 0 | 14363 | 2 |
| C | 0 | 13691 | 2 |
| D | 0 | 16692 | 2 |
| Mode SS | |||
|---|---|---|---|
| Quadrant | BADHDUFLAG | Total packets | Discarded packets |
| A | 0 | 136 | 0 |
| B | 0 | 136 | 0 |
| C | 0 | 136 | 0 |
| D | 0 | 136 | 0 |
| Mode M9 | |||
|---|---|---|---|
| Quadrant | BADHDUFLAG | Total packets | Discarded packets |
| A | 0 | 23 | 0 |
| B | 0 | 23 | 0 |
| C | 0 | 23 | 0 |
| D | 0 | 23 | 0 |
| Quadrant | Total seconds | Saturated seconds | Saturation percentage |
|---|---|---|---|
| A | 6665 | 28 | 0.420105% |
| B | 6665 | 35 | 0.525131% |
| C | 6665 | 6 | 0.090023% |
| D | 6665 | 132 | 1.980495% |
Noise dominated data is calculated using 1-second bins in cleaned event files. If a bin has >2000 counts, and if more than 50% of those come from <1% of pixels, then it is considered to be noise-dominated and hence unusable.
| Quadrant | # 1 sec bins | Bins with >0 counts | Bins with >2000 counts | High rate bins dominated by noise | Noise dominated (total time) | Noise dominated (detector-on time) | Marked lightcurve |
|---|---|---|---|---|---|---|---|
| A | 7945 | 6666 | 10 | 10 | 0.13% | 0.15% | 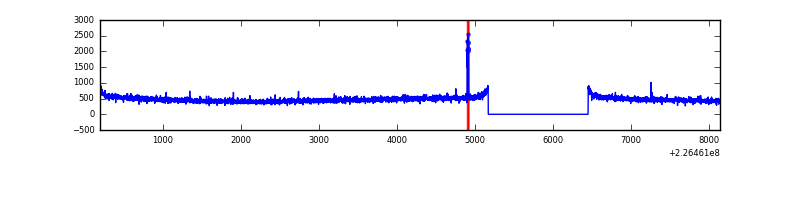 |
| B | 7945 | 6666 | 7 | 7 | 0.09% | 0.11% | 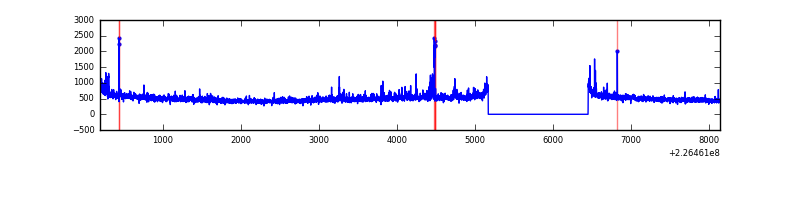 |
| C | 7945 | 6666 | 0 | 0 | 0.00% | 0.00% | 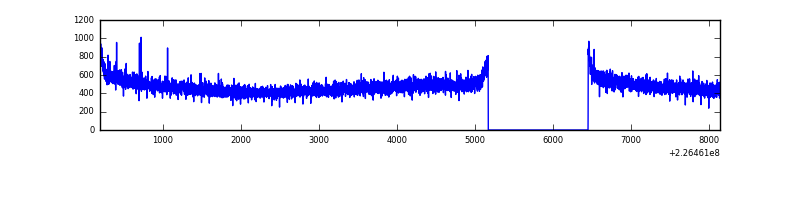 |
| D | 7945 | 6666 | 139 | 139 | 1.75% | 2.09% | 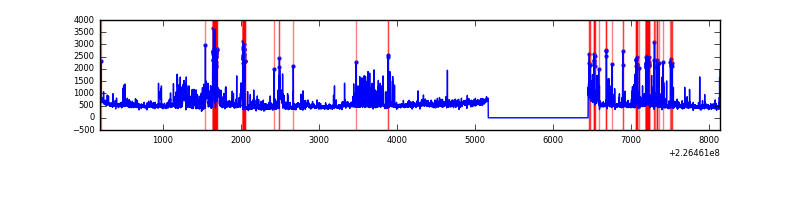 |
Top three noisy pixels from each quadrant. If the there are fewer than three noisy pixels in the level2.evt file, extra rows are filled as -1
| Pixel properties | Quadrant properties | ||||||
|---|---|---|---|---|---|---|---|
| Quadrant | DetID | PixID | Counts | Sigma | Mean | Median | Sigma |
| A | 3 | 1 | 32507 | 192.41 | 815 | 799 | 164.8 |
| A | 0 | 226 | 7551 | 40.97 | 815 | 799 | 164.8 |
| A | 12 | 194 | 7116 | 38.33 | 815 | 799 | 164.8 |
| B | 4 | 173 | 102222 | 644.56 | 831 | 812 | 157.3 |
| B | 4 | 239 | 19490 | 118.72 | 831 | 812 | 157.3 |
| B | 0 | 214 | 16938 | 102.5 | 831 | 812 | 157.3 |
| C | 13 | 61 | 6291 | 29.08 | 807 | 812 | 188.4 |
| C | 12 | 4 | 5972 | 27.39 | 807 | 812 | 188.4 |
| C | 14 | 67 | 3289 | 13.15 | 807 | 812 | 188.4 |
| D | 12 | 221 | 693025 | 3554.24 | 790 | 765 | 194.8 |
| D | 1 | 52 | 384856 | 1972.02 | 790 | 765 | 194.8 |
| D | 2 | 152 | 56136 | 284.29 | 790 | 765 | 194.8 |
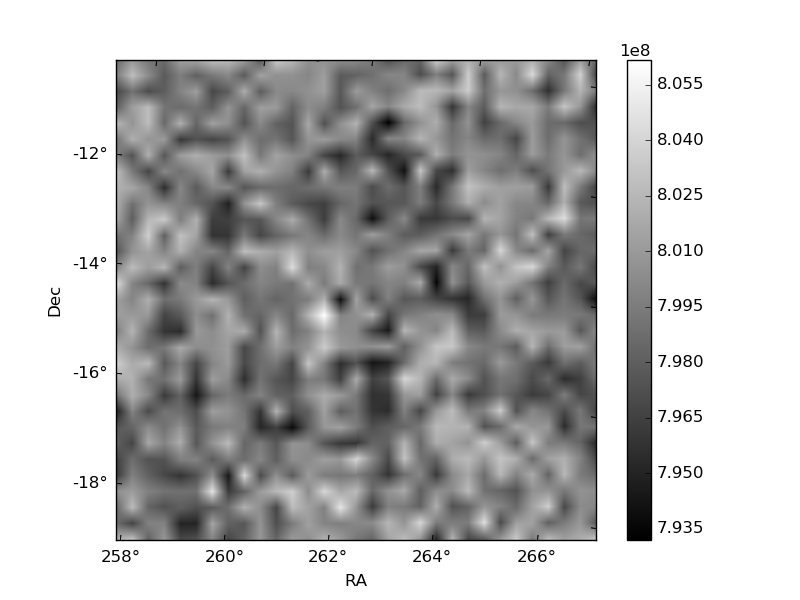
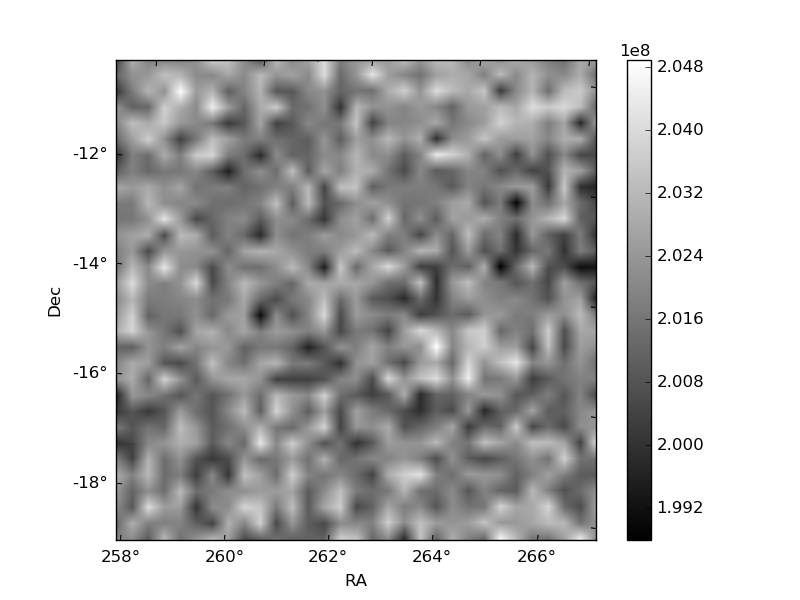
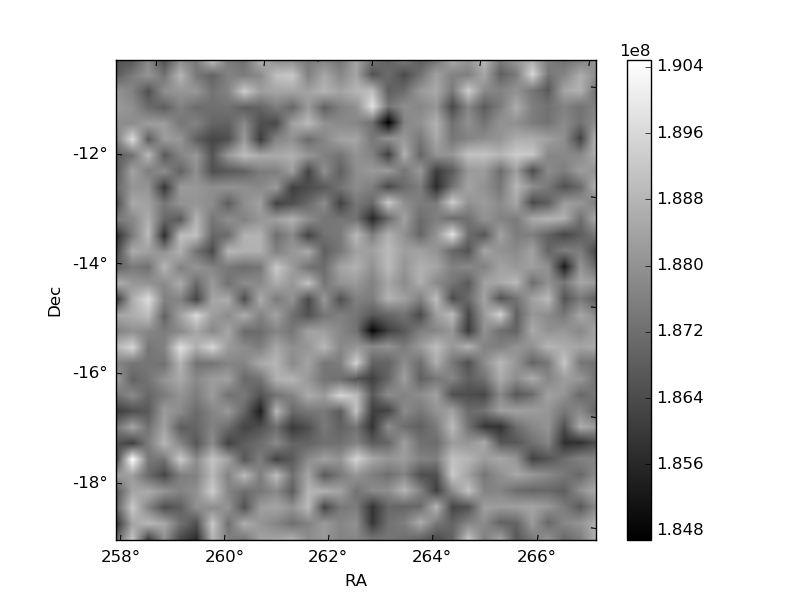
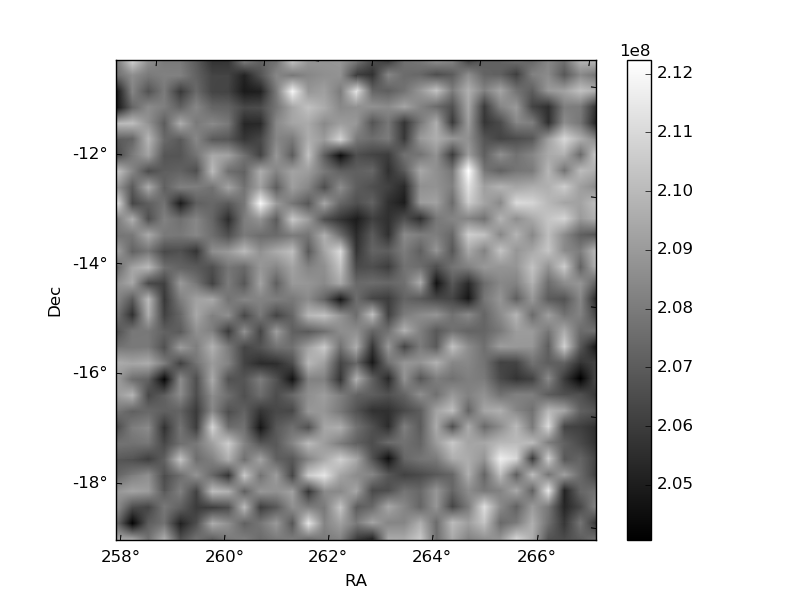
Histogram calculated using DETX and DETY for each event in the final _common_clean file
| Quadrant A | 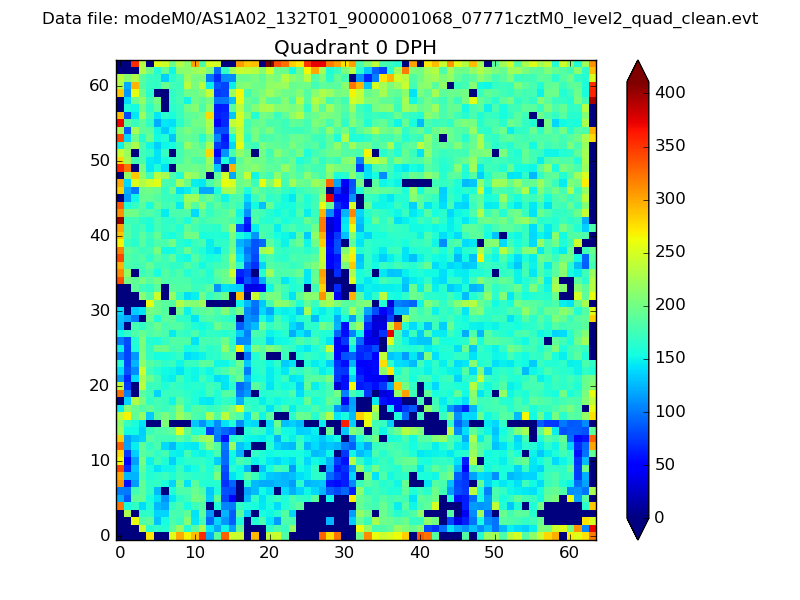 |
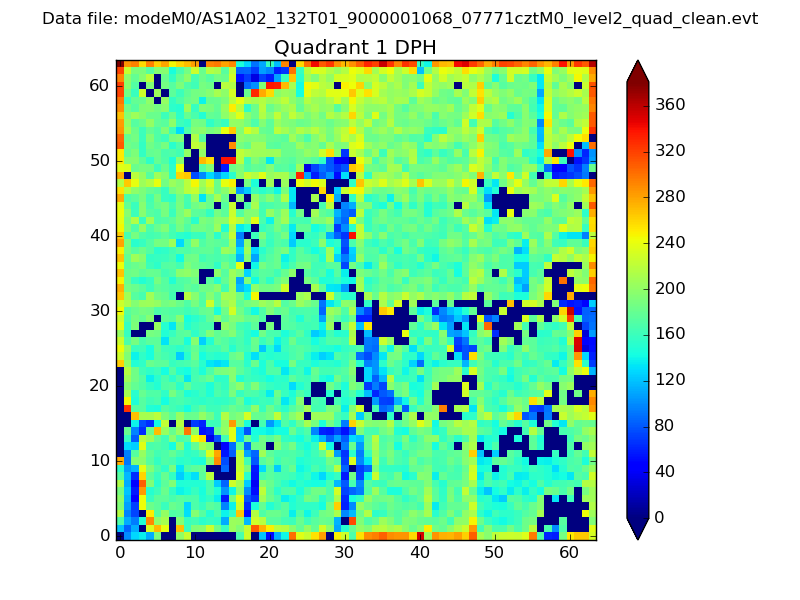 |
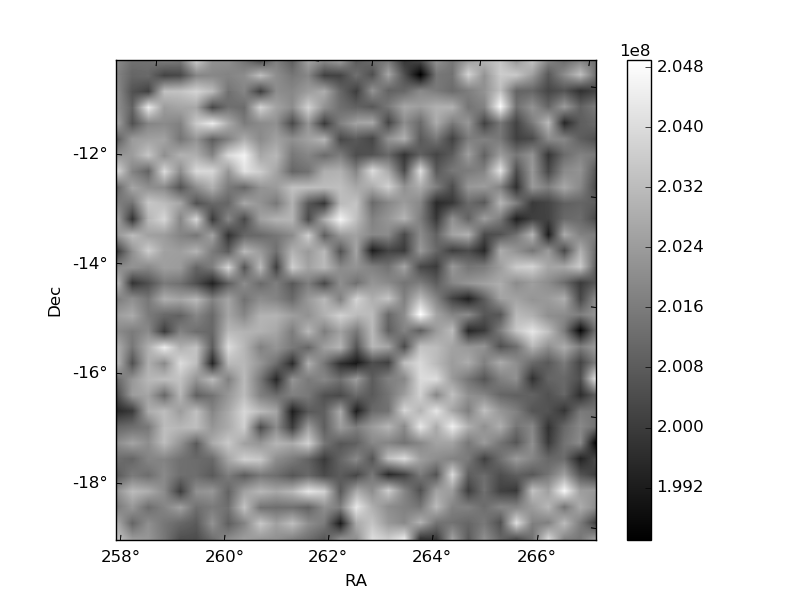
Quadrant B |
|---|---|---|---|
| Quadrant D | 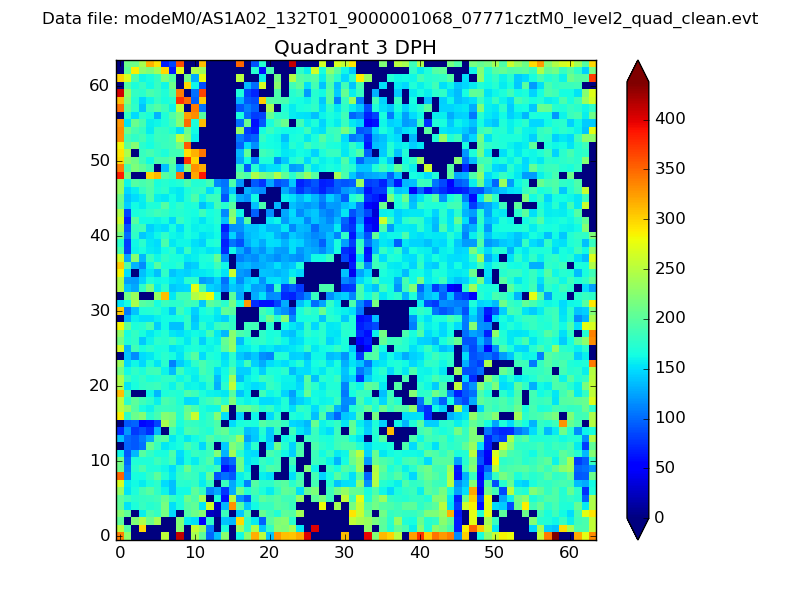 |
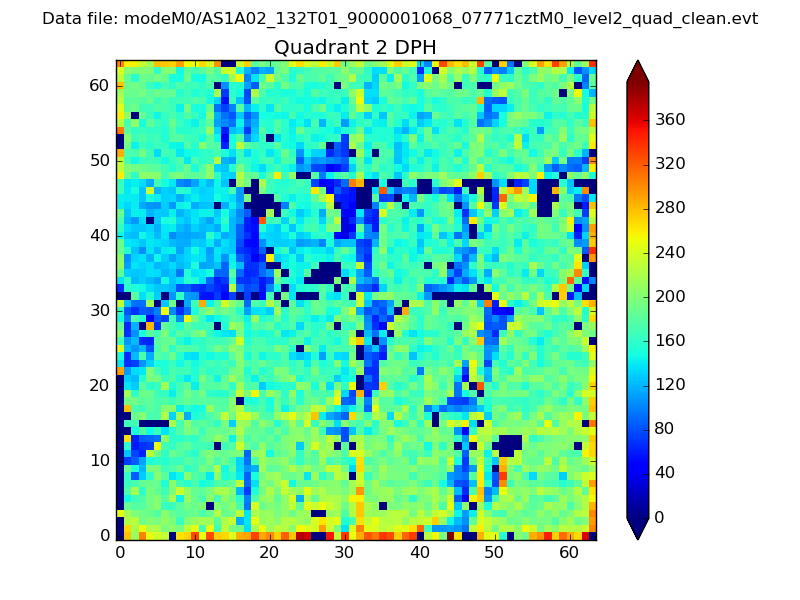 |
Quadrant C |
| Plot type | Count rate plots | Images |
|---|---|---|
| Comparison with Poisson distribution Blue bars denote a histogram of data divided into 1 sec bins. Red curve is a Poisson curve with rate = median count rate of data. |
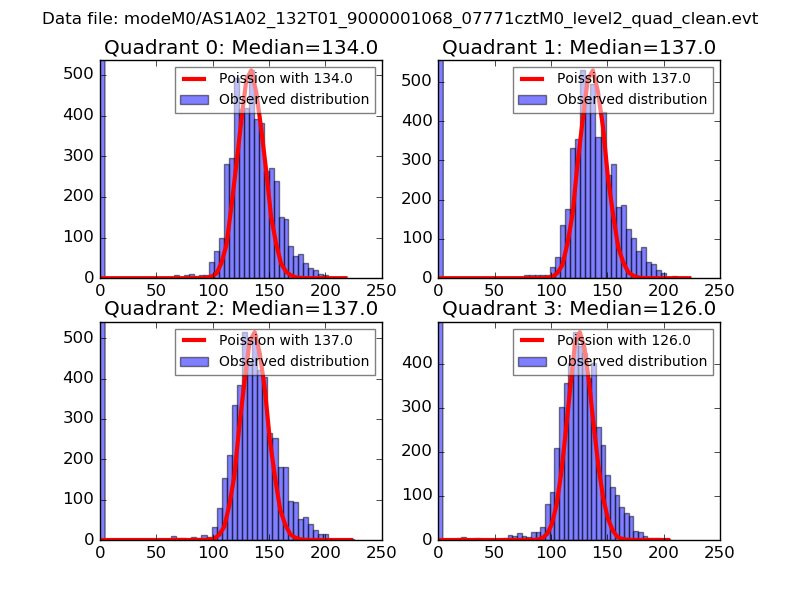 |
 |
| Quadrant-wise count rates Data is divided into 100 sec bins |
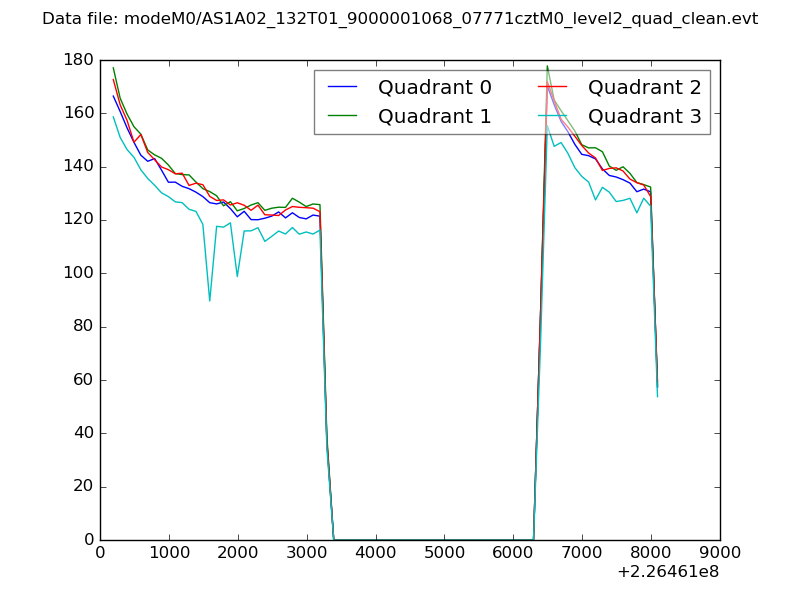 |
|
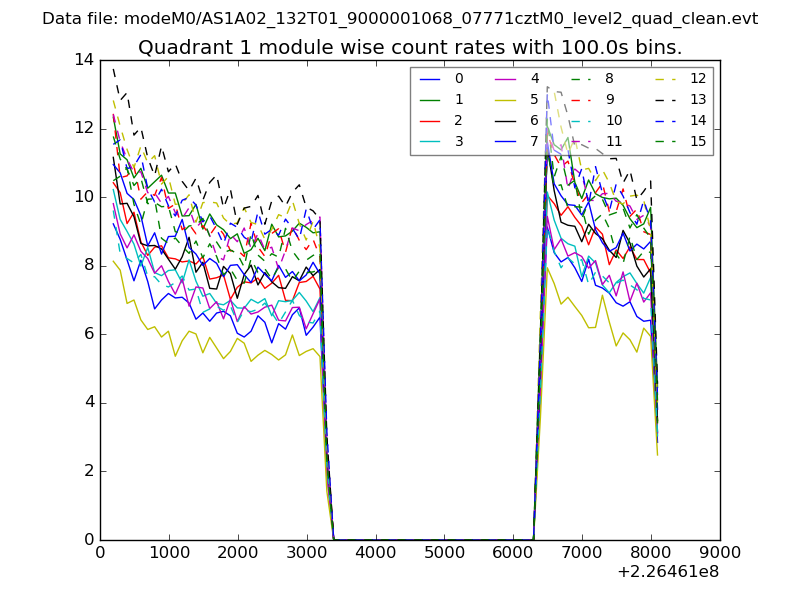
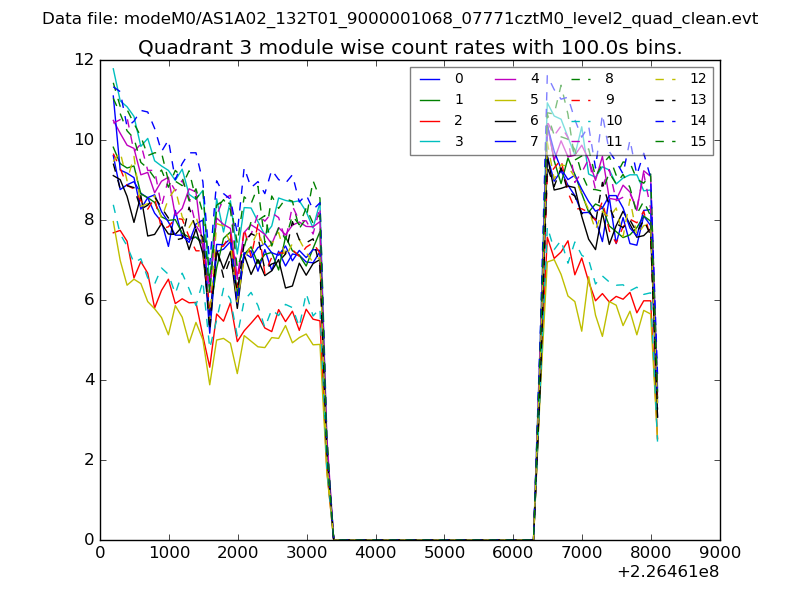
| Module-wise count rates for Quadrant A Data is divided into 100 sec bins |
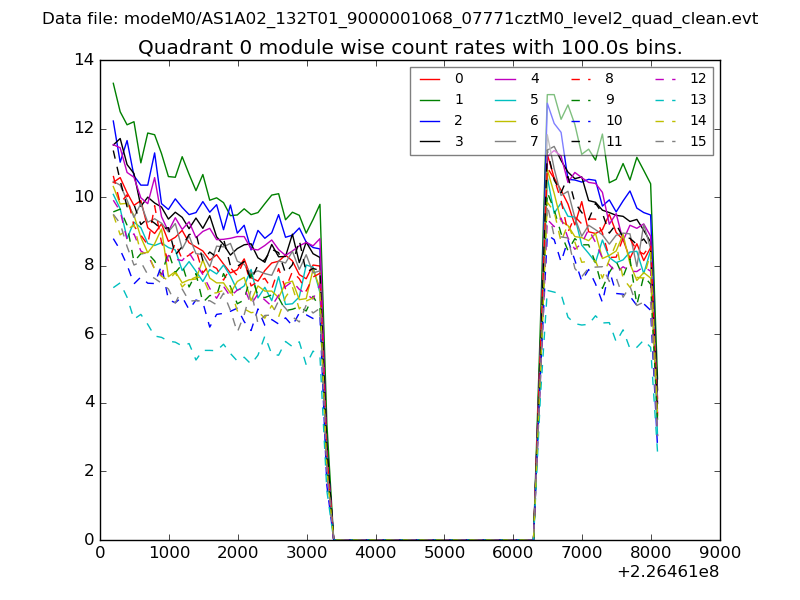 |
 |
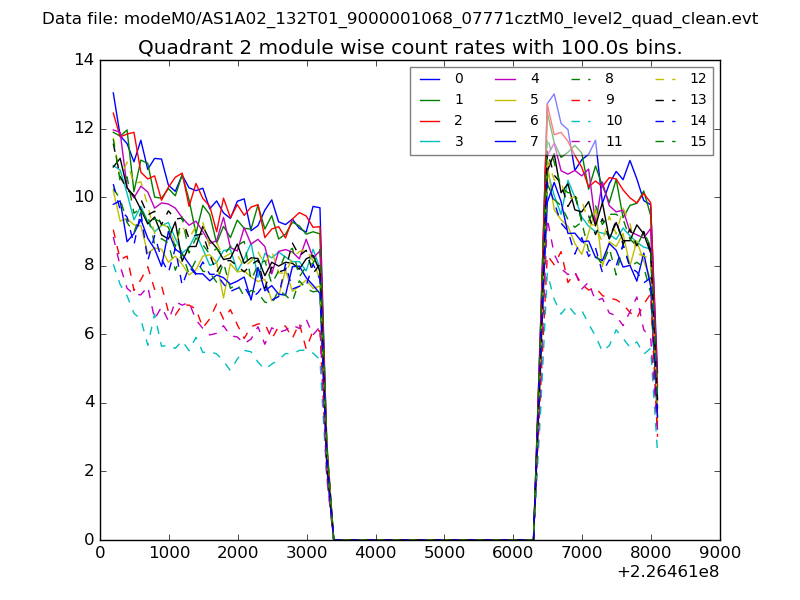
| Module-wise count rates for Quadrant B Data is divided into 100 sec bins |
 |
 |
| Module-wise count rates for Quadrant C Data is divided into 100 sec bins |
 |
 |
| Module-wise count rates for Quadrant D Data is divided into 100 sec bins |
 |
 |
| Parameter | Plot |
|---|---|
| CZT HV Monitor |  |
| D_VDD | 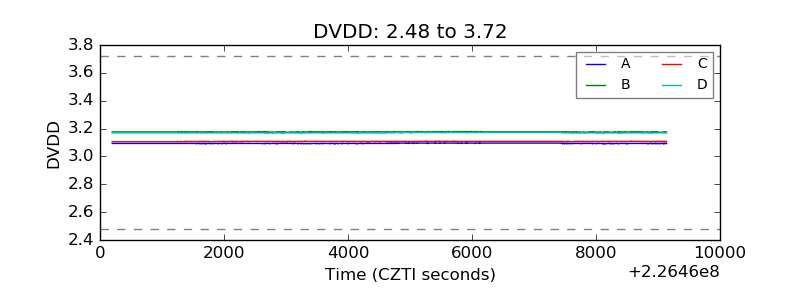 |
| Temperature 1 | 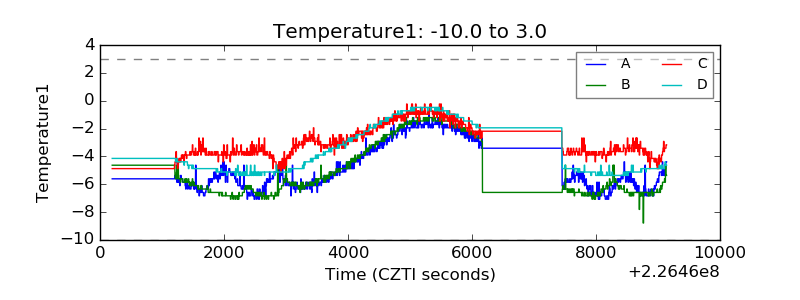 |
| Veto HV Monitor | 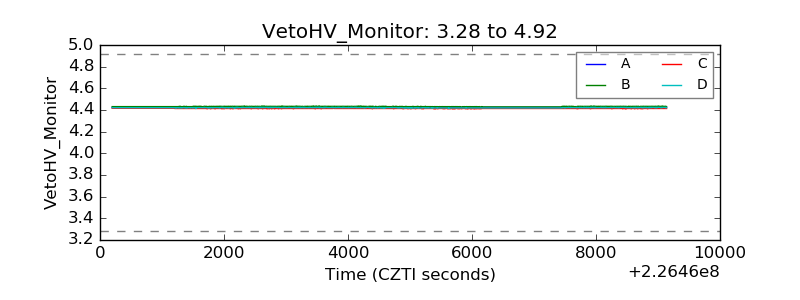 |
| Veto LLD |  |
| Alpha Counter | 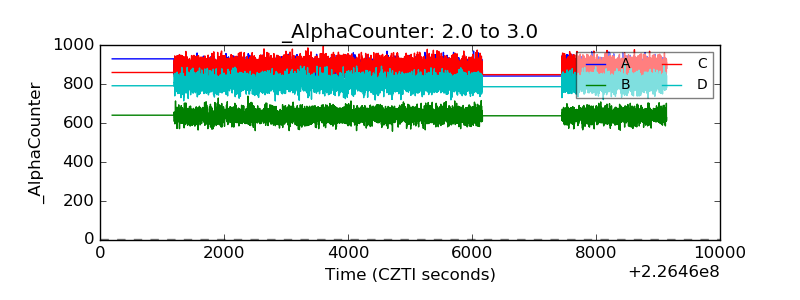 |
| _CPM_Rate | 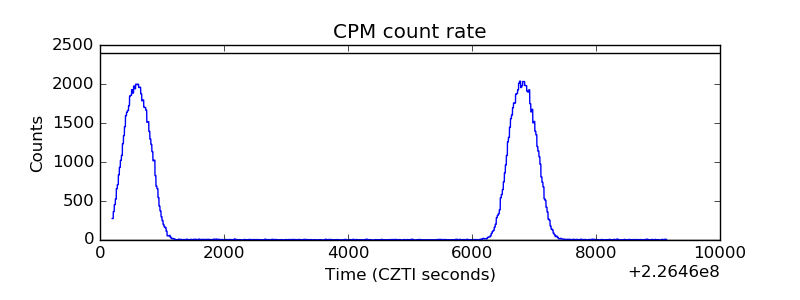 |
| CZT Counter | 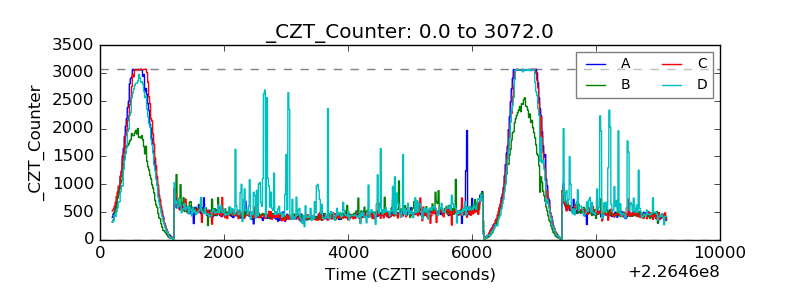 |
| +2.5 Volts monitor |  |
| +5 Volts monitor |  |
| _ROLL_ROT |  |
| _Roll_DEC |  |
| _Roll_RA | 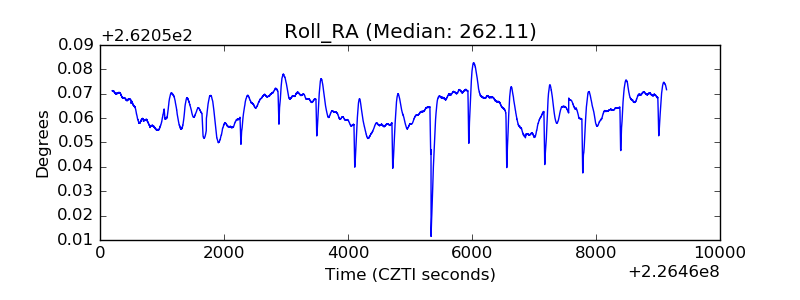 |
| Veto Counter | 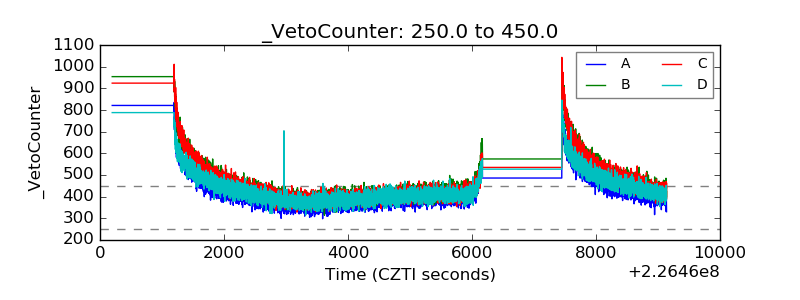 |