| Param | Original file | Final file |
|---|---|---|
| Filename | modeM0/AS1A02_132T01_9000001068_07777cztM0_level2.evt | modeM0/AS1A02_132T01_9000001068_07777cztM0_level2_quad_clean.evt |
| Size (bytes) | 537,396,480 | 79,715,520 |
| Size | 512.5 MB | 76.0 MB |
| Events in quadrant A | 3,582,895 | 474,068 |
| Events in quadrant B | 3,810,761 | 485,315 |
| Events in quadrant C | 3,547,109 | 484,478 |
| Events in quadrant D | 4,817,697 | 440,346 |
| Mode M0 | |||
|---|---|---|---|
| Quadrant | BADHDUFLAG | Total packets | Discarded packets |
| A | 0 | 15837 | 2 |
| B | 0 | 16298 | 1 |
| C | 0 | 15874 | 1 |
| D | 0 | 19603 | 1 |
| Mode SS | |||
|---|---|---|---|
| Quadrant | BADHDUFLAG | Total packets | Discarded packets |
| A | 0 | 154 | 0 |
| B | 0 | 154 | 0 |
| C | 0 | 154 | 0 |
| D | 0 | 154 | 0 |
| Mode M9 | |||
|---|---|---|---|
| Quadrant | BADHDUFLAG | Total packets | Discarded packets |
| A | 0 | 1 | 0 |
| B | 0 | 1 | 0 |
| C | 0 | 1 | 0 |
| D | 0 | 1 | 0 |
| Quadrant | Total seconds | Saturated seconds | Saturation percentage |
|---|---|---|---|
| A | 7606 | 205 | 2.695241% |
| B | 7606 | 242 | 3.181699% |
| C | 7606 | 146 | 1.919537% |
| D | 7606 | 499 | 6.560610% |
Noise dominated data is calculated using 1-second bins in cleaned event files. If a bin has >2000 counts, and if more than 50% of those come from <1% of pixels, then it is considered to be noise-dominated and hence unusable.
| Quadrant | # 1 sec bins | Bins with >0 counts | Bins with >2000 counts | High rate bins dominated by noise | Noise dominated (total time) | Noise dominated (detector-on time) | Marked lightcurve |
|---|---|---|---|---|---|---|---|
| A | 7711 | 7606 | 0 | 0 | 0.00% | 0.00% | 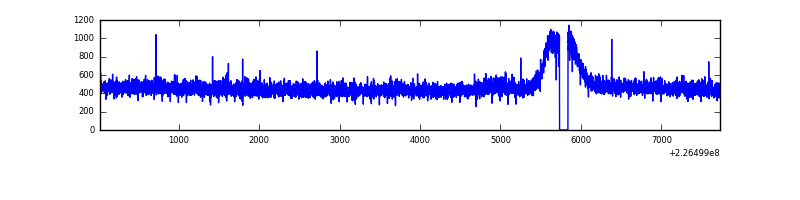 |
| B | 7711 | 7606 | 16 | 16 | 0.21% | 0.21% | 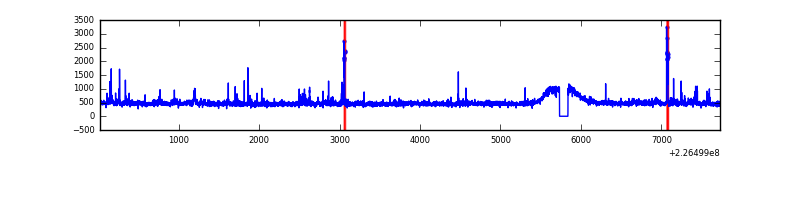 |
| C | 7711 | 7606 | 1 | 1 | 0.01% | 0.01% | 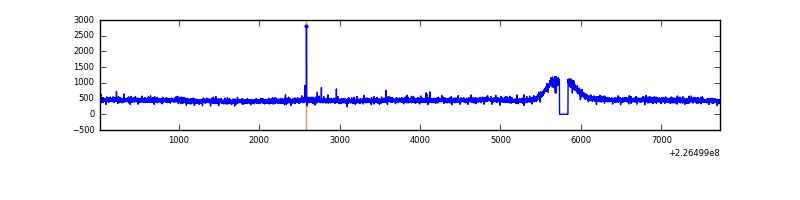 |
| D | 7711 | 7606 | 340 | 340 | 4.41% | 4.47% | 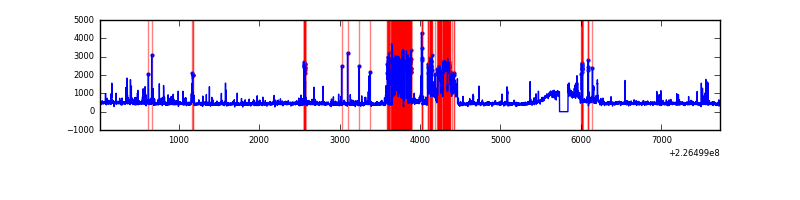 |
Top three noisy pixels from each quadrant. If the there are fewer than three noisy pixels in the level2.evt file, extra rows are filled as -1
| Pixel properties | Quadrant properties | ||||||
|---|---|---|---|---|---|---|---|
| Quadrant | DetID | PixID | Counts | Sigma | Mean | Median | Sigma |
| A | 8 | 15 | 25060 | 126.52 | 923 | 902 | 190.9 |
| A | 0 | 226 | 8977 | 42.29 | 923 | 902 | 190.9 |
| A | 12 | 194 | 8109 | 37.74 | 923 | 902 | 190.9 |
| B | 4 | 239 | 87219 | 482.32 | 927 | 903 | 179.0 |
| B | 4 | 173 | 39493 | 215.64 | 927 | 903 | 179.0 |
| B | 0 | 214 | 29042 | 157.24 | 927 | 903 | 179.0 |
| C | 12 | 4 | 11286 | 48.64 | 904 | 909 | 213.4 |
| C | 13 | 61 | 6975 | 28.43 | 904 | 909 | 213.4 |
| C | 8 | 128 | 5295 | 20.56 | 904 | 909 | 213.4 |
| D | 1 | 52 | 1223113 | 5516.79 | 895 | 867 | 221.6 |
| D | 13 | 238 | 66039 | 294.16 | 895 | 867 | 221.6 |
| D | 2 | 14 | 45096 | 199.63 | 895 | 867 | 221.6 |
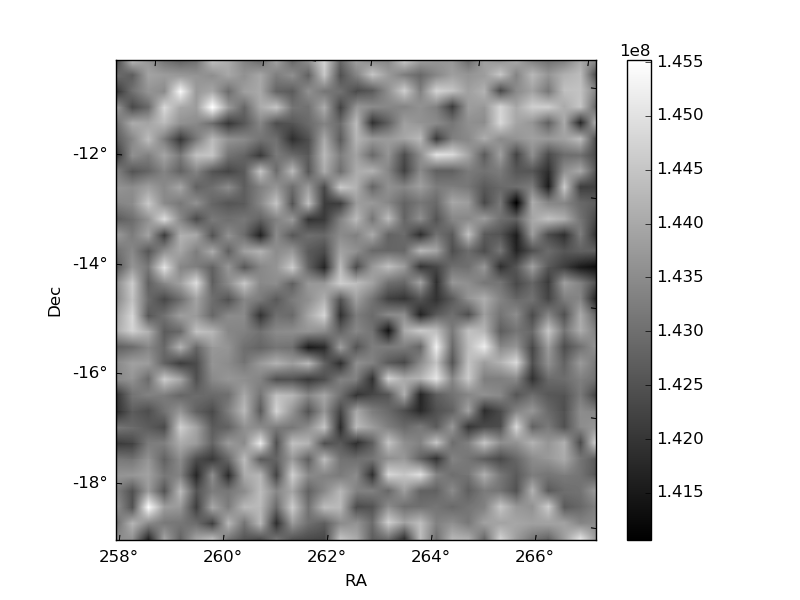
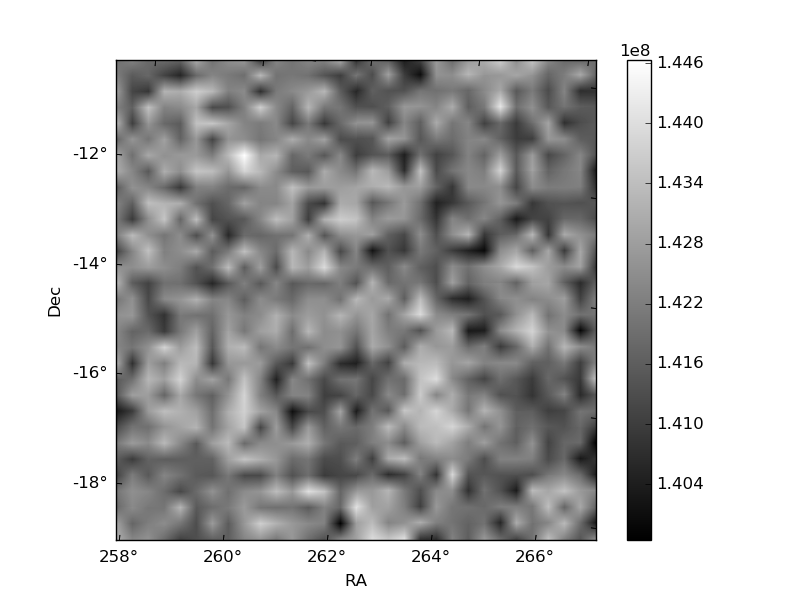
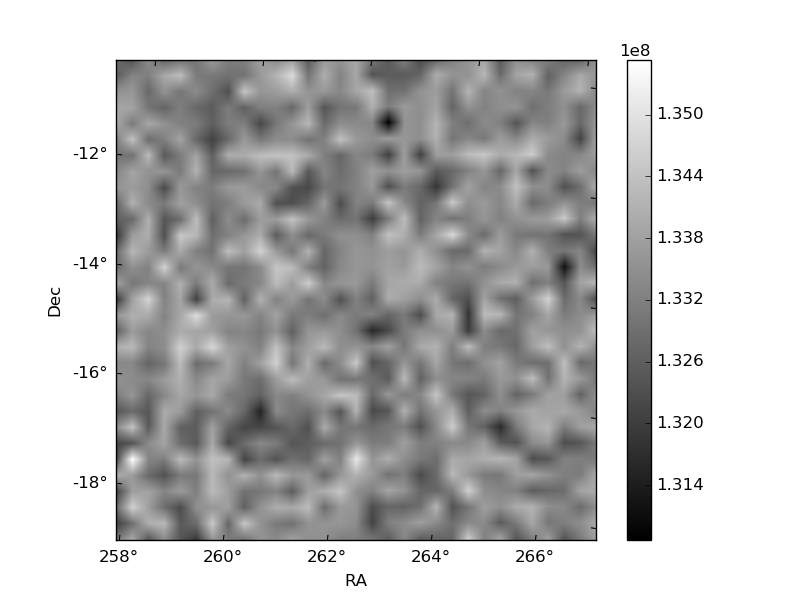
Histogram calculated using DETX and DETY for each event in the final _common_clean file
| Quadrant A | 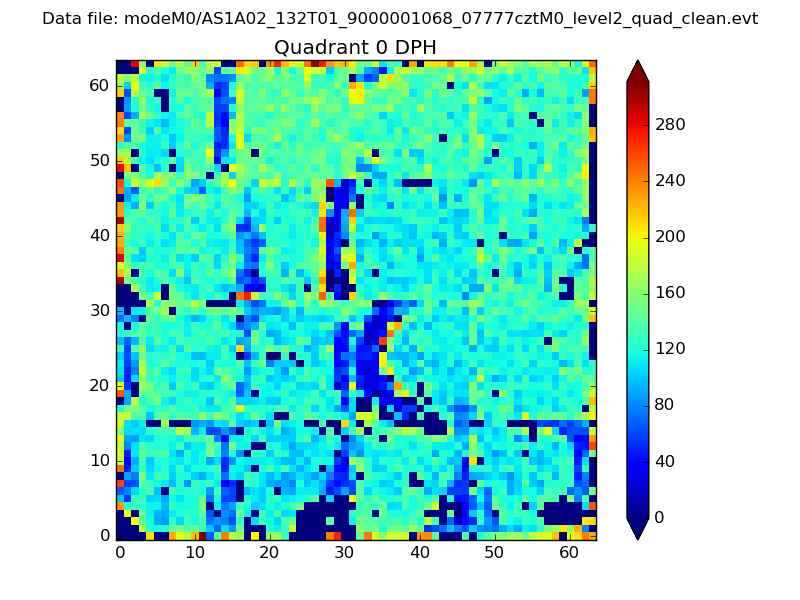 |
 |
Quadrant B |
|---|---|---|---|
| Quadrant D | 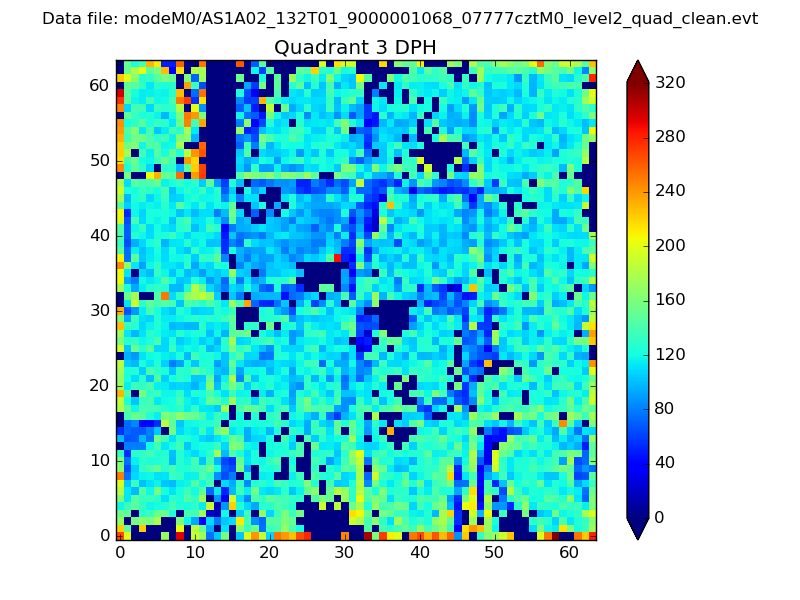 |
 |
Quadrant C |
| Plot type | Count rate plots | Images |
|---|---|---|
| Comparison with Poisson distribution Blue bars denote a histogram of data divided into 1 sec bins. Red curve is a Poisson curve with rate = median count rate of data. |
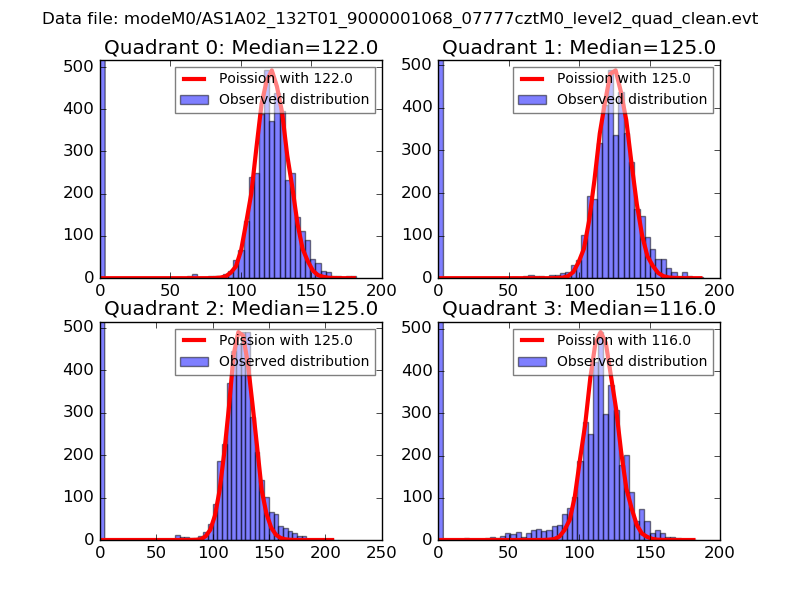 |
 |
| Quadrant-wise count rates Data is divided into 100 sec bins |
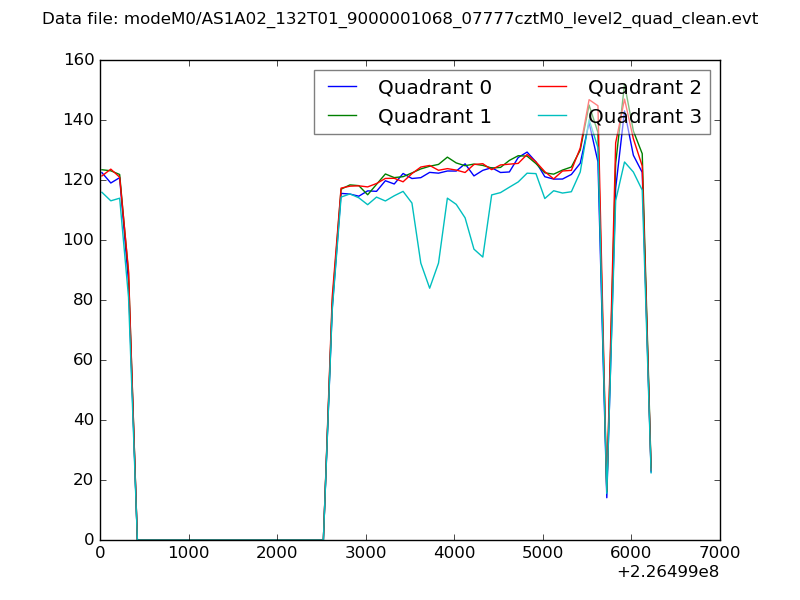 |
|
| Module-wise count rates for Quadrant A Data is divided into 100 sec bins |
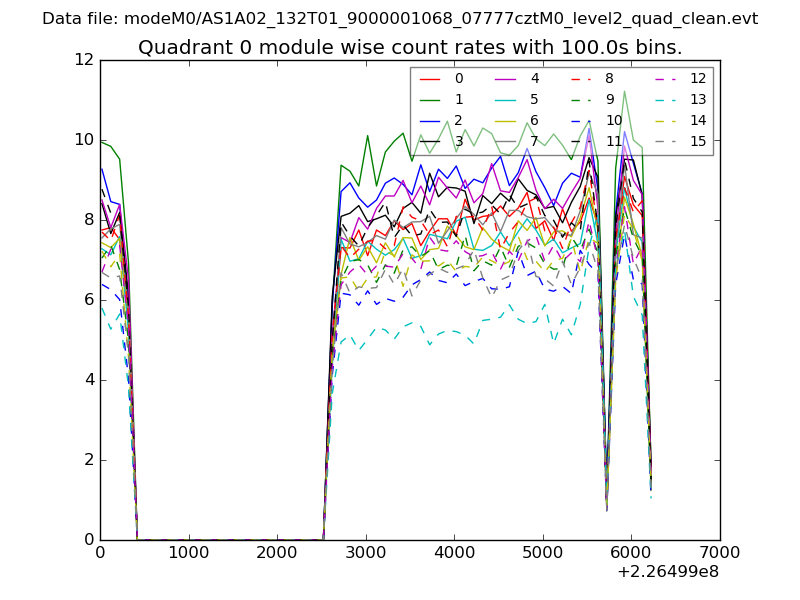 |
 |
| Module-wise count rates for Quadrant B Data is divided into 100 sec bins |
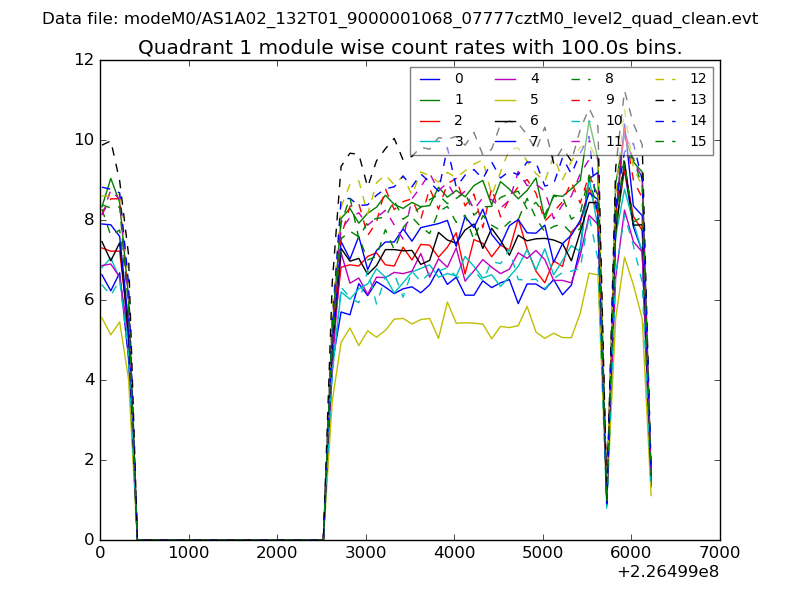 |
 |
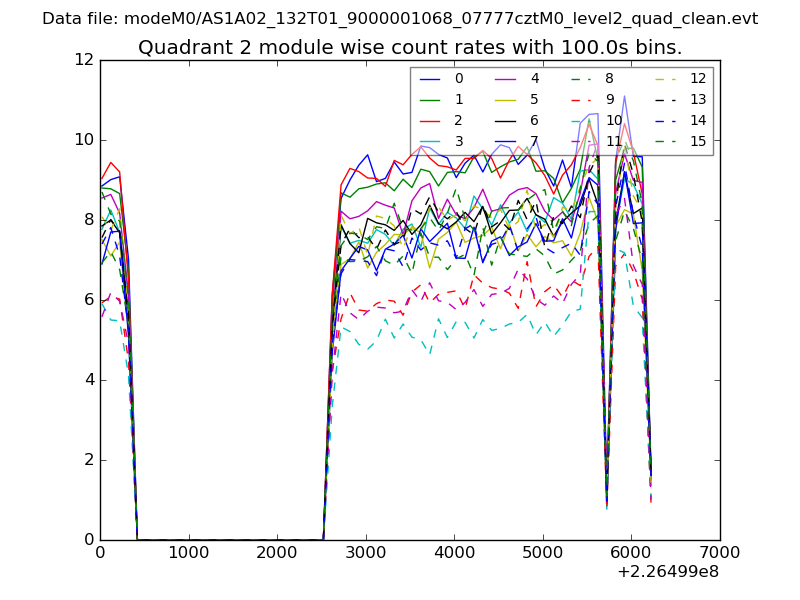
| Module-wise count rates for Quadrant C Data is divided into 100 sec bins |
 |
 |
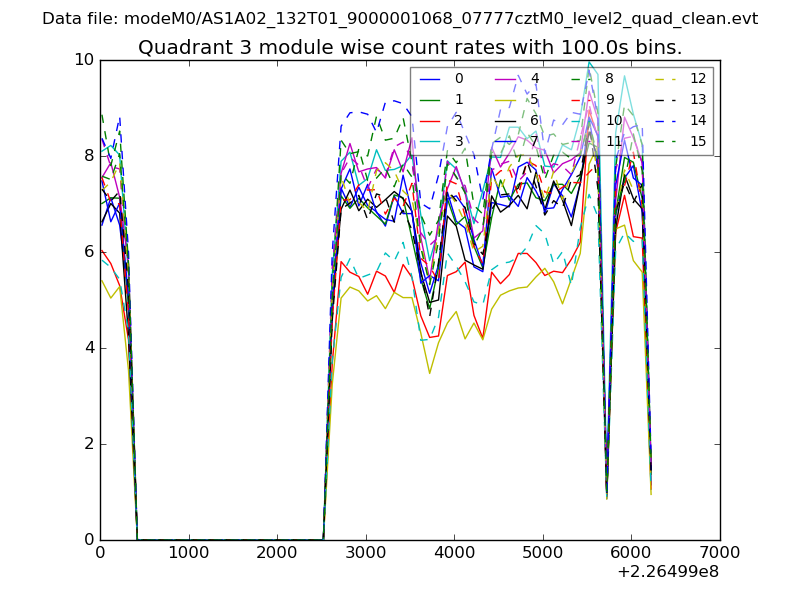
| Module-wise count rates for Quadrant D Data is divided into 100 sec bins |
 |
 |
| Parameter | Plot |
|---|---|
| CZT HV Monitor | 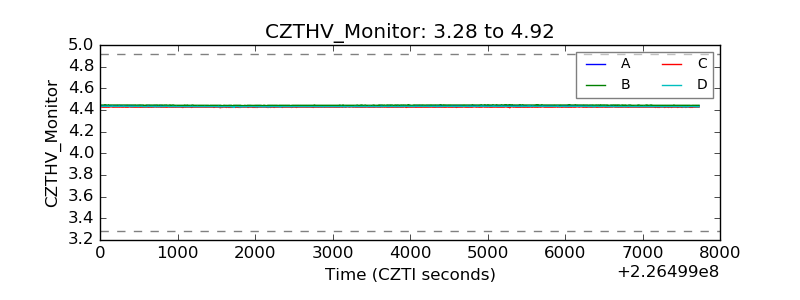 |
| D_VDD | 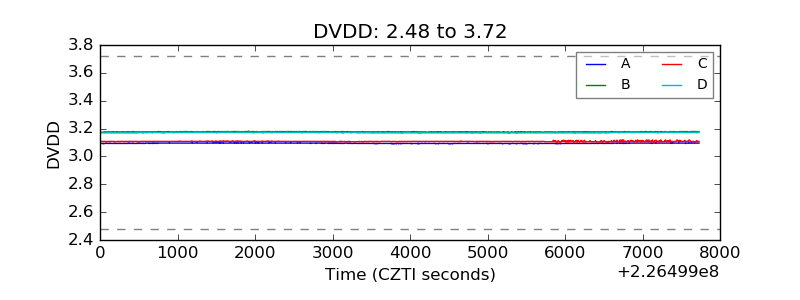 |
| Temperature 1 |  |
| Veto HV Monitor | 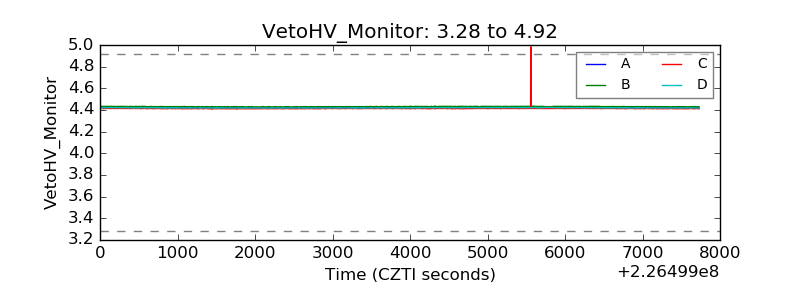 |
| Veto LLD | 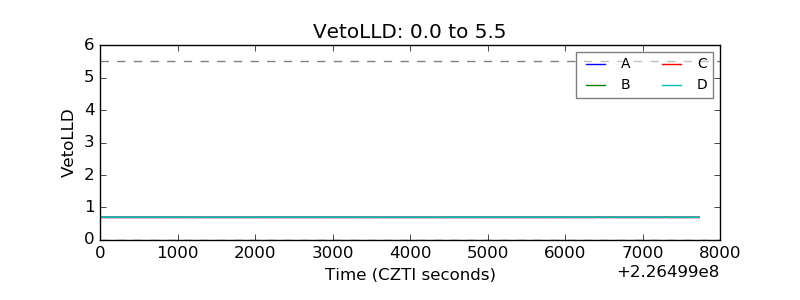 |
| Alpha Counter | 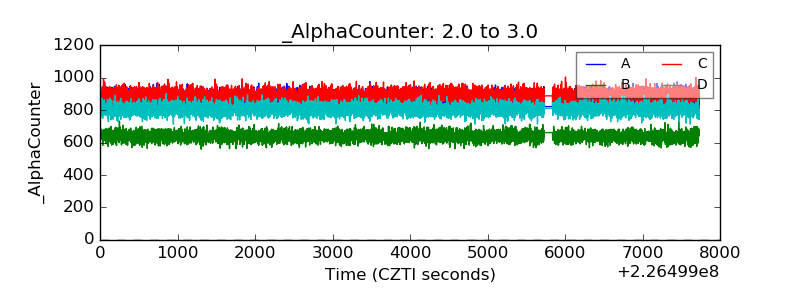 |
| _CPM_Rate | 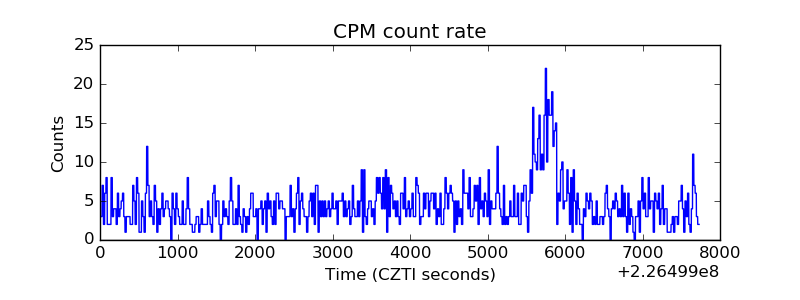 |
| CZT Counter |  |
| +2.5 Volts monitor |  |
| +5 Volts monitor | 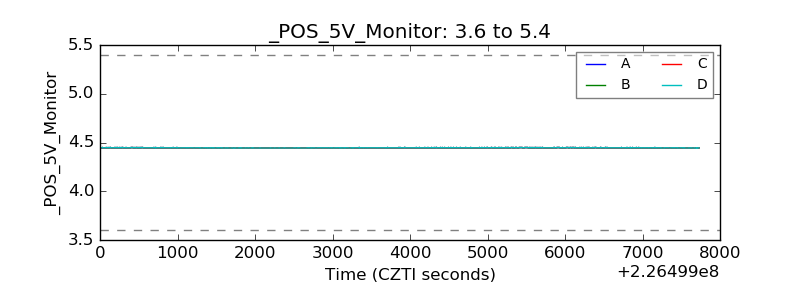 |
| _ROLL_ROT | 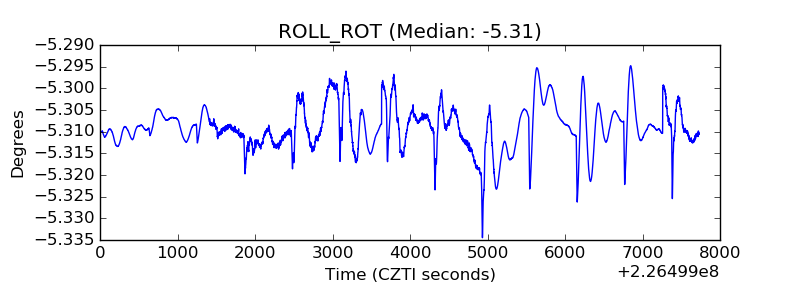 |
| _Roll_DEC | 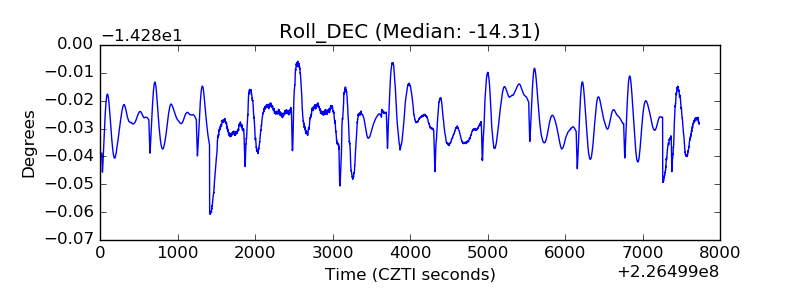 |
| _Roll_RA | 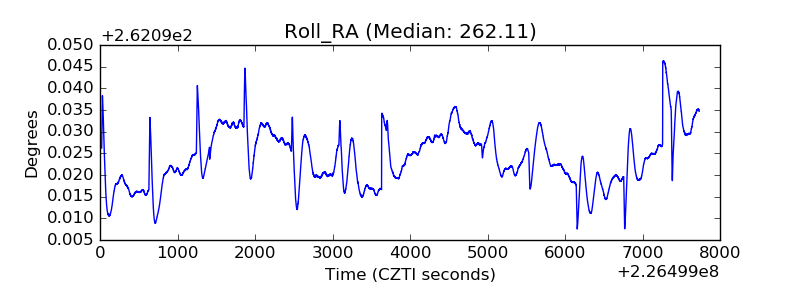 |
| Veto Counter | 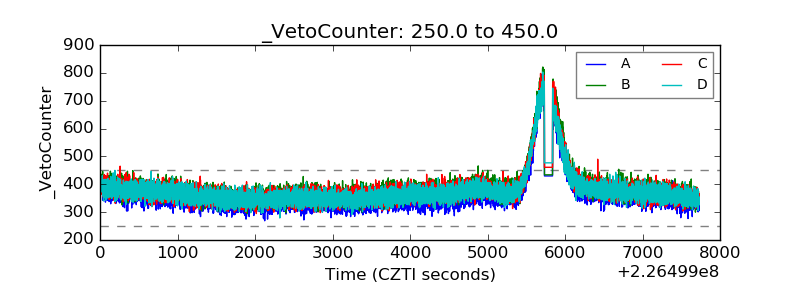 |