| Param | Original file | Final file |
|---|---|---|
| Filename | modeM0/AS1A02_132T01_9000001068_07781cztM0_level2.evt | modeM0/AS1A02_132T01_9000001068_07781cztM0_level2_quad_clean.evt |
| Size (bytes) | 1,251,354,240 | 221,319,360 |
| Size | 1.2 GB | 211.1 MB |
| Events in quadrant A | 8,540,783 | 1,367,220 |
| Events in quadrant B | 9,124,549 | 1,387,377 |
| Events in quadrant C | 8,446,212 | 1,380,258 |
| Events in quadrant D | 10,538,430 | 1,297,368 |
| Mode M0 | |||
|---|---|---|---|
| Quadrant | BADHDUFLAG | Total packets | Discarded packets |
| A | 0 | 38030 | 5 |
| B | 0 | 39222 | 4 |
| C | 0 | 37854 | 4 |
| D | 0 | 44061 | 6 |
| Mode SS | |||
|---|---|---|---|
| Quadrant | BADHDUFLAG | Total packets | Discarded packets |
| A | 0 | 378 | 0 |
| B | 0 | 378 | 0 |
| C | 0 | 378 | 0 |
| D | 0 | 378 | 0 |
| Mode M9 | |||
|---|---|---|---|
| Quadrant | BADHDUFLAG | Total packets | Discarded packets |
| A | 0 | 22 | 0 |
| B | 0 | 22 | 0 |
| C | 0 | 22 | 0 |
| D | 0 | 22 | 0 |
| Quadrant | Total seconds | Saturated seconds | Saturation percentage |
|---|---|---|---|
| A | 18435 | 290 | 1.573095% |
| B | 18435 | 357 | 1.936534% |
| C | 18435 | 212 | 1.149986% |
| D | 18434 | 676 | 3.667137% |
Noise dominated data is calculated using 1-second bins in cleaned event files. If a bin has >2000 counts, and if more than 50% of those come from <1% of pixels, then it is considered to be noise-dominated and hence unusable.
| Quadrant | # 1 sec bins | Bins with >0 counts | Bins with >2000 counts | High rate bins dominated by noise | Noise dominated (total time) | Noise dominated (detector-on time) | Marked lightcurve |
|---|---|---|---|---|---|---|---|
| A | 20735 | 18435 | 0 | 0 | 0.00% | 0.00% | 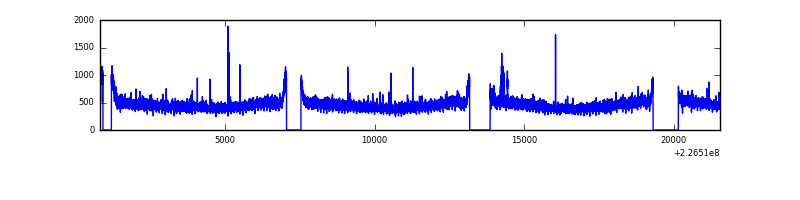 |
| B | 20735 | 18435 | 27 | 27 | 0.13% | 0.15% | 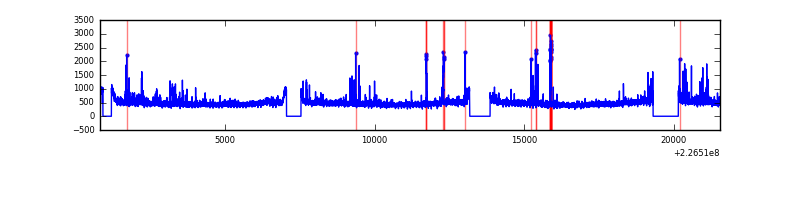 |
| C | 20735 | 18435 | 2 | 2 | 0.01% | 0.01% | 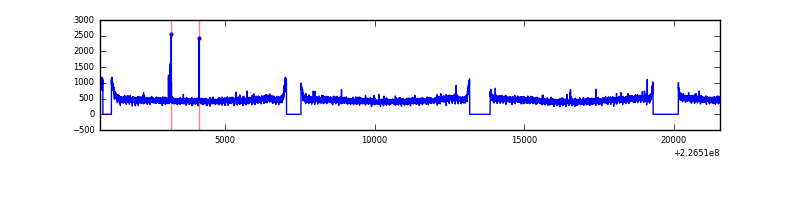 |
| D | 20735 | 18435 | 340 | 340 | 1.64% | 1.84% | 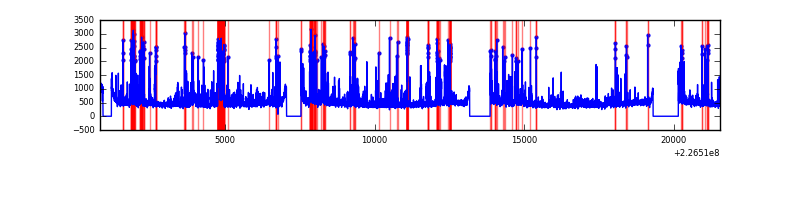 |
Top three noisy pixels from each quadrant. If the there are fewer than three noisy pixels in the level2.evt file, extra rows are filled as -1
| Pixel properties | Quadrant properties | ||||||
|---|---|---|---|---|---|---|---|
| Quadrant | DetID | PixID | Counts | Sigma | Mean | Median | Sigma |
| A | 0 | 128 | 44524 | 94.39 | 2202 | 2148 | 448.9 |
| A | 0 | 226 | 21089 | 42.19 | 2202 | 2148 | 448.9 |
| A | 12 | 194 | 19545 | 38.75 | 2202 | 2148 | 448.9 |
| B | 4 | 239 | 238085 | 556.75 | 2214 | 2158 | 423.8 |
| B | 4 | 173 | 80851 | 185.7 | 2214 | 2158 | 423.8 |
| B | 4 | 81 | 73786 | 169.03 | 2214 | 2158 | 423.8 |
| C | 12 | 4 | 29197 | 53.77 | 2153 | 2161 | 502.8 |
| C | 13 | 61 | 16557 | 28.63 | 2153 | 2161 | 502.8 |
| C | 1 | 16 | 14948 | 25.43 | 2153 | 2161 | 502.8 |
| D | 1 | 52 | 1220098 | 2339.79 | 2128 | 2065 | 520.6 |
| D | 13 | 104 | 977310 | 1873.41 | 2128 | 2065 | 520.6 |
| D | 12 | 233 | 75358 | 140.79 | 2128 | 2065 | 520.6 |
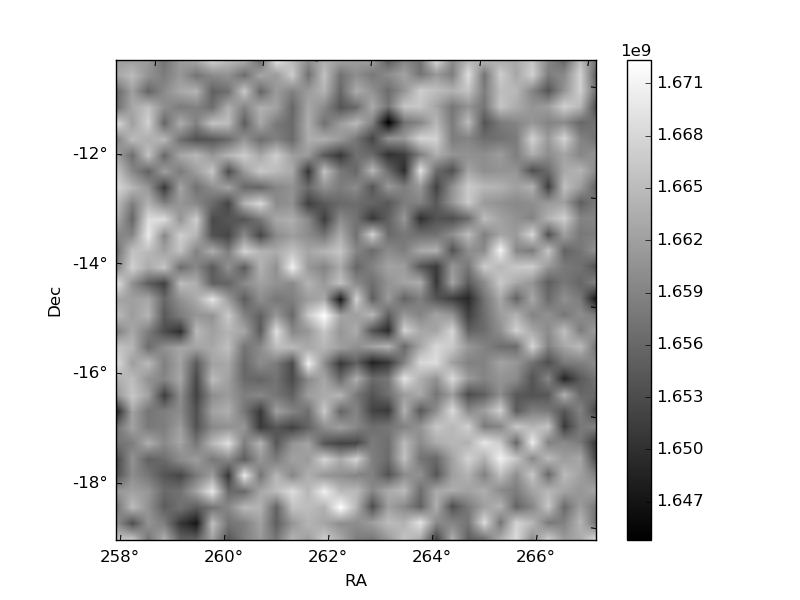
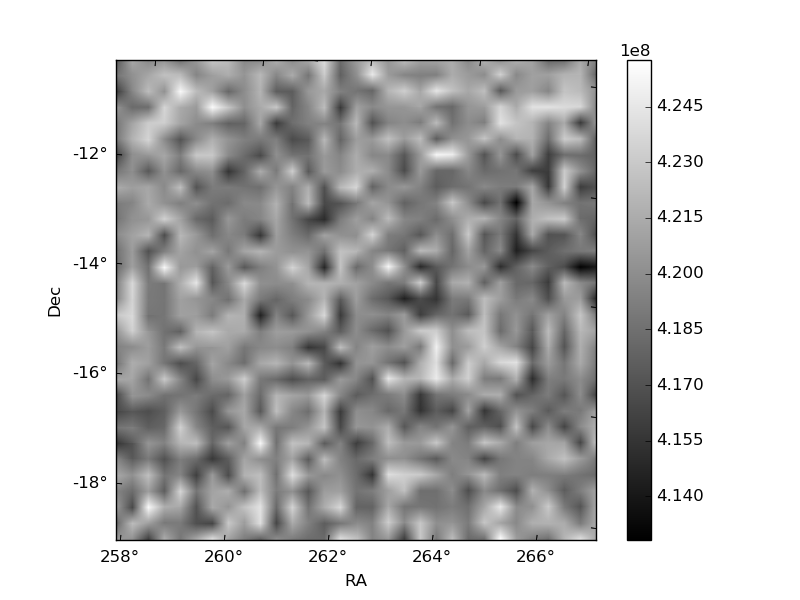
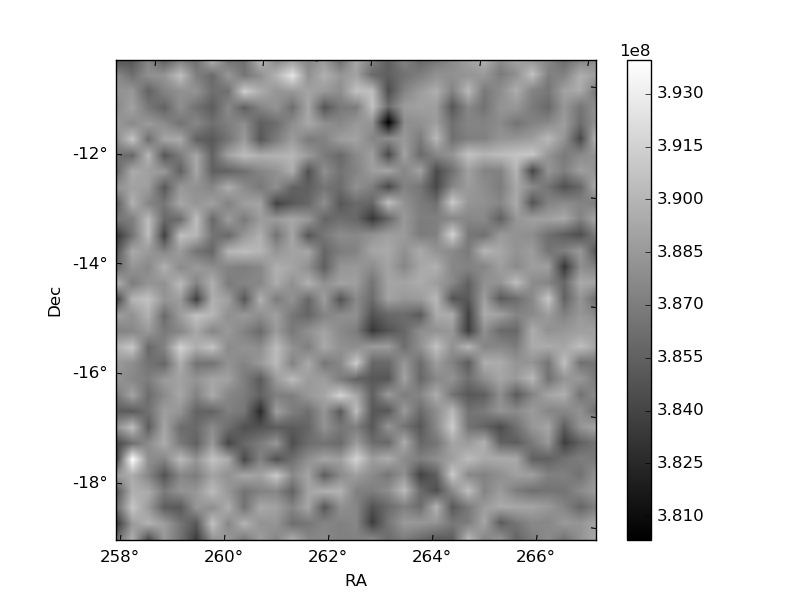
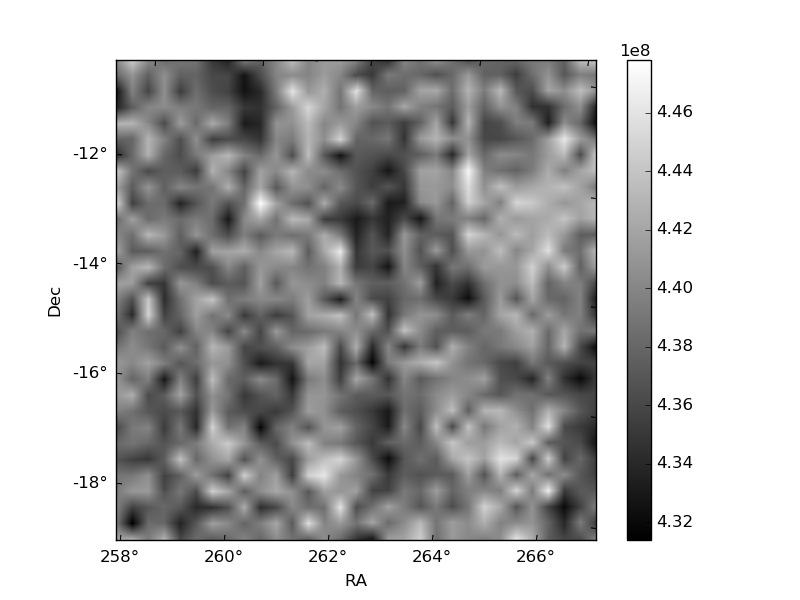
Histogram calculated using DETX and DETY for each event in the final _common_clean file
| Quadrant A | 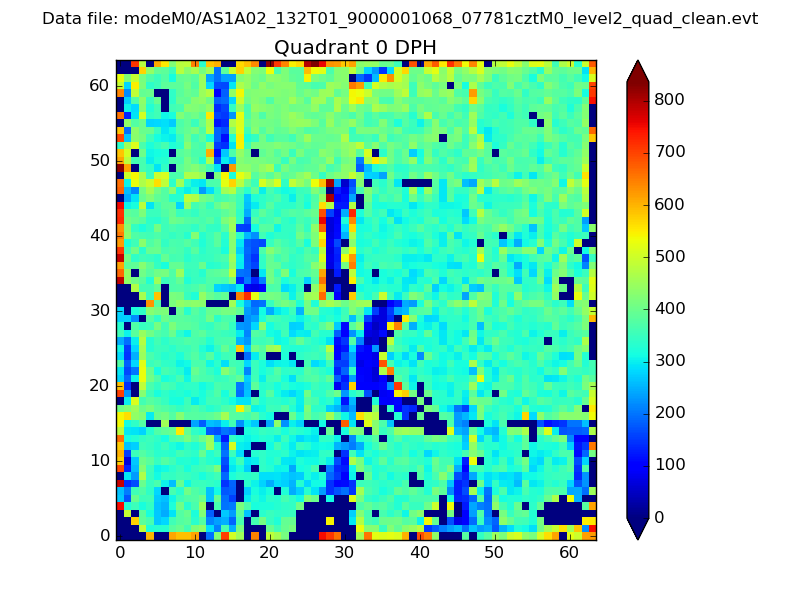 |
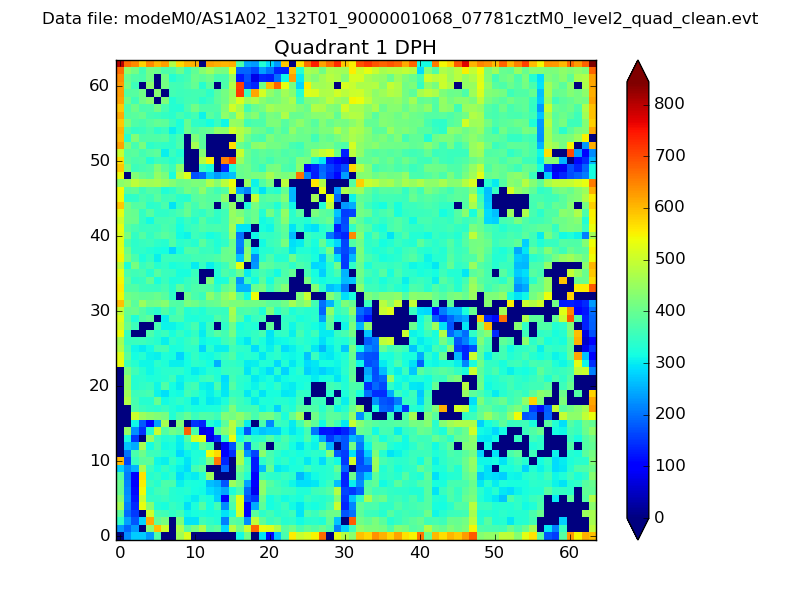 |
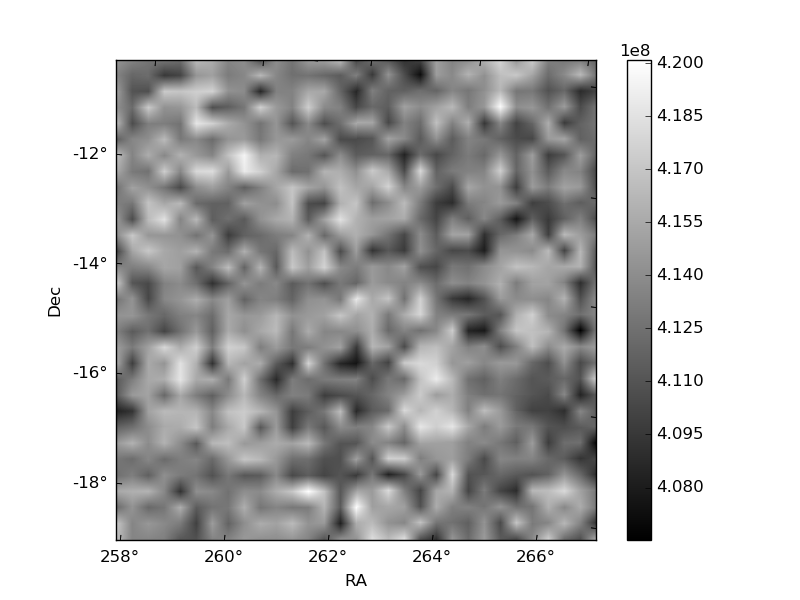
Quadrant B |
|---|---|---|---|
| Quadrant D | 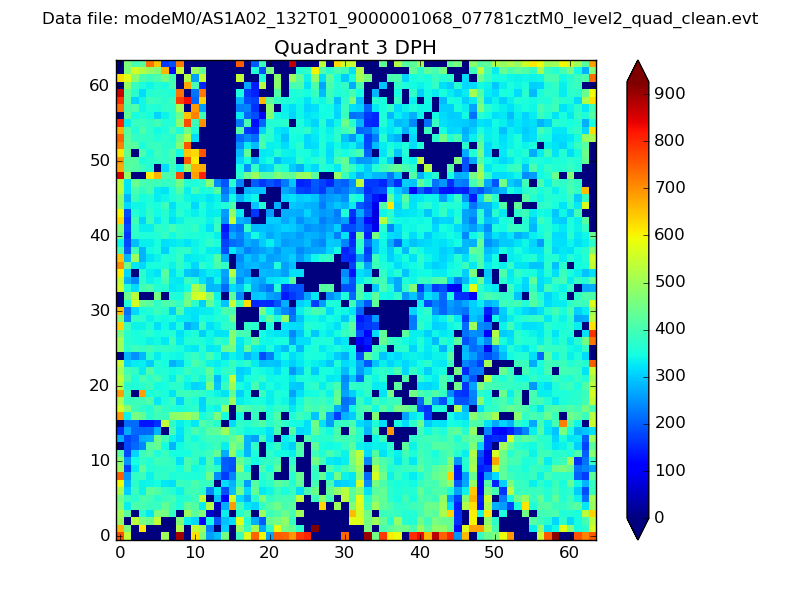 |
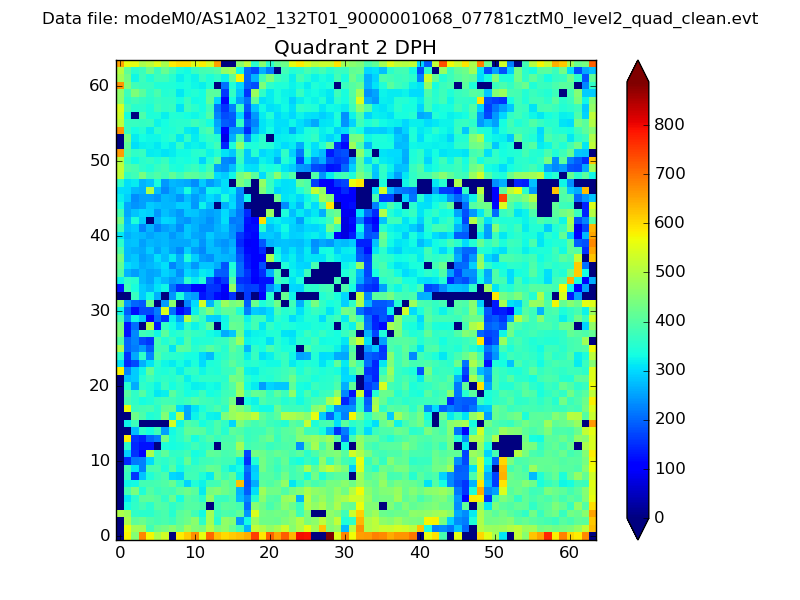 |
Quadrant C |
| Plot type | Count rate plots | Images |
|---|---|---|
| Comparison with Poisson distribution Blue bars denote a histogram of data divided into 1 sec bins. Red curve is a Poisson curve with rate = median count rate of data. |
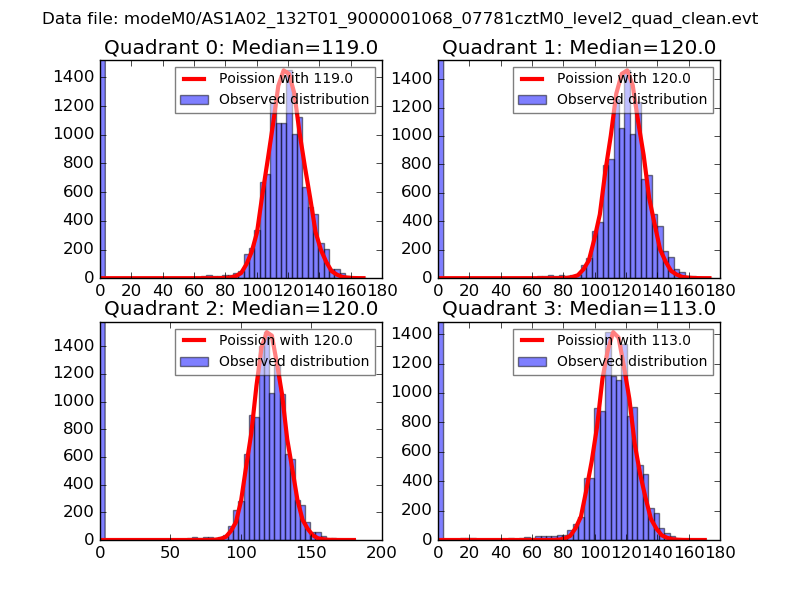 |
 |
| Quadrant-wise count rates Data is divided into 100 sec bins |
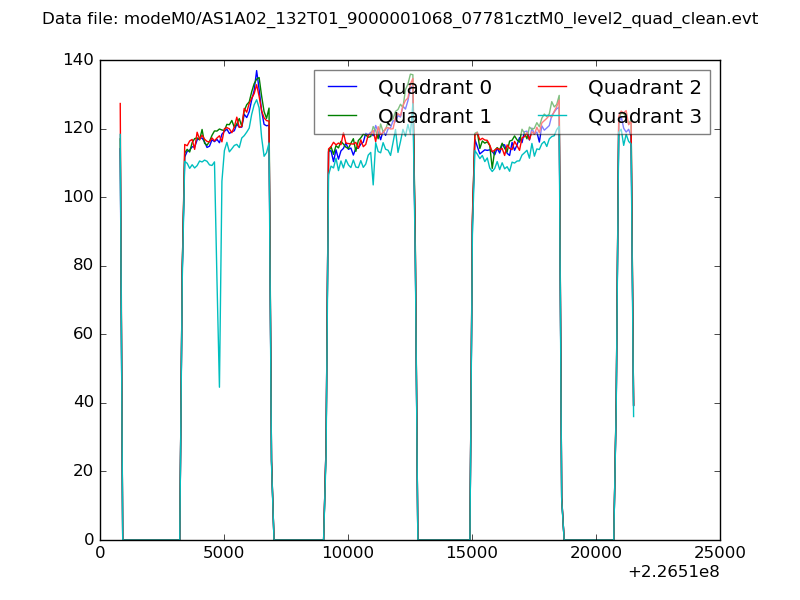 |
|
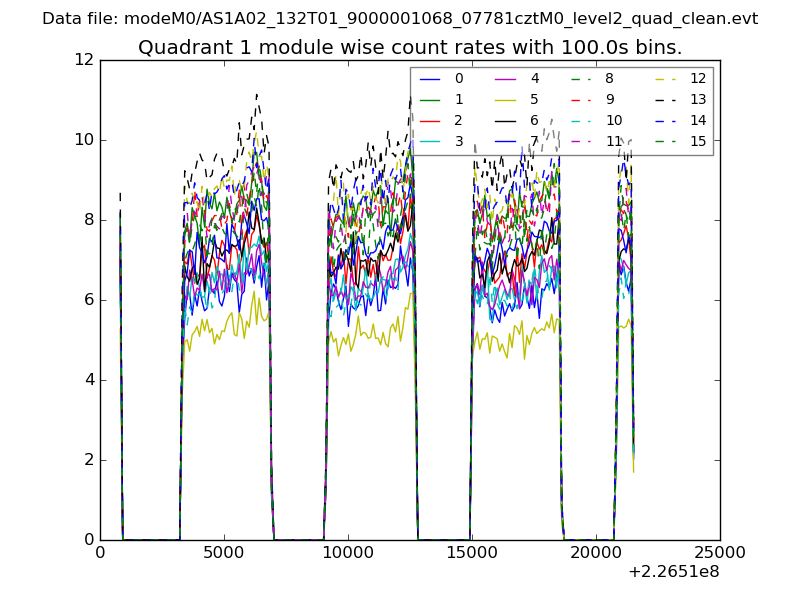
| Module-wise count rates for Quadrant A Data is divided into 100 sec bins |
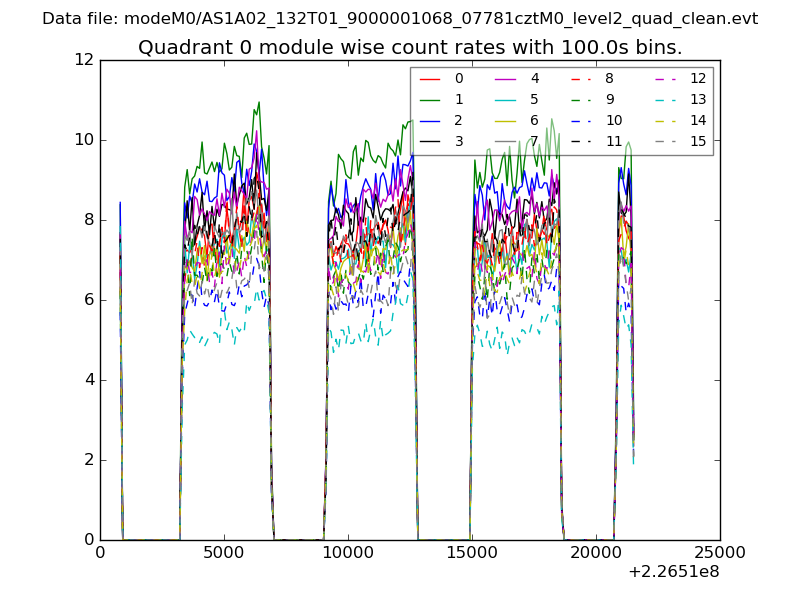 |
 |
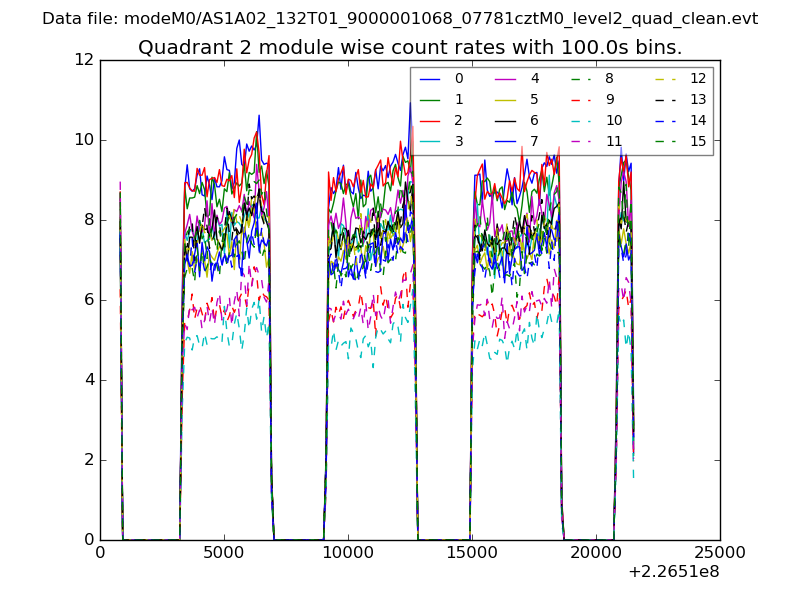
| Module-wise count rates for Quadrant B Data is divided into 100 sec bins |
 |
 |
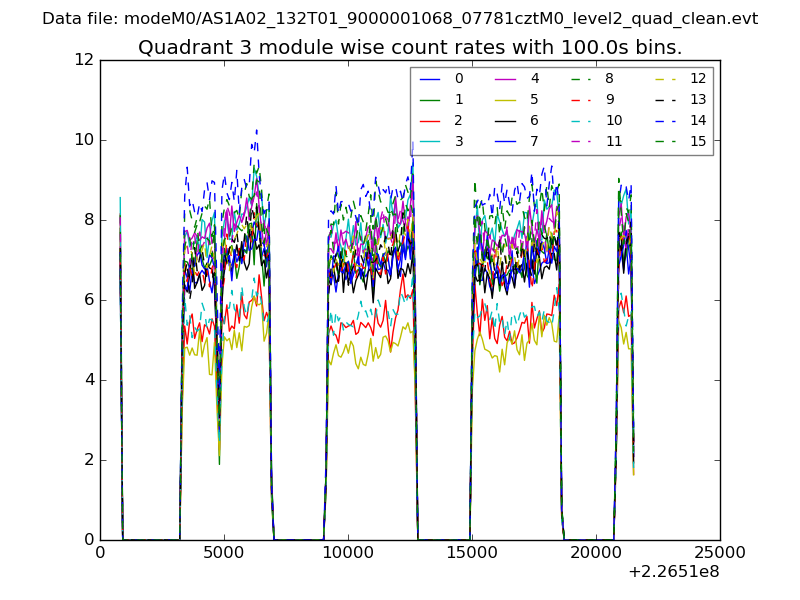
| Module-wise count rates for Quadrant C Data is divided into 100 sec bins |
 |
 |
| Module-wise count rates for Quadrant D Data is divided into 100 sec bins |
 |
 |
| Parameter | Plot |
|---|---|
| CZT HV Monitor | 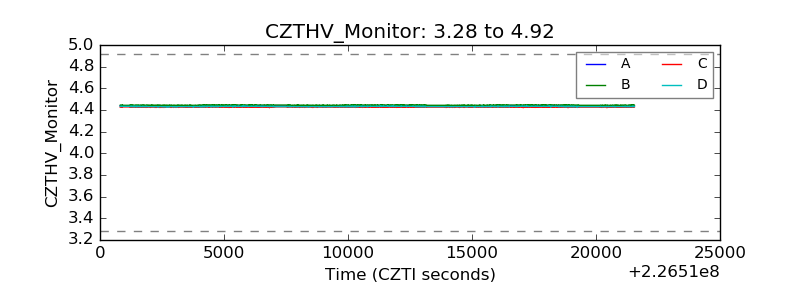 |
| D_VDD | 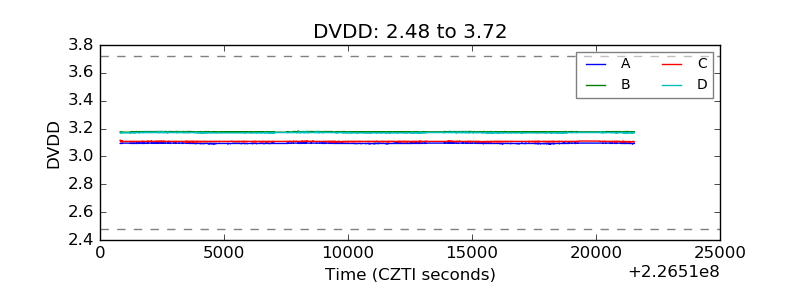 |
| Temperature 1 |  |
| Veto HV Monitor | 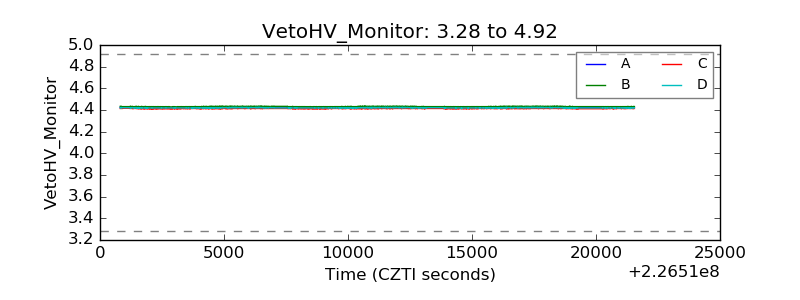 |
| Veto LLD | 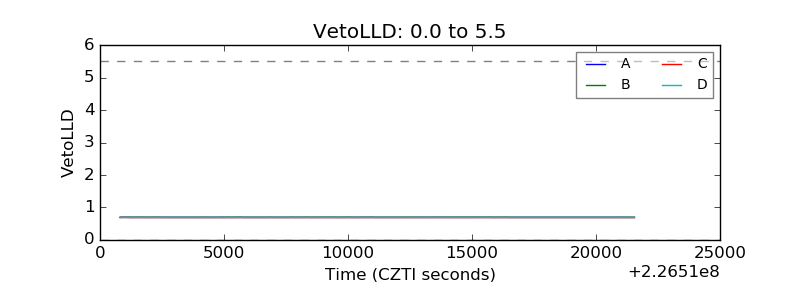 |
| Alpha Counter | 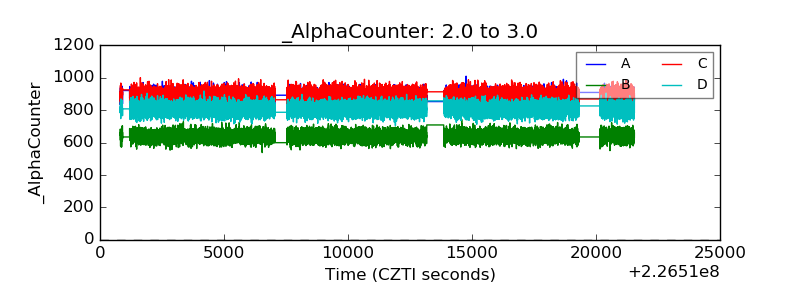 |
| _CPM_Rate | 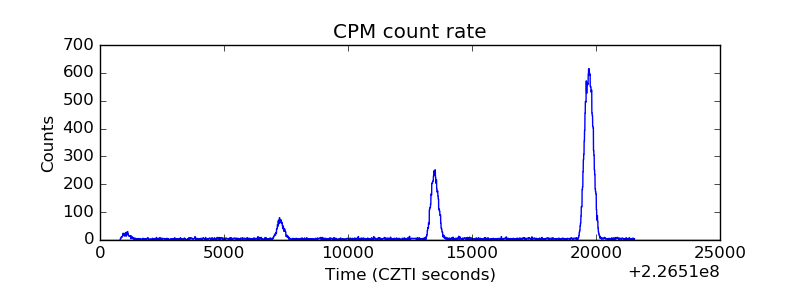 |
| CZT Counter | 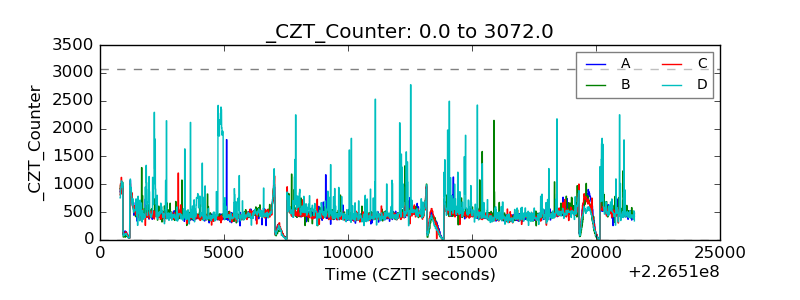 |
| +2.5 Volts monitor |  |
| +5 Volts monitor |  |
| _ROLL_ROT |  |
| _Roll_DEC |  |
| _Roll_RA | 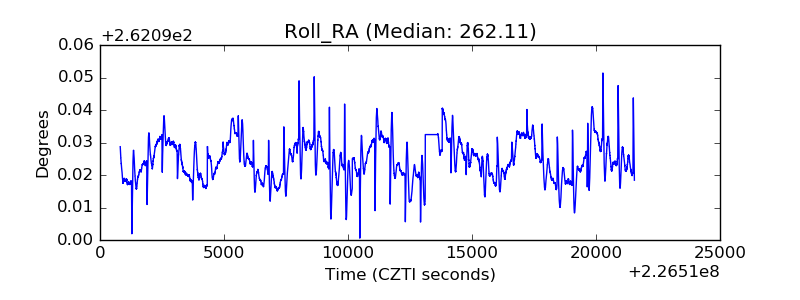 |
| Veto Counter | 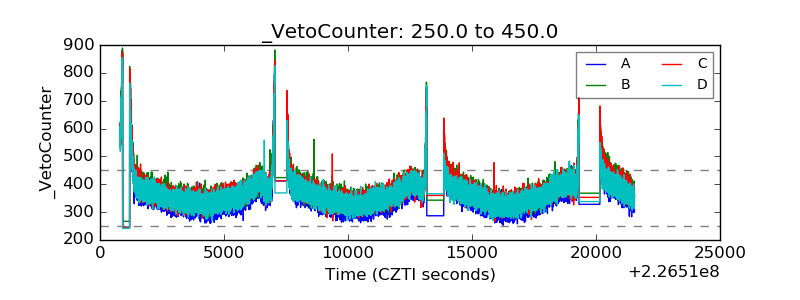 |