| Param | Original file | Final file |
|---|---|---|
| Filename | modeM0/AS1G06_169T01_9000001070cztM0_level2.fits | modeM0/AS1G06_169T01_9000001070cztM0_level2_quad_clean.evt |
| Size (bytes) | 226,546,560 | 171,950,400 |
| Size | 216.1 MB | 164.0 MB |
| Events in quadrant A | 1,384,398 | 934,389 |
| Events in quadrant B | 1,342,010 | 948,291 |
| Events in quadrant C | 1,351,168 | 890,709 |
| Events in quadrant D | 1,159,174 | 808,177 |
| Mode M9 | |||
|---|---|---|---|
| Quadrant | BADHDUFLAG | Total packets | Discarded packets |
| A | 0 | 51 | 0 |
| B | 0 | 51 | 0 |
| C | 0 | 51 | 0 |
| D | 0 | 51 | 0 |
| Mode SS | |||
|---|---|---|---|
| Quadrant | BADHDUFLAG | Total packets | Discarded packets |
| A | 0 | 478 | 0 |
| B | 0 | 478 | 0 |
| C | 0 | 478 | 0 |
| D | 0 | 478 | 0 |
| Mode M0 | |||
|---|---|---|---|
| Quadrant | BADHDUFLAG | Total packets | Discarded packets |
| A | 0 | 48030 | 0 |
| B | 0 | 49171 | 0 |
| C | 0 | 48105 | 0 |
| D | 0 | 54442 | 0 |
| Quadrant | Total seconds | Saturated seconds | Saturation percentage |
|---|---|---|---|
| A | 23621 | 74 | 0.313281% |
| B | 23621 | 107 | 0.452987% |
| C | 23621 | 38 | 0.160874% |
| D | 23621 | 213 | 0.901740% |
Noise dominated data is calculated using 1-second bins in cleaned event files. If a bin has >2000 counts, and if more than 50% of those come from <1% of pixels, then it is considered to be noise-dominated and hence unusable.
| Quadrant | # 1 sec bins | Bins with >0 counts | Bins with >2000 counts | High rate bins dominated by noise | Noise dominated (total time) | Noise dominated (detector-on time) | Marked lightcurve |
|---|---|---|---|---|---|---|---|
| A | 28621 | 23620 | 0 | 0 | 0.00% | 0.00% |  |
| B | 28621 | 23620 | 0 | 0 | 0.00% | 0.00% | 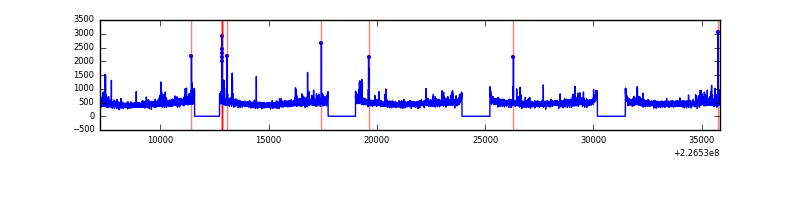 |
| C | 28621 | 23619 | 0 | 0 | 0.00% | 0.00% | 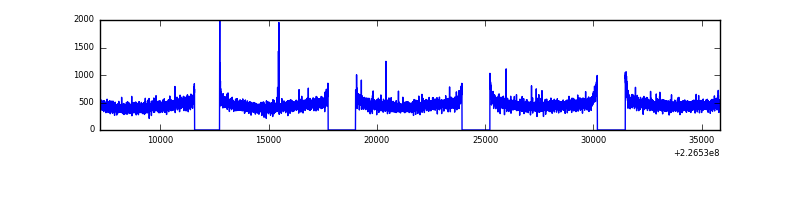 |
| D | 28621 | 23619 | 0 | 0 | 0.00% | 0.00% |  |
Top three noisy pixels from each quadrant. If the there are fewer than three noisy pixels in the level2.evt file, extra rows are filled as -1
| Pixel properties | Quadrant properties | ||||||
|---|---|---|---|---|---|---|---|
| Quadrant | DetID | PixID | Counts | Sigma | Mean | Median | Sigma |
| A | 0 | 29 | 1369 | 11.29 | 359 | 337 | 91.4 |
| A | 7 | 110 | 1142 | 8.8 | 359 | 337 | 91.4 |
| A | 9 | 19 | 1043 | 7.72 | 359 | 337 | 91.4 |
| B | 2 | 9 | 1145 | 11.15 | 354 | 338 | 72.4 |
| B | 5 | 128 | 914 | 7.96 | 354 | 338 | 72.4 |
| B | 3 | 17 | 909 | 7.89 | 354 | 338 | 72.4 |
| C | 1 | 80 | 1014 | 7.22 | 356 | 332 | 94.5 |
| C | 1 | 81 | 1003 | 7.1 | 356 | 332 | 94.5 |
| C | 12 | 241 | 936 | 6.39 | 356 | 332 | 94.5 |
| D | 6 | 231 | 890 | 6.62 | 330 | 301 | 89.0 |
| D | 3 | 14 | 875 | 6.45 | 330 | 301 | 89.0 |
| D | 7 | 5 | 845 | 6.11 | 330 | 301 | 89.0 |
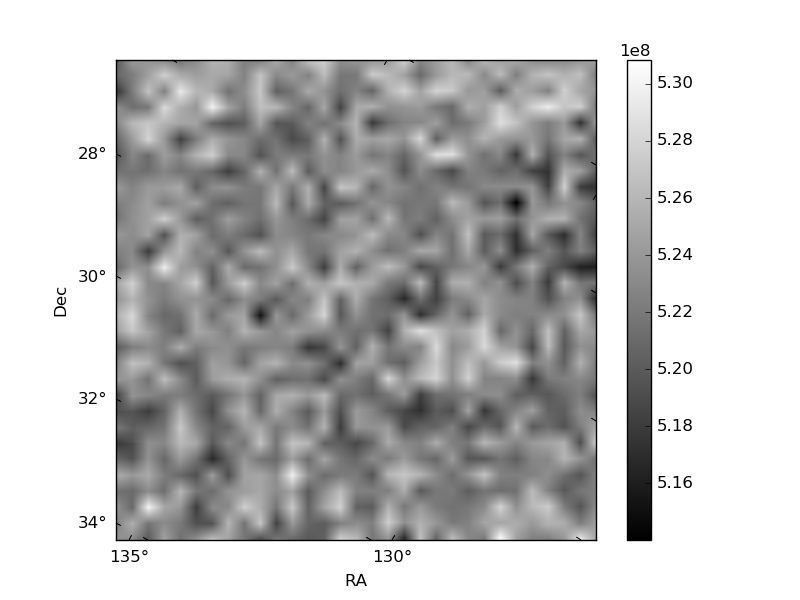
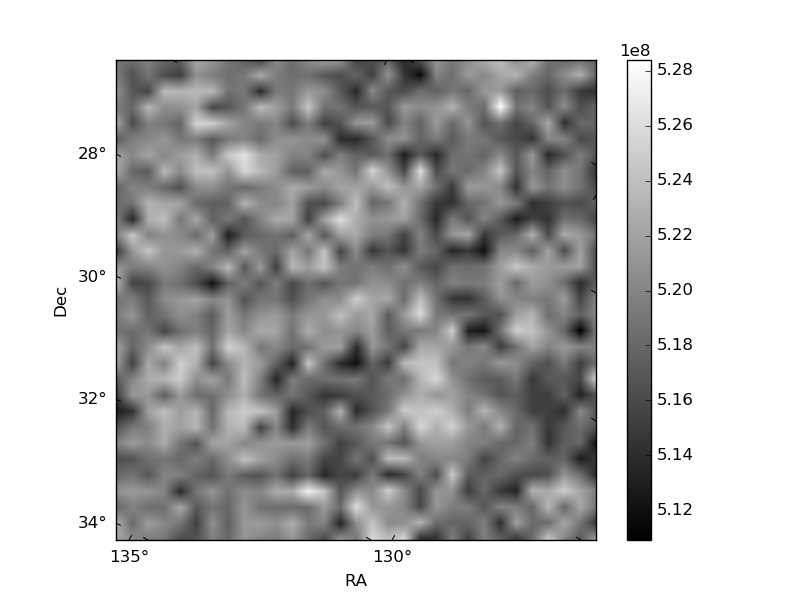
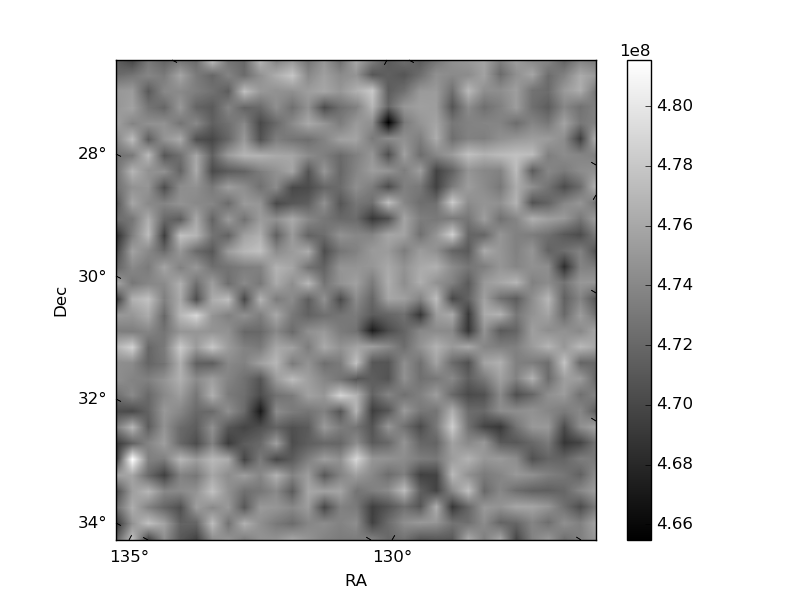
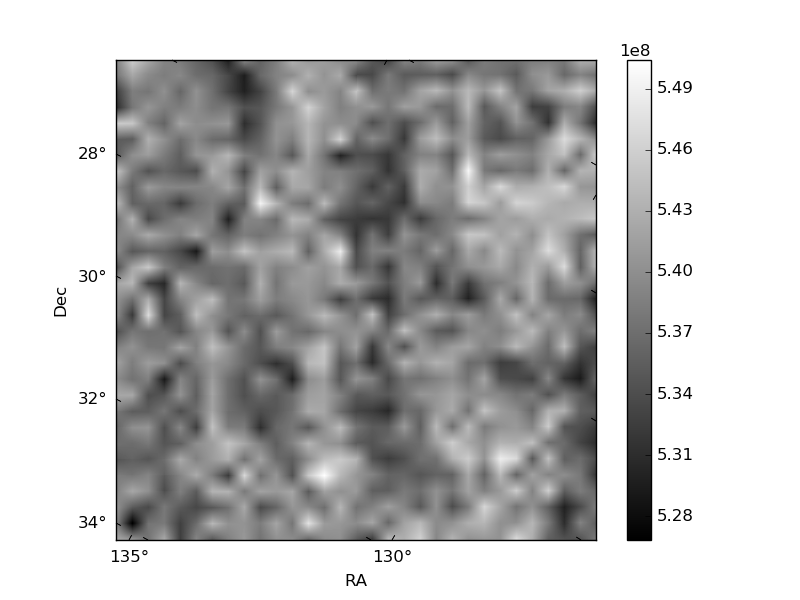
Histogram calculated using DETX and DETY for each event in the final _common_clean file
| Quadrant A |  |
 |
Quadrant B |
|---|---|---|---|
| Quadrant D |  |
 |
Quadrant C |
| Plot type | Count rate plots | Images |
|---|---|---|
| Comparison with Poisson distribution Blue bars denote a histogram of data divided into 1 sec bins. Red curve is a Poisson curve with rate = median count rate of data. |
 |
 |
| Quadrant-wise count rates Data is divided into 100 sec bins |
 |
|
| Module-wise count rates for Quadrant A Data is divided into 100 sec bins |
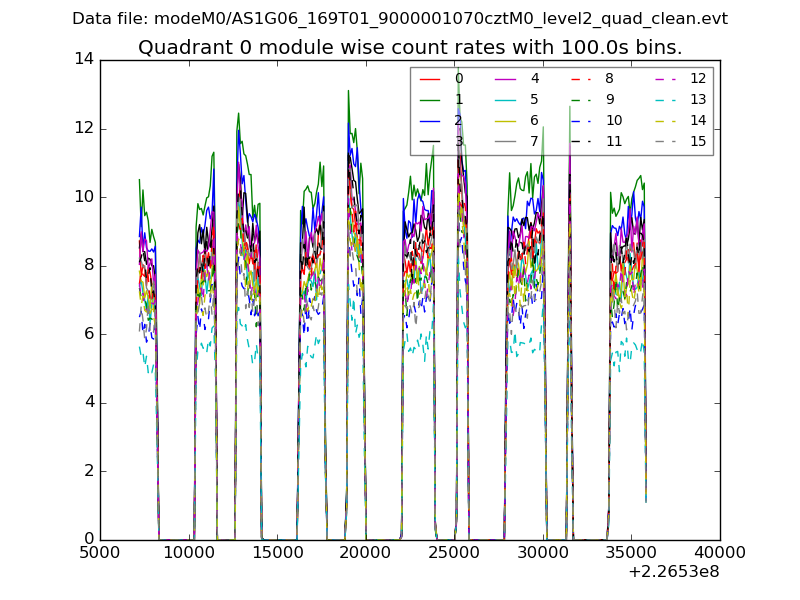 |
 |
| Module-wise count rates for Quadrant B Data is divided into 100 sec bins |
 |
 |
| Module-wise count rates for Quadrant C Data is divided into 100 sec bins |
 |
 |
| Module-wise count rates for Quadrant D Data is divided into 100 sec bins |
 |
 |
| Parameter | Plot |
|---|---|
| CZT HV Monitor |  |
| D_VDD | 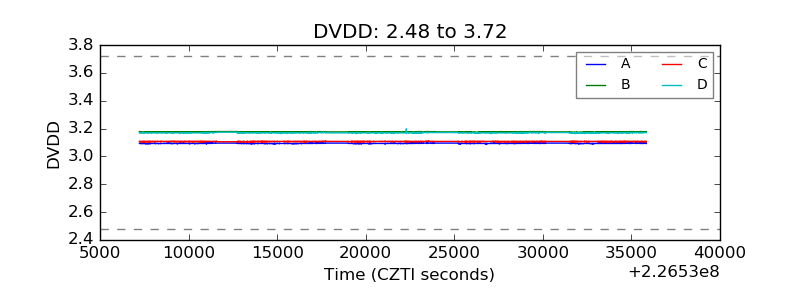 |
| Temperature 1 | 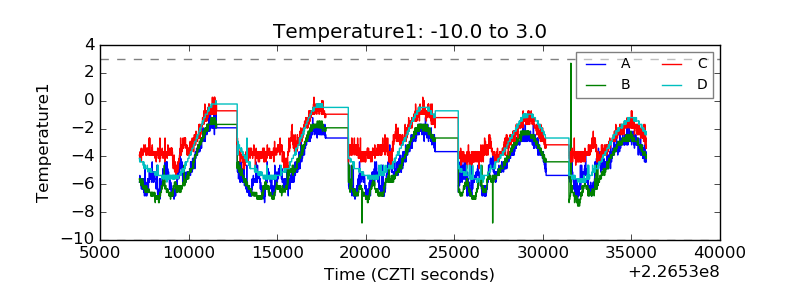 |
| Veto HV Monitor |  |
| Veto LLD |  |
| Alpha Counter |  |
| _CPM_Rate |  |
| CZT Counter | 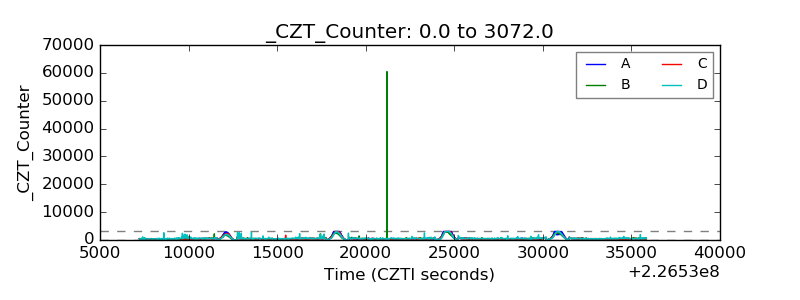 |
| +2.5 Volts monitor |  |
| +5 Volts monitor | 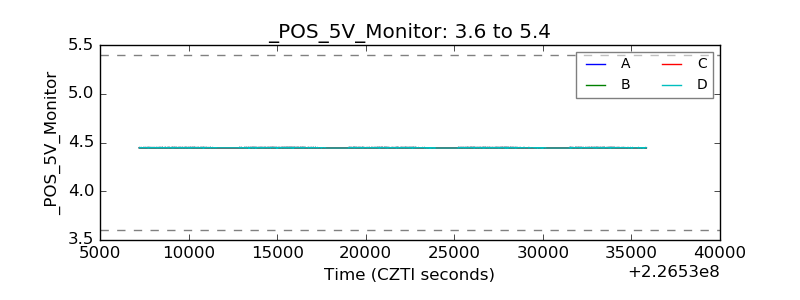 |
| _ROLL_ROT |  |
| _Roll_DEC |  |
| _Roll_RA | 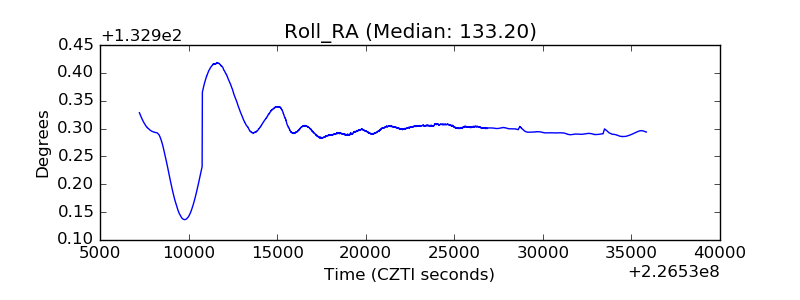 |
| Veto Counter |  |