| Param | Original file | Final file |
|---|---|---|
| Filename | modeM0/AS1G06_169T01_9000001070_07784cztM0_level2.evt | modeM0/AS1G06_169T01_9000001070_07784cztM0_level2_quad_clean.evt |
| Size (bytes) | 372,202,560 | 70,986,240 |
| Size | 355.0 MB | 67.7 MB |
| Events in quadrant A | 2,490,853 | 442,463 |
| Events in quadrant B | 2,656,751 | 451,173 |
| Events in quadrant C | 2,480,108 | 441,674 |
| Events in quadrant D | 3,262,756 | 422,031 |
| Mode M9 | |||
|---|---|---|---|
| Quadrant | BADHDUFLAG | Total packets | Discarded packets |
| A | 0 | 12 | 0 |
| B | 0 | 12 | 0 |
| C | 0 | 12 | 0 |
| D | 0 | 12 | 0 |
| Mode SS | |||
|---|---|---|---|
| Quadrant | BADHDUFLAG | Total packets | Discarded packets |
| A | 0 | 112 | 0 |
| B | 0 | 112 | 0 |
| C | 0 | 112 | 0 |
| D | 0 | 112 | 0 |
| Mode M0 | |||
|---|---|---|---|
| Quadrant | BADHDUFLAG | Total packets | Discarded packets |
| A | 0 | 11388 | 2 |
| B | 0 | 11723 | 1 |
| C | 0 | 11372 | 1 |
| D | 0 | 13607 | 1 |
| Quadrant | Total seconds | Saturated seconds | Saturation percentage |
|---|---|---|---|
| A | 5614 | 7 | 0.124688% |
| B | 5614 | 18 | 0.320627% |
| C | 5614 | 5 | 0.089063% |
| D | 5614 | 80 | 1.425009% |
Noise dominated data is calculated using 1-second bins in cleaned event files. If a bin has >2000 counts, and if more than 50% of those come from <1% of pixels, then it is considered to be noise-dominated and hence unusable.
| Quadrant | # 1 sec bins | Bins with >0 counts | Bins with >2000 counts | High rate bins dominated by noise | Noise dominated (total time) | Noise dominated (detector-on time) | Marked lightcurve |
|---|---|---|---|---|---|---|---|
| A | 6769 | 5615 | 1 | 1 | 0.01% | 0.02% | 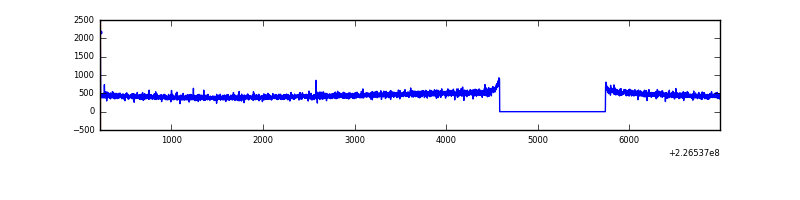 |
| B | 6769 | 5615 | 7 | 7 | 0.10% | 0.12% | 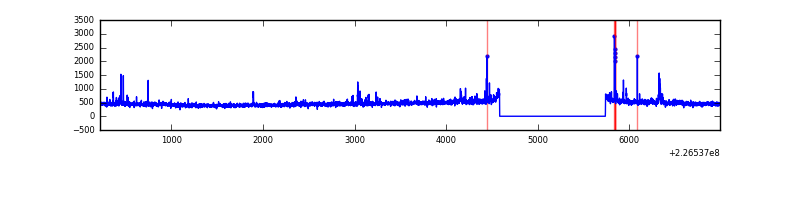 |
| C | 6769 | 5615 | 0 | 0 | 0.00% | 0.00% | 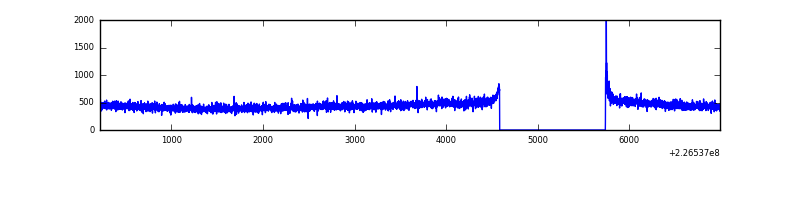 |
| D | 6769 | 5615 | 71 | 71 | 1.05% | 1.26% | 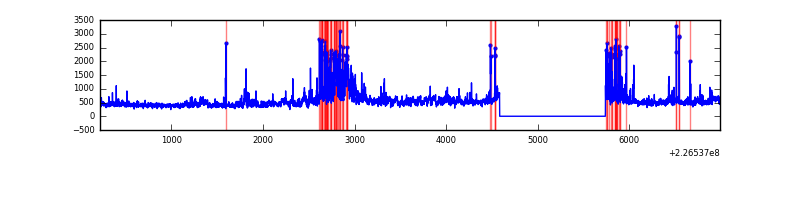 |
Top three noisy pixels from each quadrant. If the there are fewer than three noisy pixels in the level2.evt file, extra rows are filled as -1
| Pixel properties | Quadrant properties | ||||||
|---|---|---|---|---|---|---|---|
| Quadrant | DetID | PixID | Counts | Sigma | Mean | Median | Sigma |
| A | 0 | 226 | 6003 | 40.81 | 645 | 631 | 131.6 |
| A | 12 | 194 | 5542 | 37.3 | 645 | 631 | 131.6 |
| A | 15 | 234 | 3883 | 24.7 | 645 | 631 | 131.6 |
| B | 0 | 214 | 21964 | 171.55 | 652 | 638 | 124.3 |
| B | 0 | 213 | 21702 | 169.44 | 652 | 638 | 124.3 |
| B | 4 | 173 | 21409 | 167.09 | 652 | 638 | 124.3 |
| C | 12 | 4 | 11940 | 76.52 | 631 | 635 | 147.7 |
| C | 13 | 61 | 4857 | 28.58 | 631 | 635 | 147.7 |
| C | 8 | 222 | 2828 | 14.84 | 631 | 635 | 147.7 |
| D | 2 | 152 | 346536 | 2260.59 | 624 | 606 | 153.0 |
| D | 1 | 52 | 323776 | 2111.86 | 624 | 606 | 153.0 |
| D | 13 | 104 | 120309 | 782.24 | 624 | 606 | 153.0 |
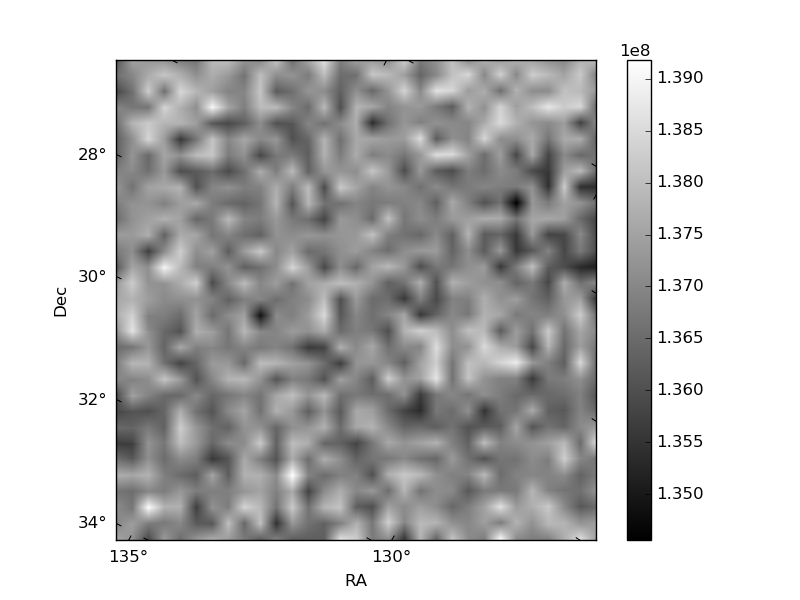
Histogram calculated using DETX and DETY for each event in the final _common_clean file
| Quadrant A | 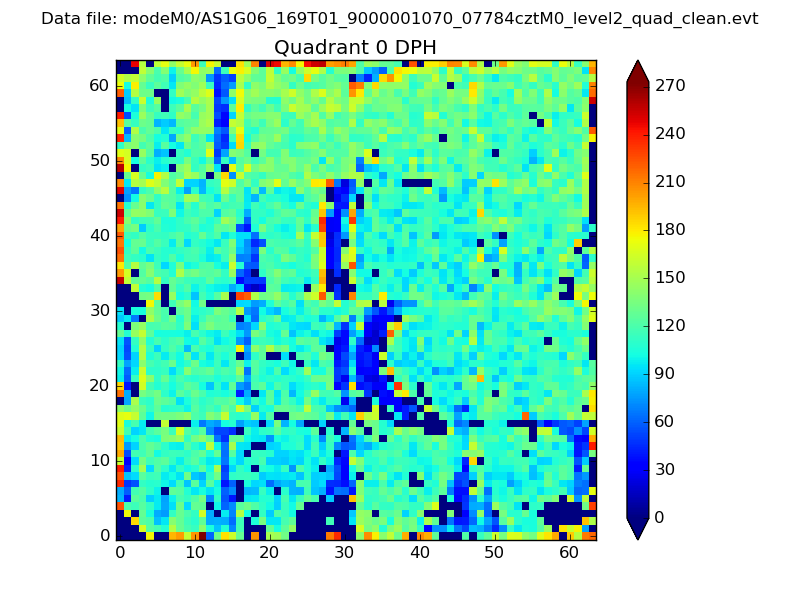 |
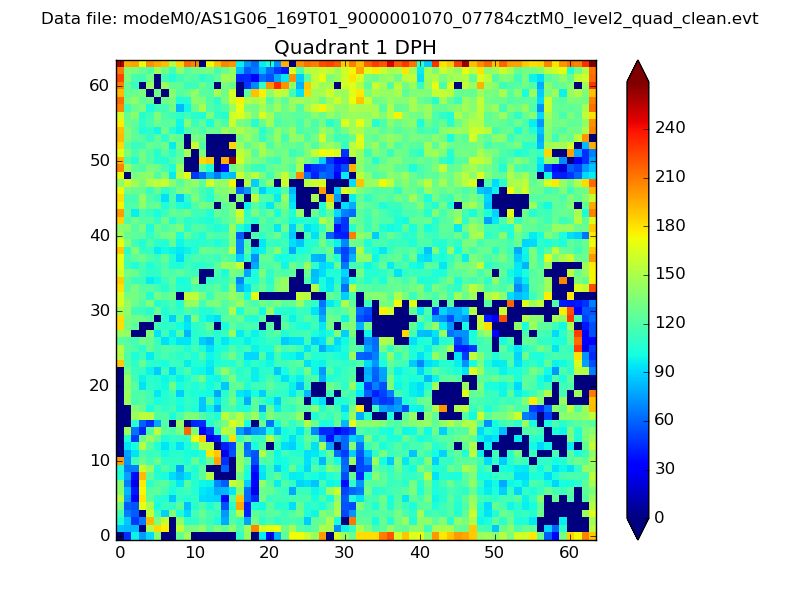 |
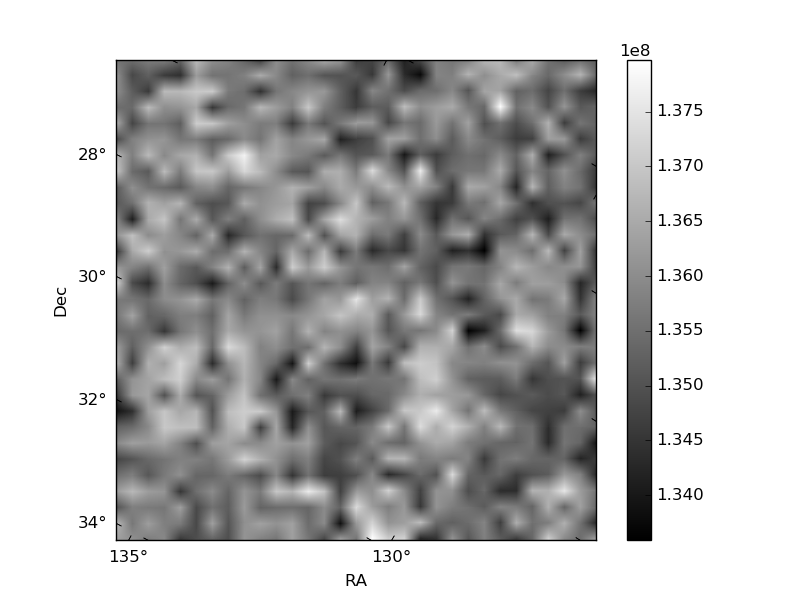
Quadrant B |
|---|---|---|---|
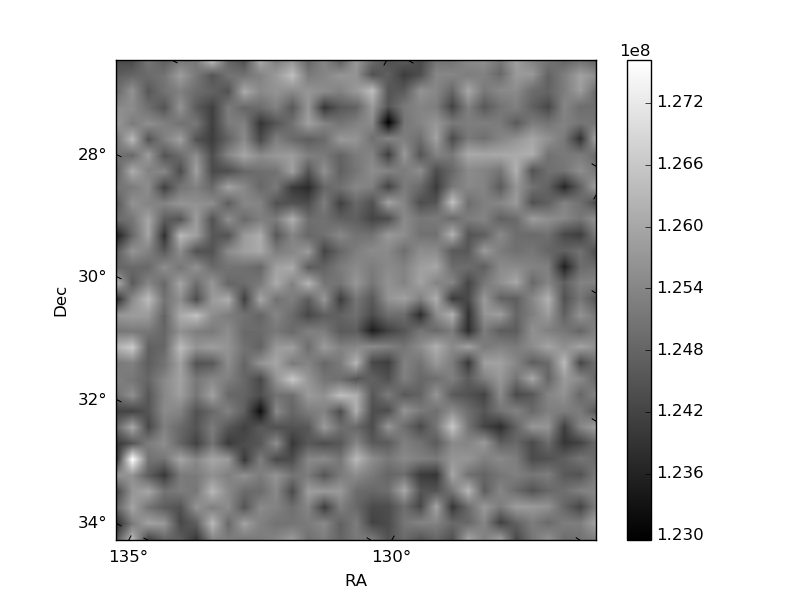
| Quadrant D | 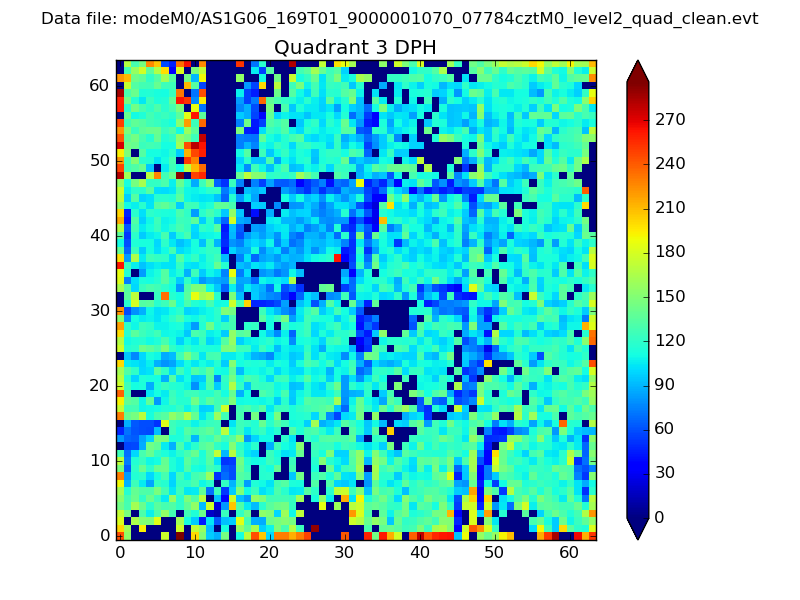 |
 |
Quadrant C |
| Plot type | Count rate plots | Images |
|---|---|---|
| Comparison with Poisson distribution Blue bars denote a histogram of data divided into 1 sec bins. Red curve is a Poisson curve with rate = median count rate of data. |
 |
 |
| Quadrant-wise count rates Data is divided into 100 sec bins |
 |
|
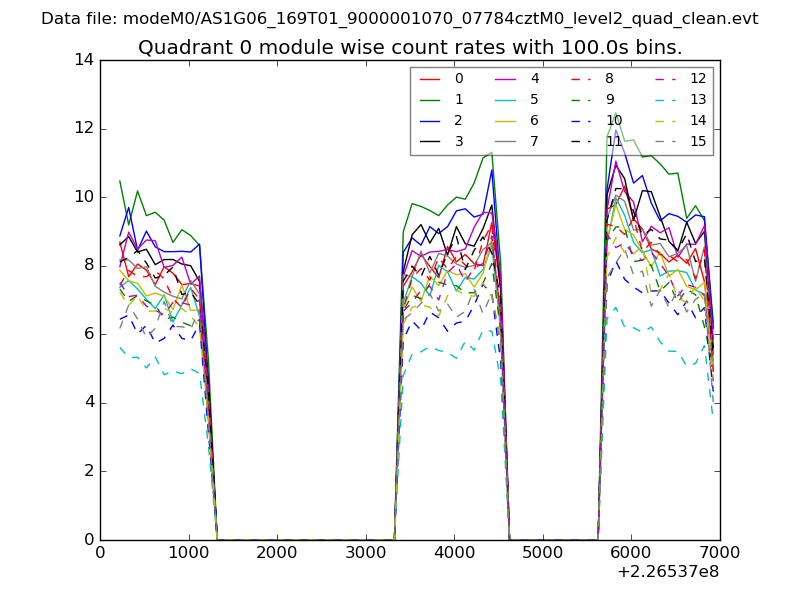
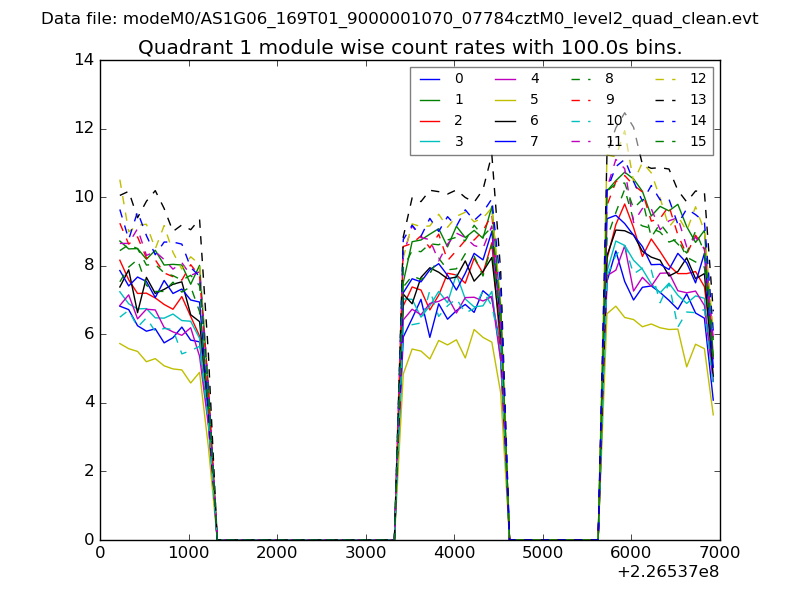
| Module-wise count rates for Quadrant A Data is divided into 100 sec bins |
 |
 |
| Module-wise count rates for Quadrant B Data is divided into 100 sec bins |
 |
 |
| Module-wise count rates for Quadrant C Data is divided into 100 sec bins |
 |
 |
| Module-wise count rates for Quadrant D Data is divided into 100 sec bins |
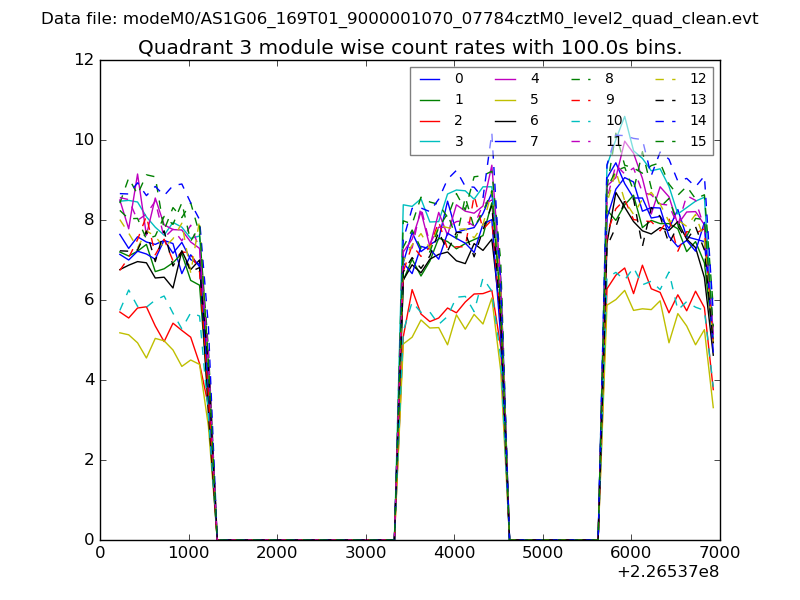 |
 |
| Parameter | Plot |
|---|---|
| CZT HV Monitor | 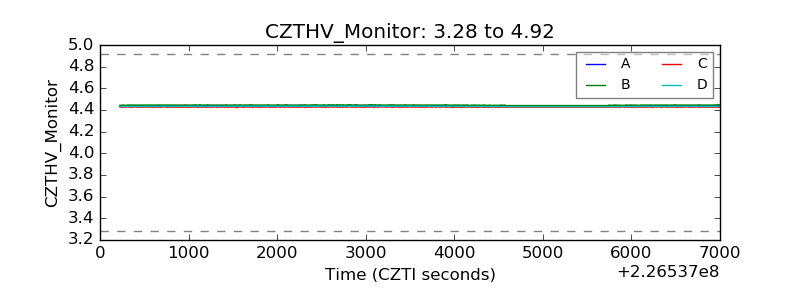 |
| D_VDD | 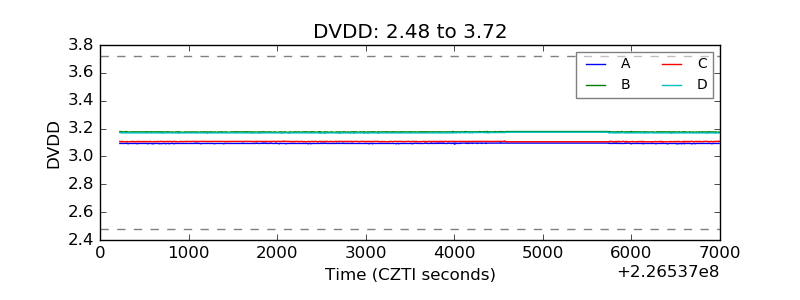 |
| Temperature 1 | 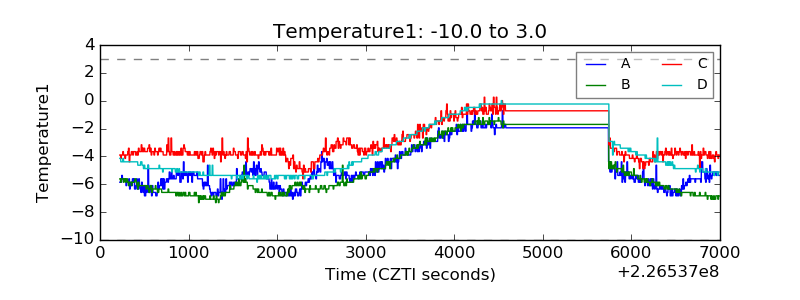 |
| Veto HV Monitor | 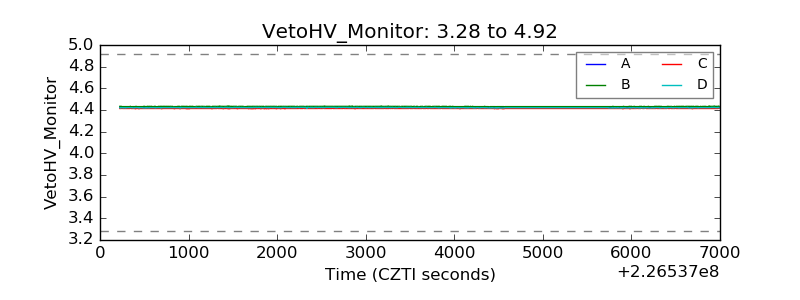 |
| Veto LLD |  |
| Alpha Counter | 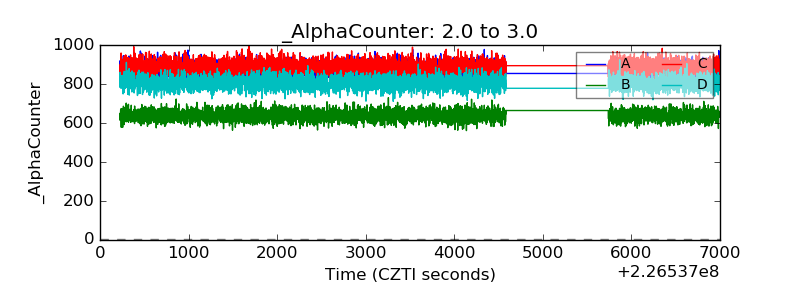 |
| _CPM_Rate | 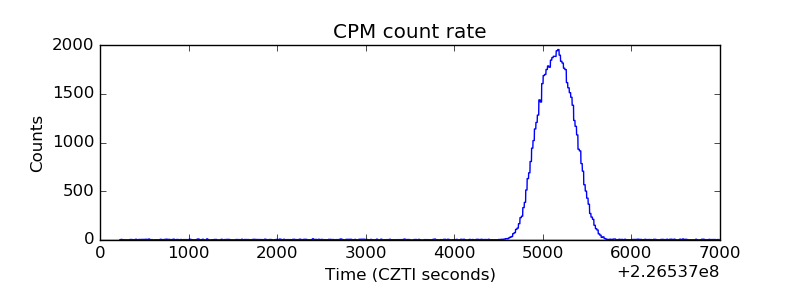 |
| CZT Counter |  |
| +2.5 Volts monitor |  |
| +5 Volts monitor |  |
| _ROLL_ROT | 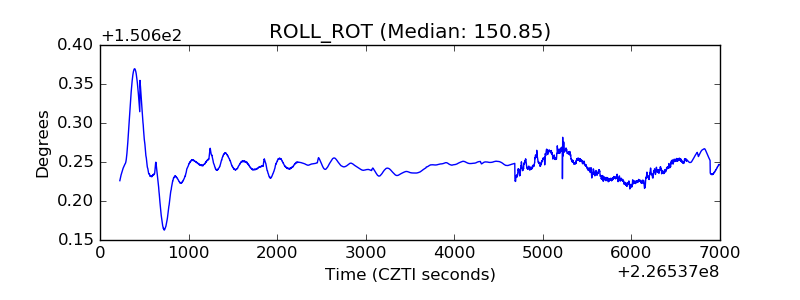 |
| _Roll_DEC | 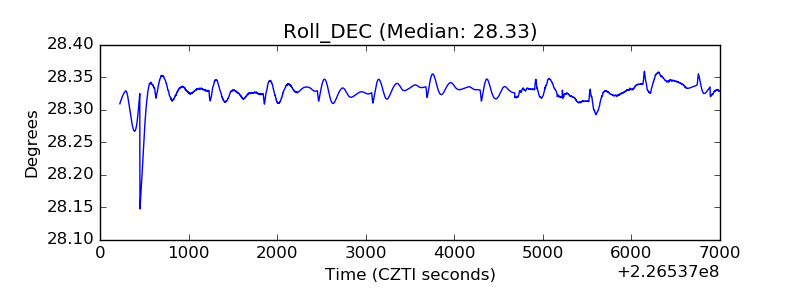 |
| _Roll_RA | 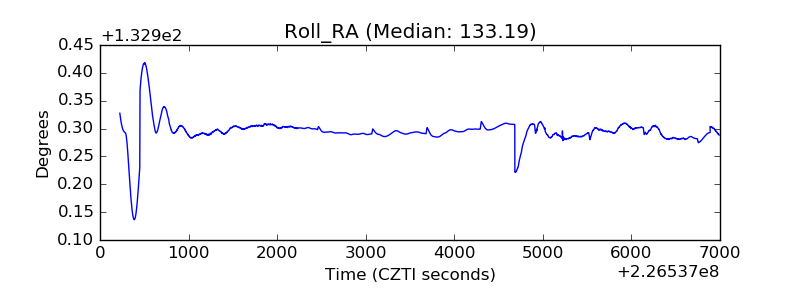 |
| Veto Counter | 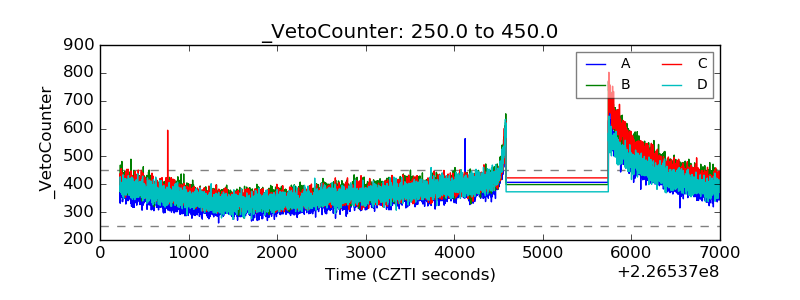 |