| Param | Original file | Final file |
|---|---|---|
| Filename | modeM0/AS1G06_169T01_9000001070_07785cztM0_level2.evt | modeM0/AS1G06_169T01_9000001070_07785cztM0_level2_quad_clean.evt |
| Size (bytes) | 445,331,520 | 86,941,440 |
| Size | 424.7 MB | 82.9 MB |
| Events in quadrant A | 3,017,219 | 552,086 |
| Events in quadrant B | 3,238,534 | 564,589 |
| Events in quadrant C | 3,026,138 | 546,658 |
| Events in quadrant D | 3,762,746 | 515,752 |
| Mode M9 | |||
|---|---|---|---|
| Quadrant | BADHDUFLAG | Total packets | Discarded packets |
| A | 0 | 25 | 0 |
| B | 0 | 25 | 0 |
| C | 0 | 25 | 0 |
| D | 0 | 25 | 0 |
| Mode SS | |||
|---|---|---|---|
| Quadrant | BADHDUFLAG | Total packets | Discarded packets |
| A | 0 | 132 | 0 |
| B | 0 | 132 | 0 |
| C | 0 | 132 | 0 |
| D | 0 | 132 | 0 |
| Mode M0 | |||
|---|---|---|---|
| Quadrant | BADHDUFLAG | Total packets | Discarded packets |
| A | 0 | 13286 | 3 |
| B | 0 | 13851 | 2 |
| C | 0 | 13362 | 2 |
| D | 0 | 15300 | 2 |
| Quadrant | Total seconds | Saturated seconds | Saturation percentage |
|---|---|---|---|
| A | 6514 | 9 | 0.138164% |
| B | 6514 | 24 | 0.368437% |
| C | 6514 | 9 | 0.138164% |
| D | 6514 | 95 | 1.458397% |
Noise dominated data is calculated using 1-second bins in cleaned event files. If a bin has >2000 counts, and if more than 50% of those come from <1% of pixels, then it is considered to be noise-dominated and hence unusable.
| Quadrant | # 1 sec bins | Bins with >0 counts | Bins with >2000 counts | High rate bins dominated by noise | Noise dominated (total time) | Noise dominated (detector-on time) | Marked lightcurve |
|---|---|---|---|---|---|---|---|
| A | 8934 | 6516 | 0 | 0 | 0.00% | 0.00% | 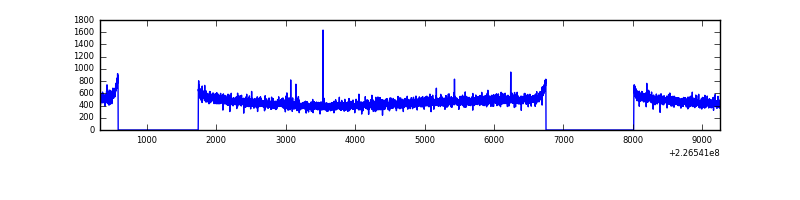 |
| B | 8934 | 6516 | 9 | 9 | 0.10% | 0.14% | 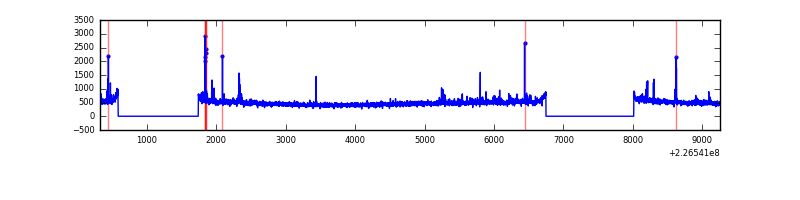 |
| C | 8934 | 6516 | 0 | 0 | 0.00% | 0.00% | 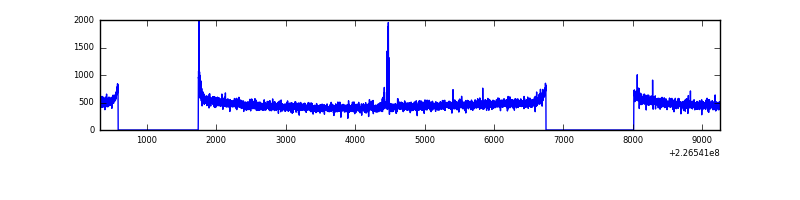 |
| D | 8934 | 6516 | 71 | 71 | 0.79% | 1.09% | 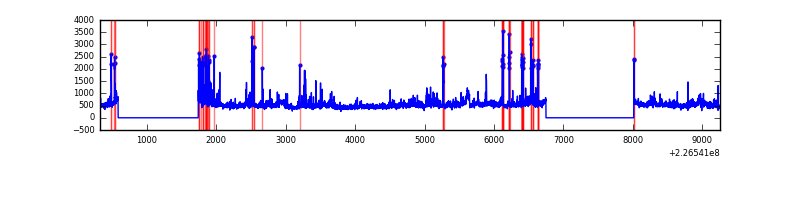 |
Top three noisy pixels from each quadrant. If the there are fewer than three noisy pixels in the level2.evt file, extra rows are filled as -1
| Pixel properties | Quadrant properties | ||||||
|---|---|---|---|---|---|---|---|
| Quadrant | DetID | PixID | Counts | Sigma | Mean | Median | Sigma |
| A | 0 | 226 | 7320 | 40.92 | 783 | 766 | 160.2 |
| A | 12 | 194 | 6643 | 36.7 | 783 | 766 | 160.2 |
| A | 13 | 254 | 3985 | 20.1 | 783 | 766 | 160.2 |
| B | 0 | 219 | 28179 | 182.87 | 793 | 775 | 149.9 |
| B | 4 | 173 | 27869 | 180.8 | 793 | 775 | 149.9 |
| B | 4 | 81 | 26091 | 168.94 | 793 | 775 | 149.9 |
| C | 12 | 16 | 26182 | 143.43 | 764 | 767 | 177.2 |
| C | 12 | 4 | 13866 | 73.92 | 764 | 767 | 177.2 |
| C | 1 | 16 | 6193 | 30.62 | 764 | 767 | 177.2 |
| D | 1 | 52 | 489677 | 2653.21 | 751 | 728 | 184.3 |
| D | 13 | 104 | 125603 | 677.61 | 751 | 728 | 184.3 |
| D | 1 | 239 | 66461 | 356.69 | 751 | 728 | 184.3 |
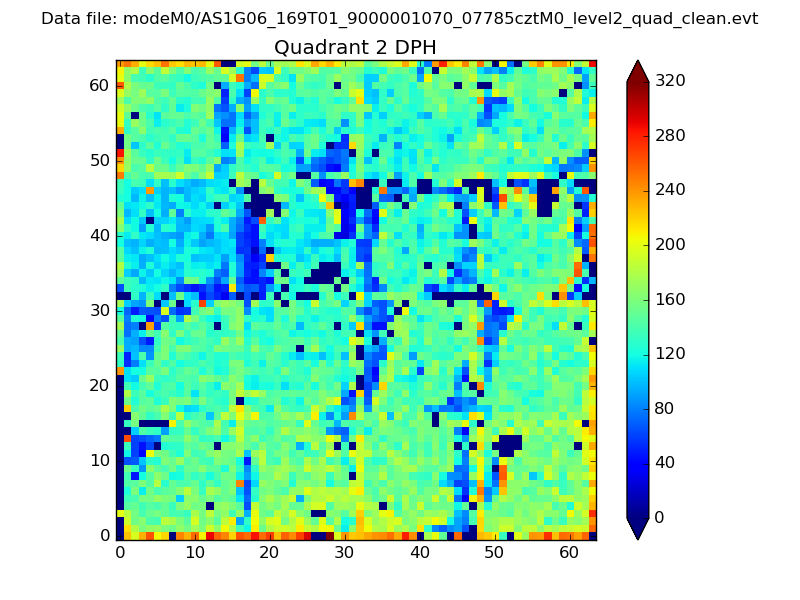
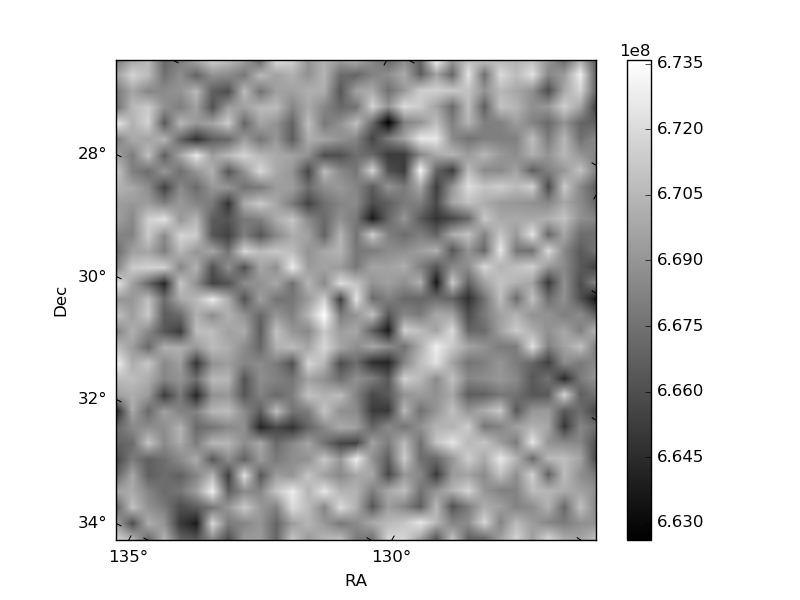
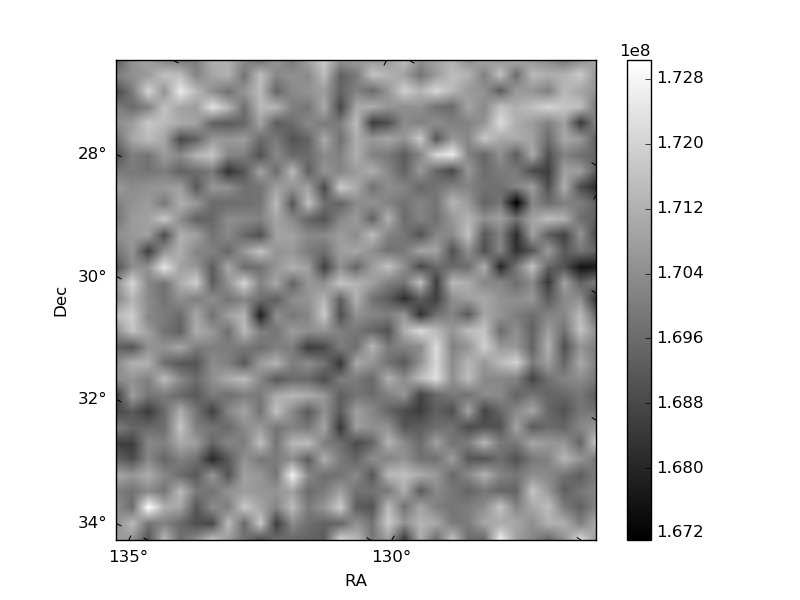
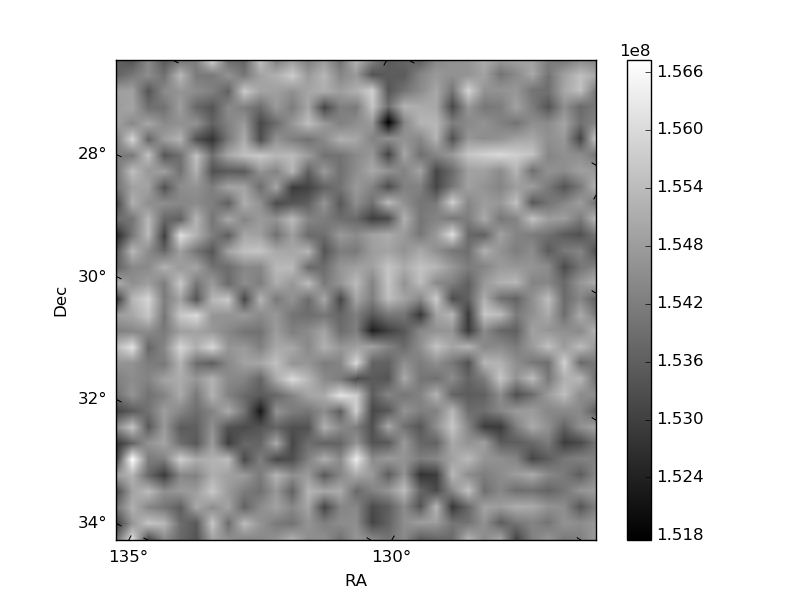
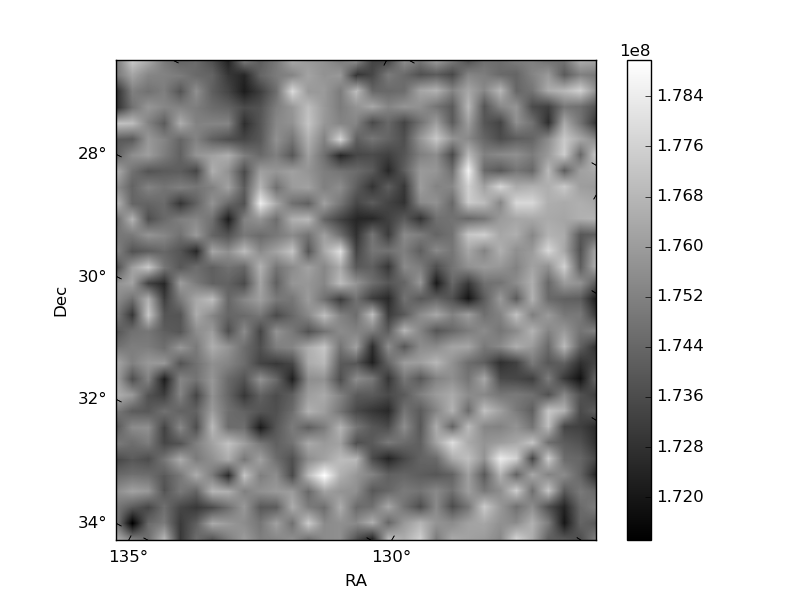
Histogram calculated using DETX and DETY for each event in the final _common_clean file
| Quadrant A | 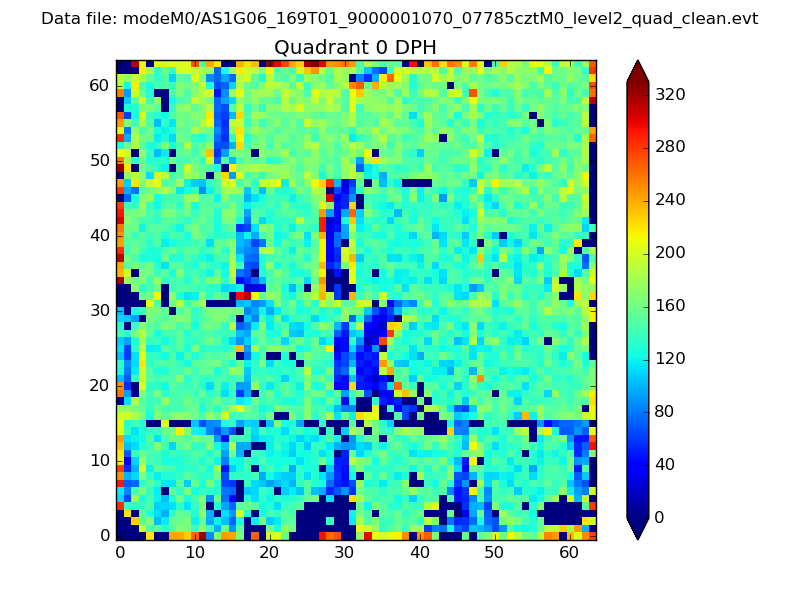 |
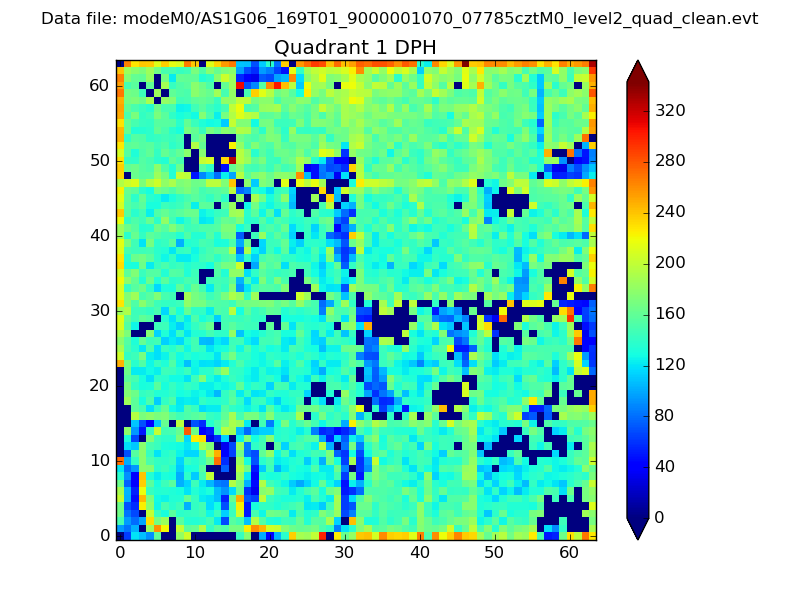 |
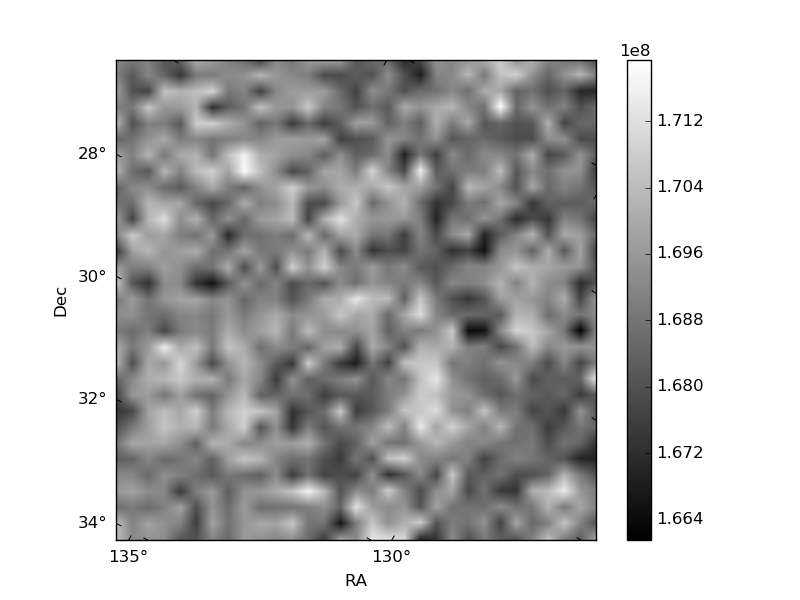
Quadrant B |
|---|---|---|---|
| Quadrant D | 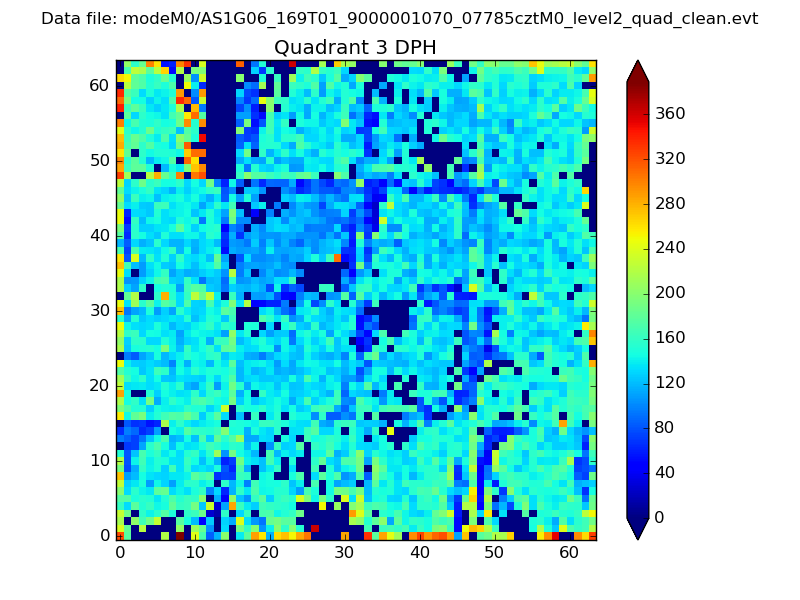 |
 |
Quadrant C |
| Plot type | Count rate plots | Images |
|---|---|---|
| Comparison with Poisson distribution Blue bars denote a histogram of data divided into 1 sec bins. Red curve is a Poisson curve with rate = median count rate of data. |
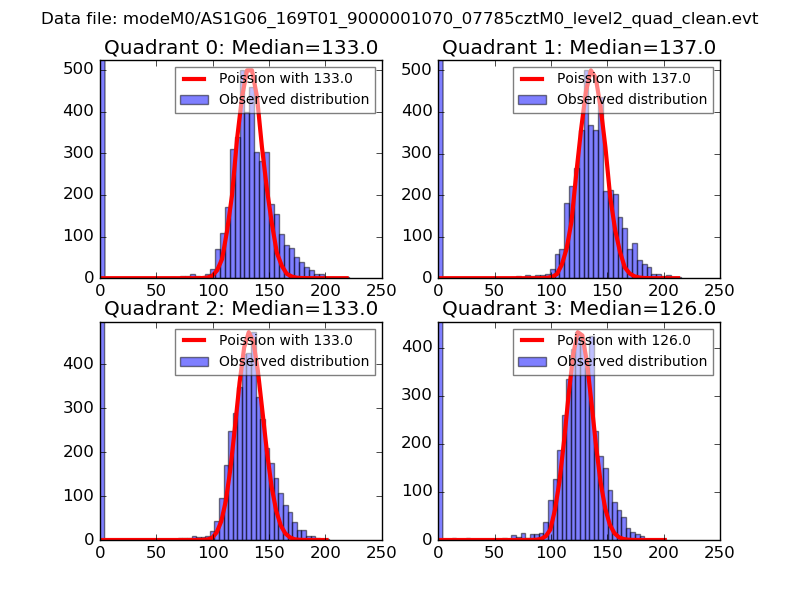 |
 |
| Quadrant-wise count rates Data is divided into 100 sec bins |
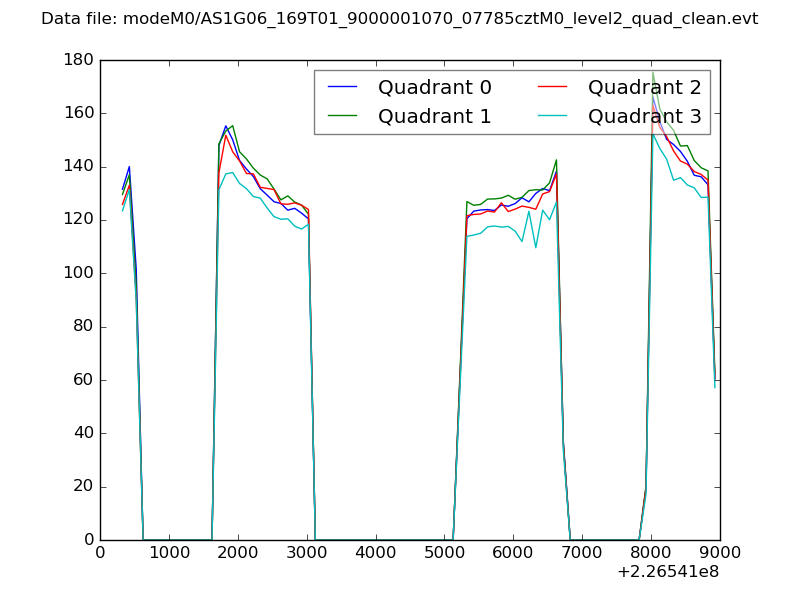 |
|
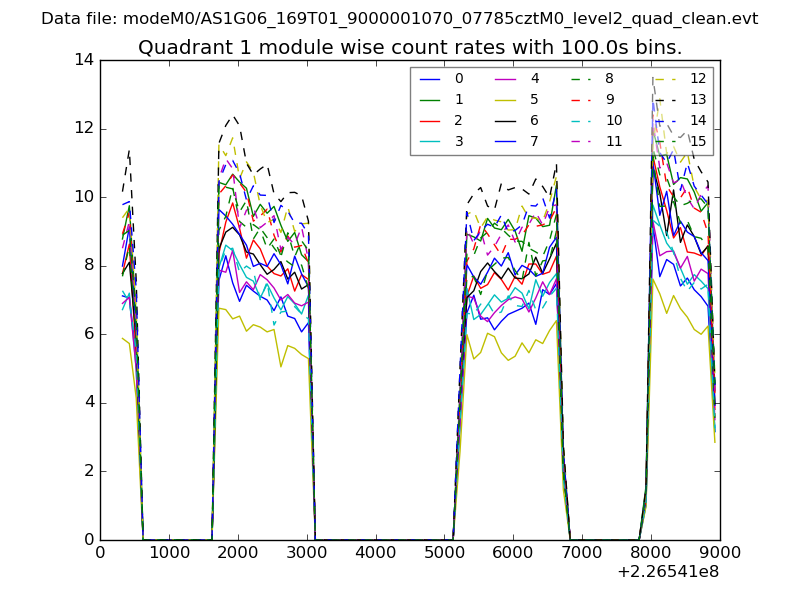
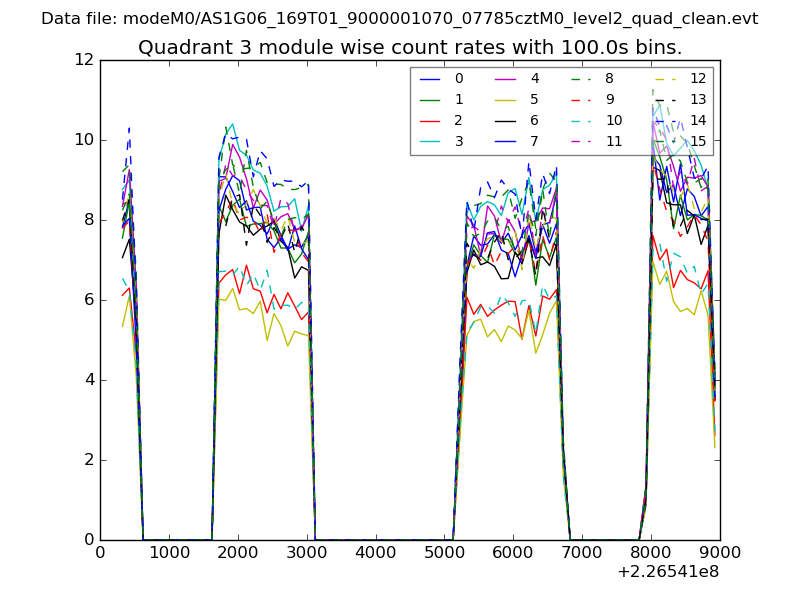
| Module-wise count rates for Quadrant A Data is divided into 100 sec bins |
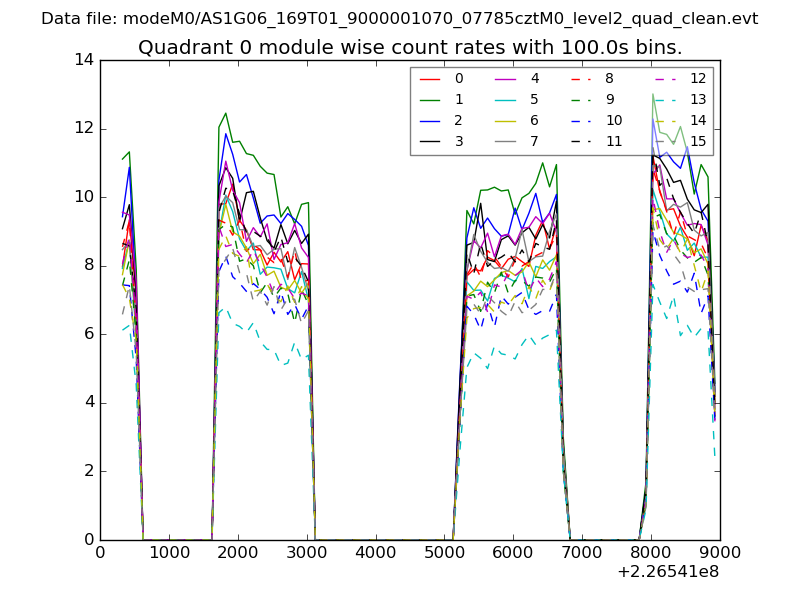 |
 |
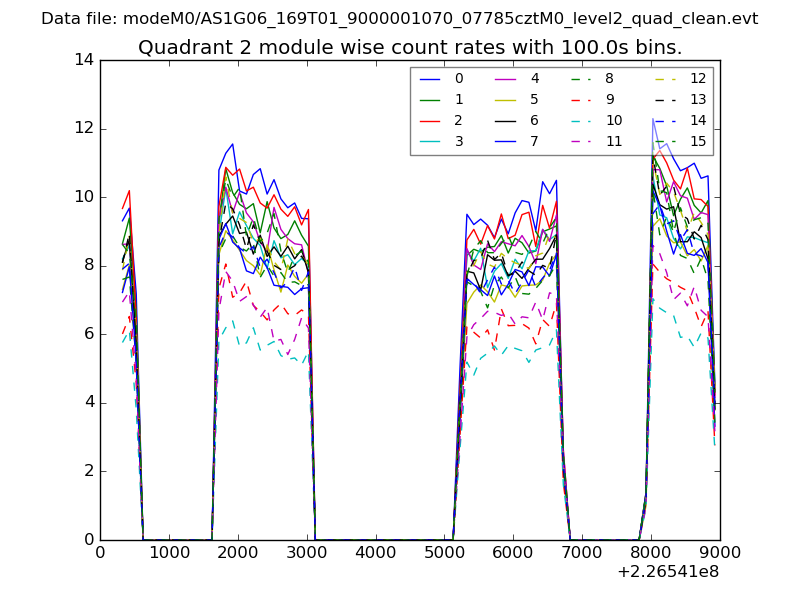
| Module-wise count rates for Quadrant B Data is divided into 100 sec bins |
 |
 |
| Module-wise count rates for Quadrant C Data is divided into 100 sec bins |
 |
 |
| Module-wise count rates for Quadrant D Data is divided into 100 sec bins |
 |
 |
| Parameter | Plot |
|---|---|
| CZT HV Monitor |  |
| D_VDD | 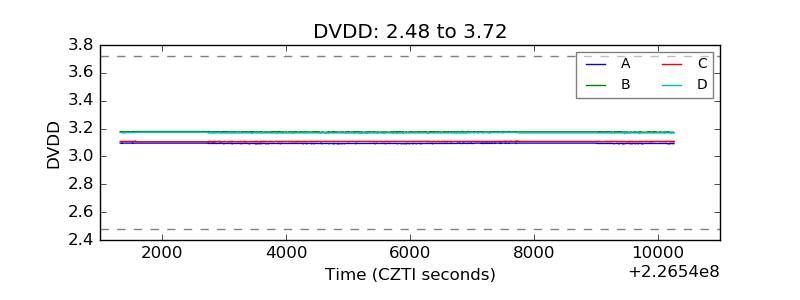 |
| Temperature 1 | 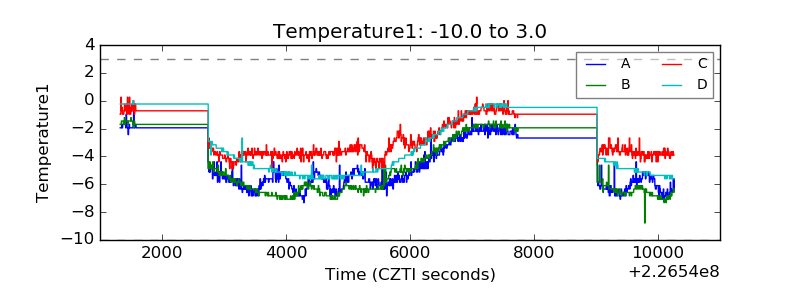 |
| Veto HV Monitor | 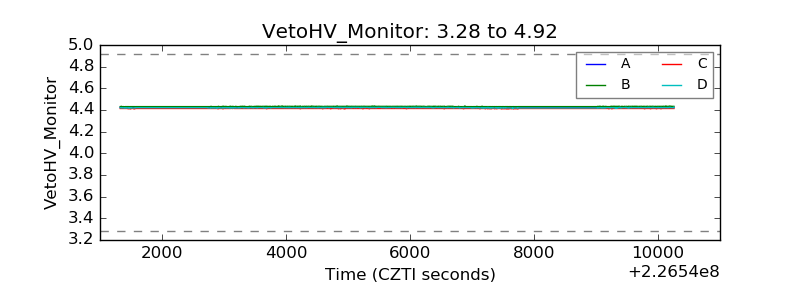 |
| Veto LLD | 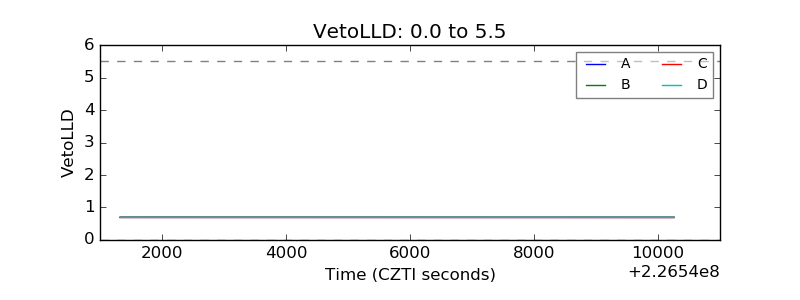 |
| Alpha Counter | 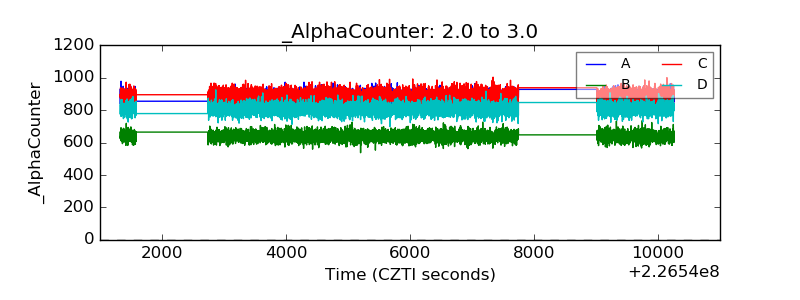 |
| _CPM_Rate | 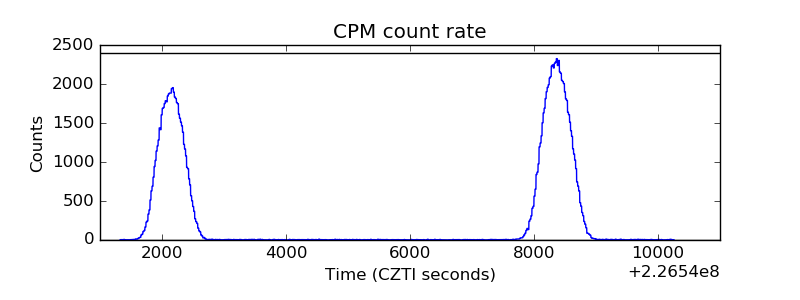 |
| CZT Counter | 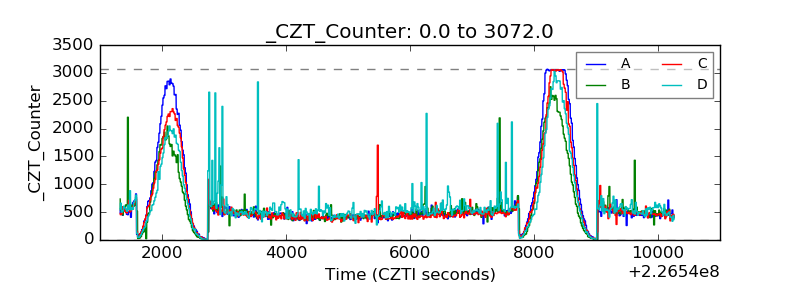 |
| +2.5 Volts monitor |  |
| +5 Volts monitor |  |
| _ROLL_ROT | 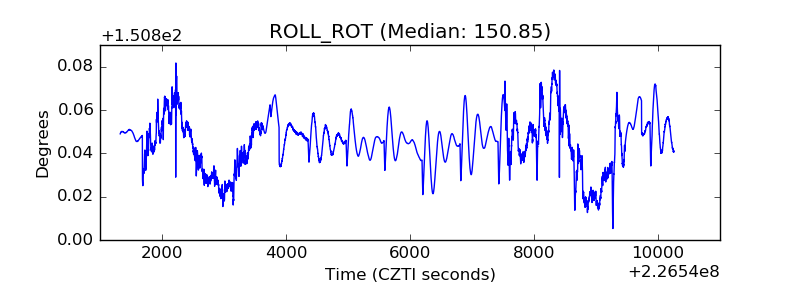 |
| _Roll_DEC | 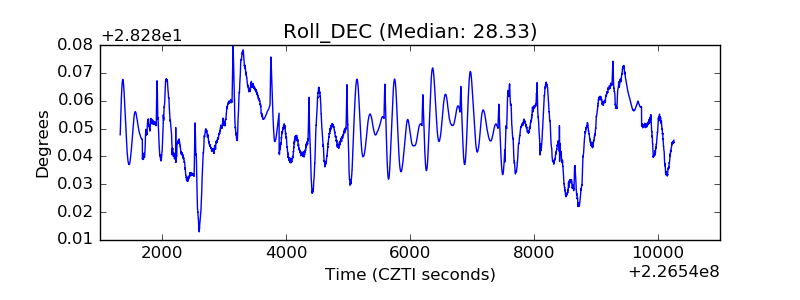 |
| _Roll_RA | 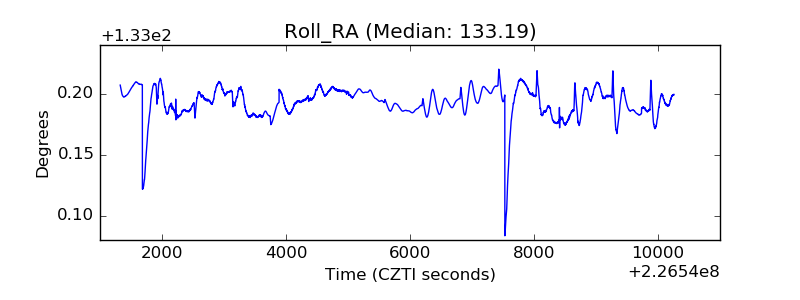 |
| Veto Counter | 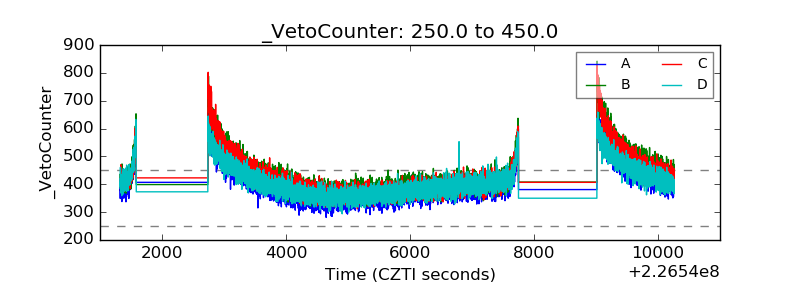 |