| Param | Original file | Final file |
|---|---|---|
| Filename | modeM0/AS1G06_169T01_9000001070_07788cztM0_level2.evt | modeM0/AS1G06_169T01_9000001070_07788cztM0_level2_quad_clean.evt |
| Size (bytes) | 292,766,400 | 47,534,400 |
| Size | 279.2 MB | 45.3 MB |
| Events in quadrant A | 2,031,149 | 287,937 |
| Events in quadrant B | 2,140,254 | 293,471 |
| Events in quadrant C | 2,028,091 | 281,323 |
| Events in quadrant D | 2,368,356 | 268,444 |
| Mode M9 | |||
|---|---|---|---|
| Quadrant | BADHDUFLAG | Total packets | Discarded packets |
| A | 0 | 4 | 0 |
| B | 0 | 4 | 0 |
| C | 0 | 4 | 0 |
| D | 0 | 5 | 0 |
| Mode SS | |||
|---|---|---|---|
| Quadrant | BADHDUFLAG | Total packets | Discarded packets |
| A | 0 | 88 | 0 |
| B | 0 | 88 | 0 |
| C | 0 | 88 | 0 |
| D | 0 | 88 | 0 |
| Mode M0 | |||
|---|---|---|---|
| Quadrant | BADHDUFLAG | Total packets | Discarded packets |
| A | 0 | 8867 | 1 |
| B | 0 | 9072 | 1 |
| C | 0 | 8905 | 1 |
| D | 0 | 9874 | 1 |
| Quadrant | Total seconds | Saturated seconds | Saturation percentage |
|---|---|---|---|
| A | 4373 | 12 | 0.274411% |
| B | 4373 | 16 | 0.365882% |
| C | 4373 | 4 | 0.091470% |
| D | 4373 | 13 | 0.297279% |
Noise dominated data is calculated using 1-second bins in cleaned event files. If a bin has >2000 counts, and if more than 50% of those come from <1% of pixels, then it is considered to be noise-dominated and hence unusable.
| Quadrant | # 1 sec bins | Bins with >0 counts | Bins with >2000 counts | High rate bins dominated by noise | Noise dominated (total time) | Noise dominated (detector-on time) | Marked lightcurve |
|---|---|---|---|---|---|---|---|
| A | 4373 | 4373 | 0 | 0 | 0.00% | 0.00% | 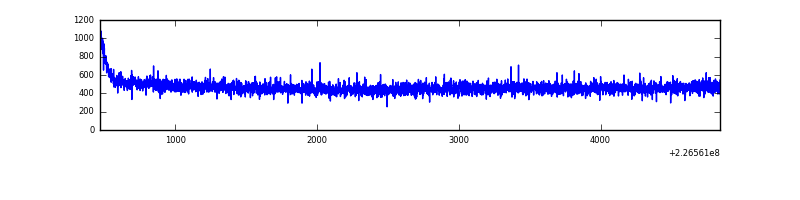 |
| B | 4373 | 4373 | 1 | 1 | 0.02% | 0.02% | 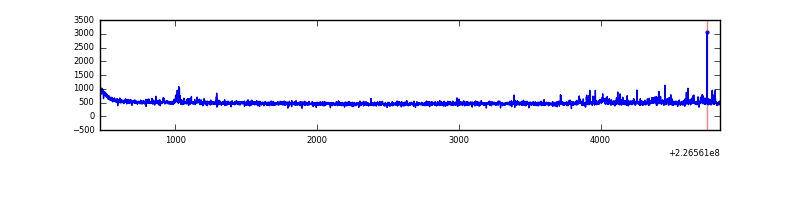 |
| C | 4373 | 4373 | 0 | 0 | 0.00% | 0.00% | 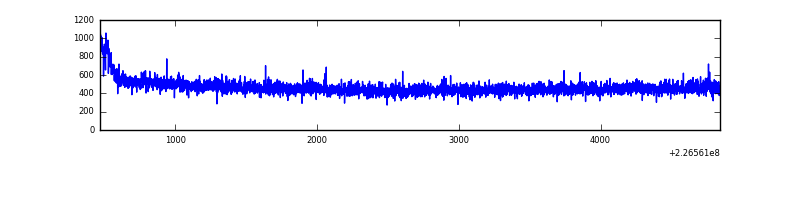 |
| D | 4373 | 4373 | 6 | 6 | 0.14% | 0.14% | 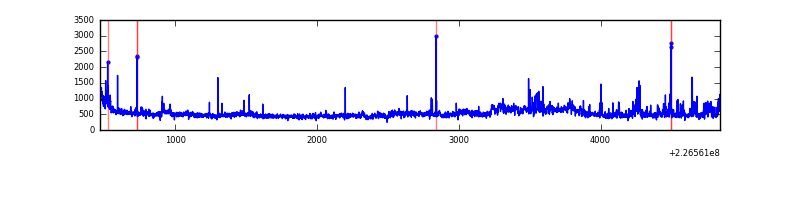 |
Top three noisy pixels from each quadrant. If the there are fewer than three noisy pixels in the level2.evt file, extra rows are filled as -1
| Pixel properties | Quadrant properties | ||||||
|---|---|---|---|---|---|---|---|
| Quadrant | DetID | PixID | Counts | Sigma | Mean | Median | Sigma |
| A | 0 | 226 | 4996 | 41.35 | 527 | 516 | 108.3 |
| A | 12 | 194 | 4604 | 37.73 | 527 | 516 | 108.3 |
| A | 13 | 14 | 3450 | 27.08 | 527 | 516 | 108.3 |
| B | 0 | 214 | 39639 | 386.59 | 530 | 518 | 101.2 |
| B | 0 | 213 | 18566 | 178.35 | 530 | 518 | 101.2 |
| B | 12 | 0 | 12293 | 116.36 | 530 | 518 | 101.2 |
| C | 1 | 16 | 53956 | 451.82 | 506 | 509 | 118.3 |
| C | 13 | 61 | 3828 | 28.06 | 506 | 509 | 118.3 |
| C | 3 | 202 | 1260 | 6.35 | 506 | 509 | 118.3 |
| D | 1 | 52 | 344439 | 2768.49 | 505 | 489 | 124.2 |
| D | 2 | 152 | 59188 | 472.47 | 505 | 489 | 124.2 |
| D | 13 | 137 | 17659 | 138.2 | 505 | 489 | 124.2 |
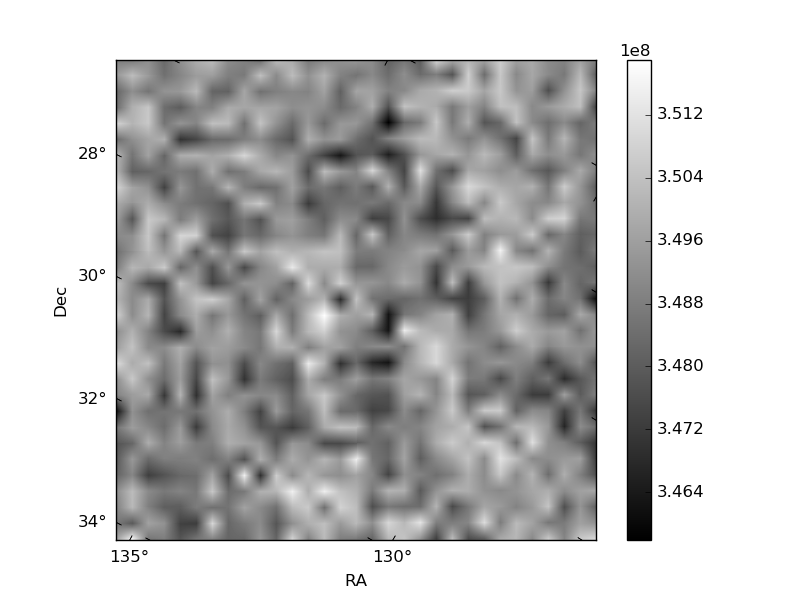
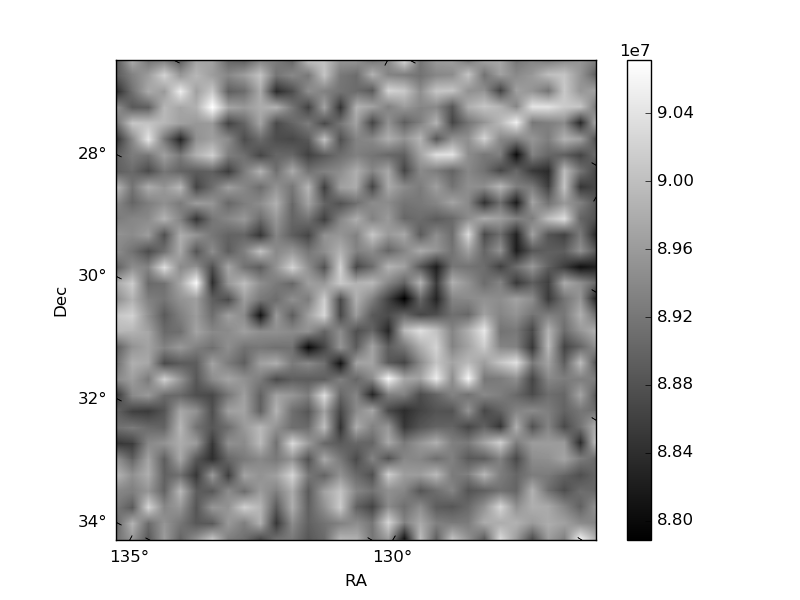
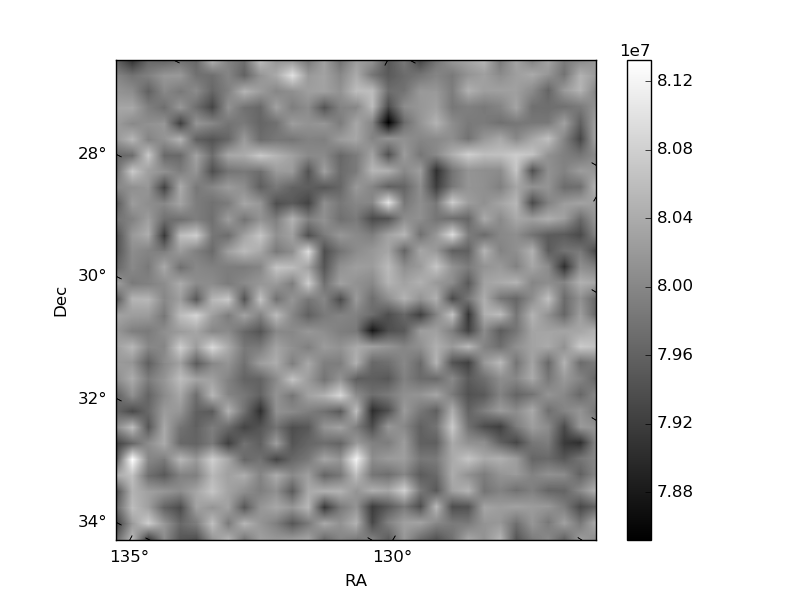
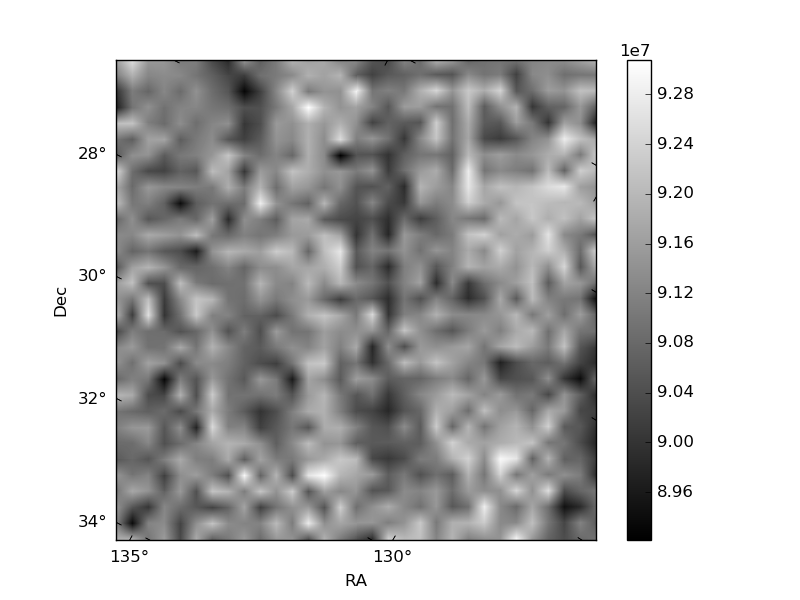
Histogram calculated using DETX and DETY for each event in the final _common_clean file
| Quadrant A | 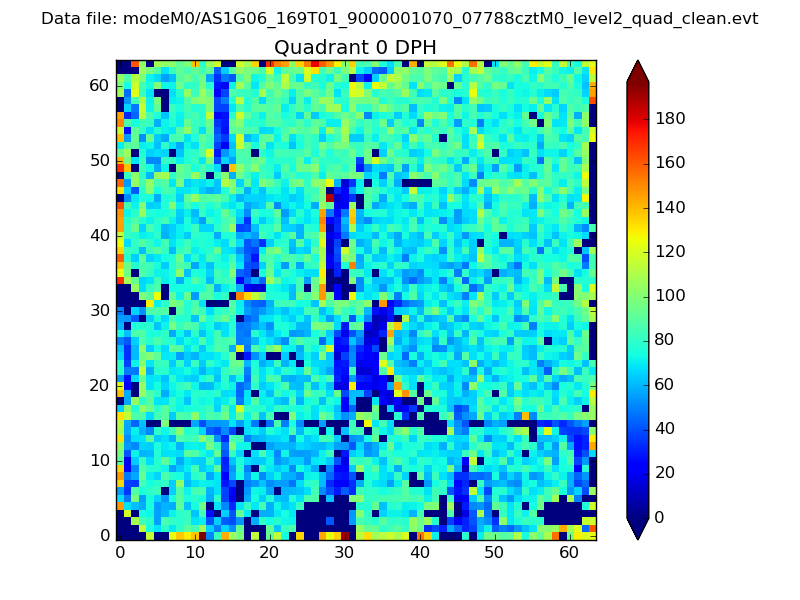 |
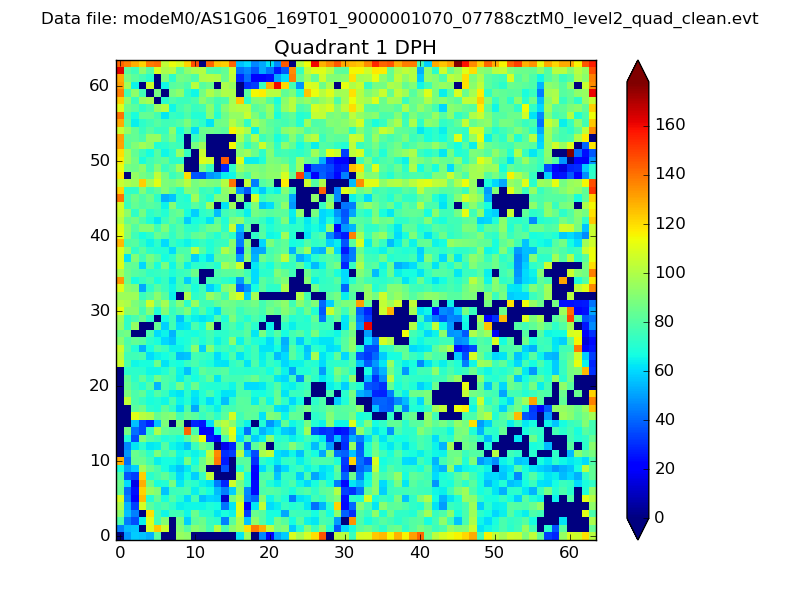 |
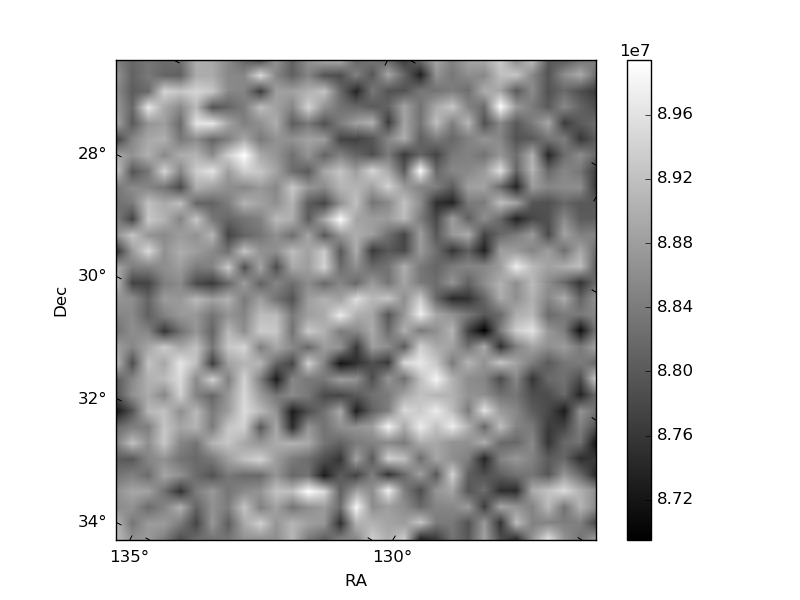
Quadrant B |
|---|---|---|---|
| Quadrant D | 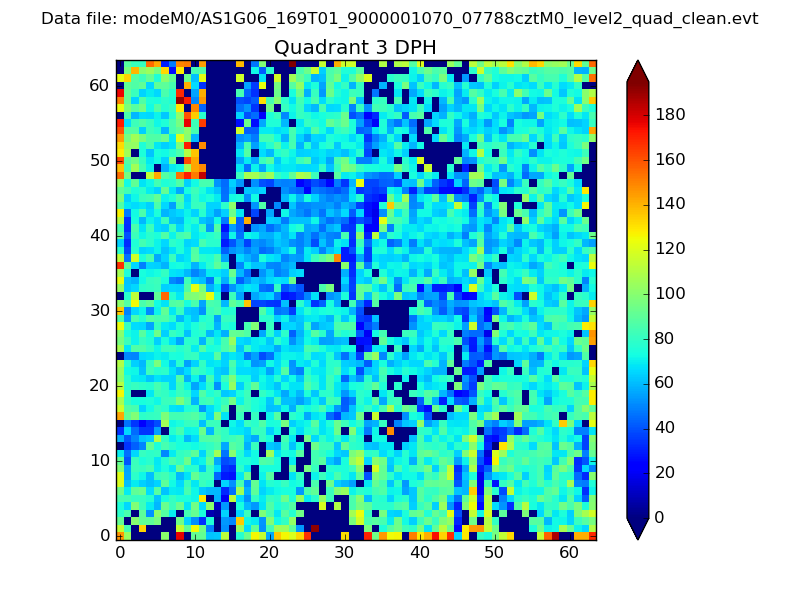 |
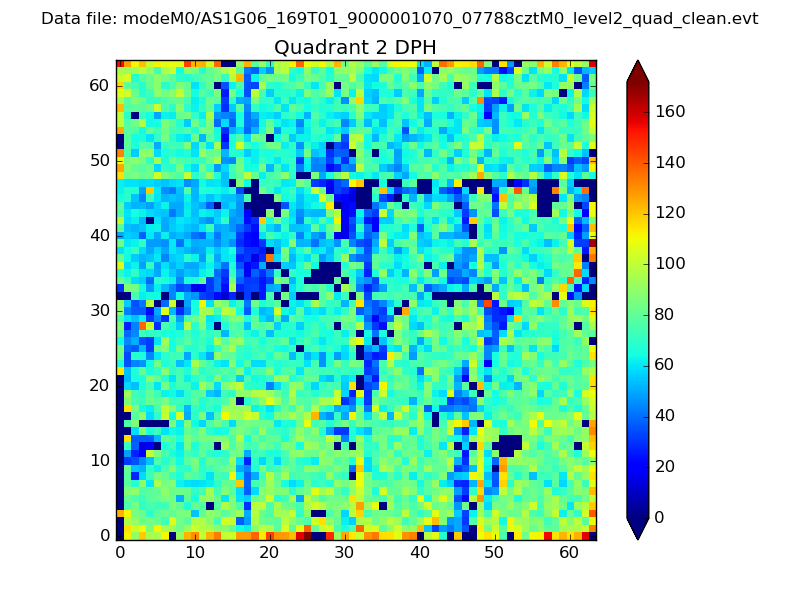 |
Quadrant C |
| Plot type | Count rate plots | Images |
|---|---|---|
| Comparison with Poisson distribution Blue bars denote a histogram of data divided into 1 sec bins. Red curve is a Poisson curve with rate = median count rate of data. |
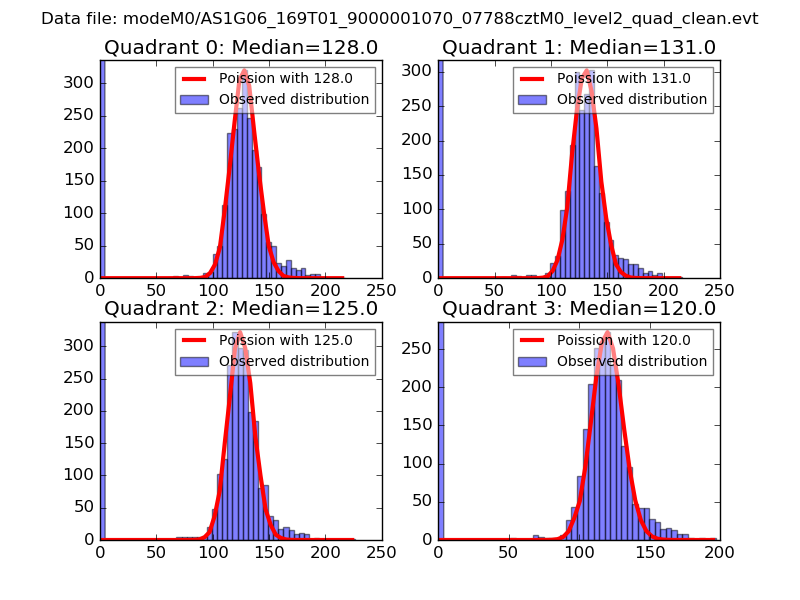 |
 |
| Quadrant-wise count rates Data is divided into 100 sec bins |
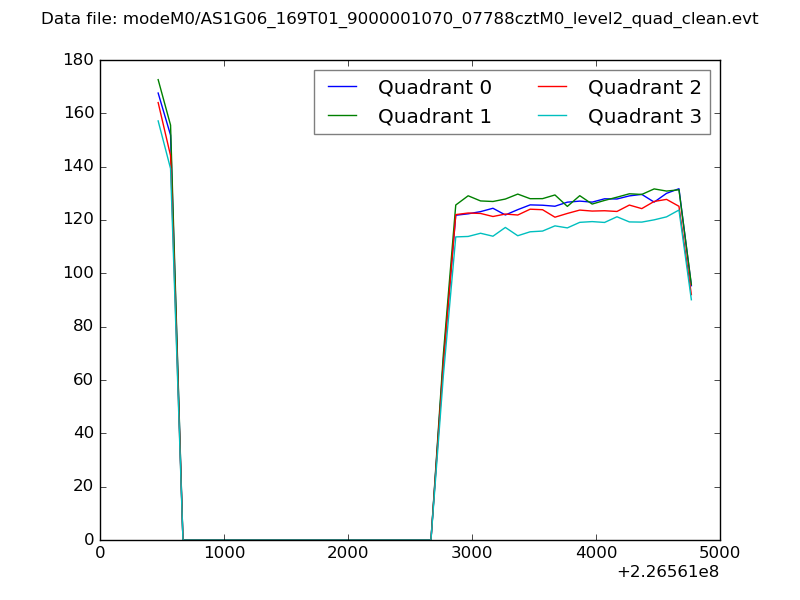 |
|
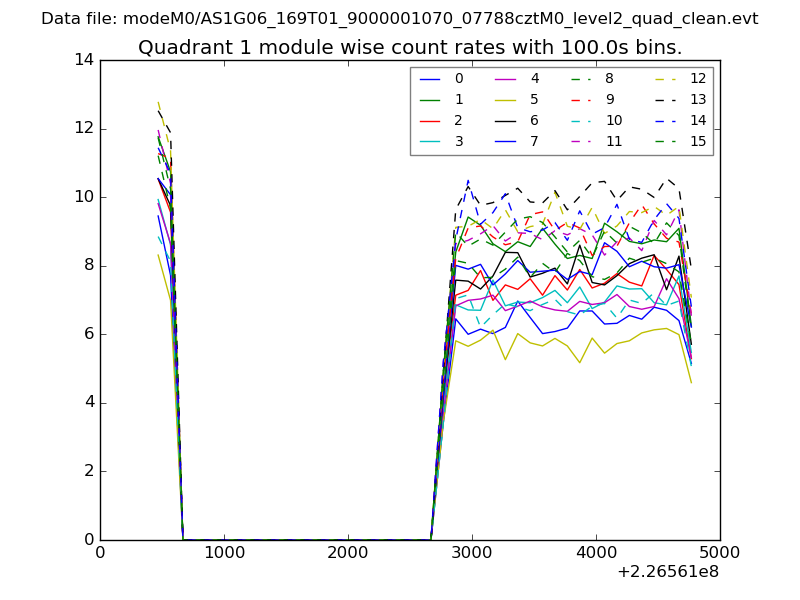
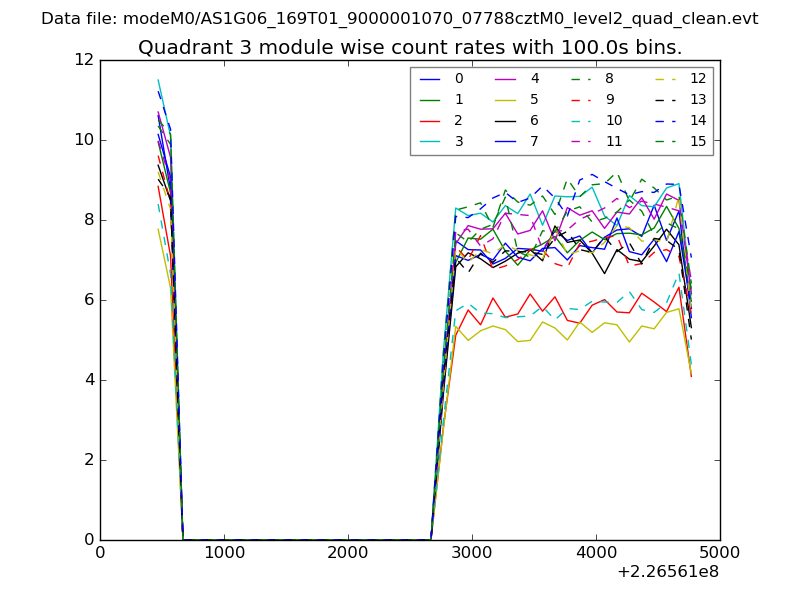
| Module-wise count rates for Quadrant A Data is divided into 100 sec bins |
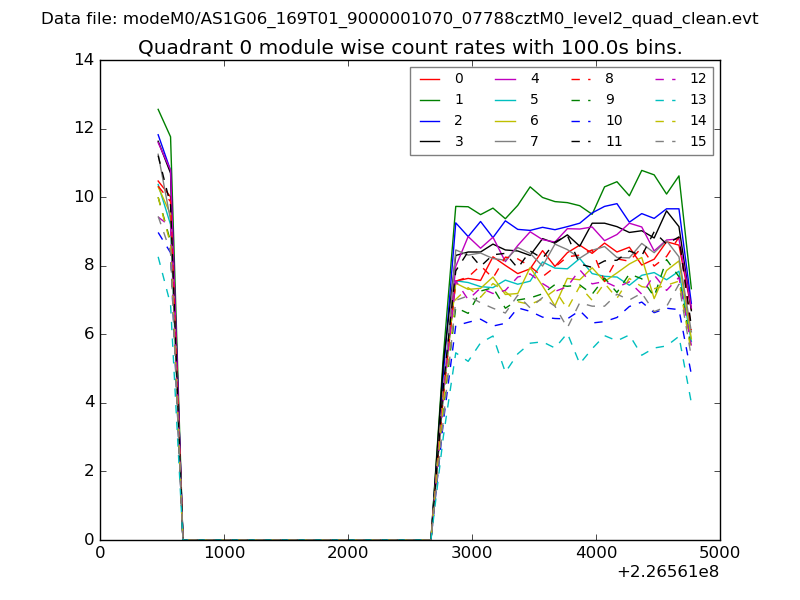 |
 |
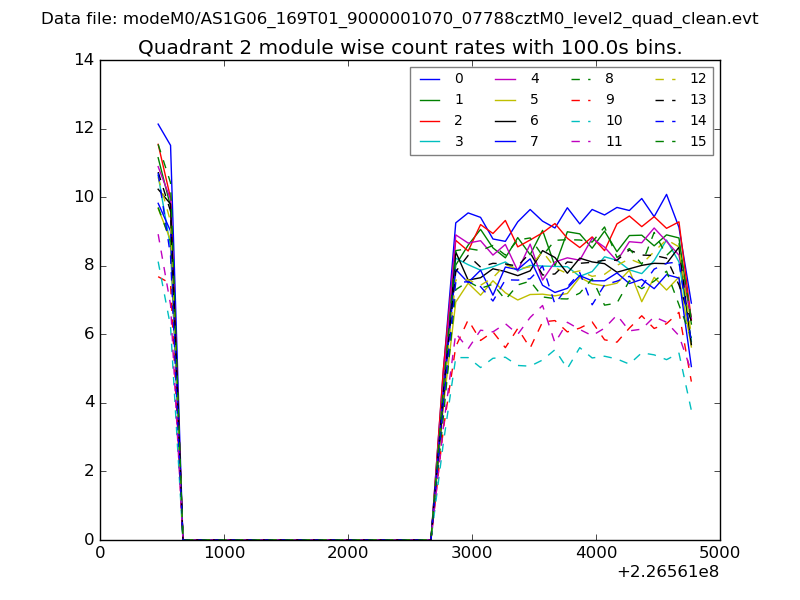
| Module-wise count rates for Quadrant B Data is divided into 100 sec bins |
 |
 |
| Module-wise count rates for Quadrant C Data is divided into 100 sec bins |
 |
 |
| Module-wise count rates for Quadrant D Data is divided into 100 sec bins |
 |
 |
| Parameter | Plot |
|---|---|
| CZT HV Monitor | 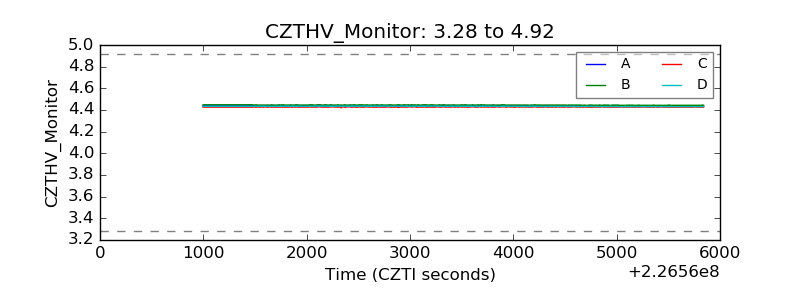 |
| D_VDD | 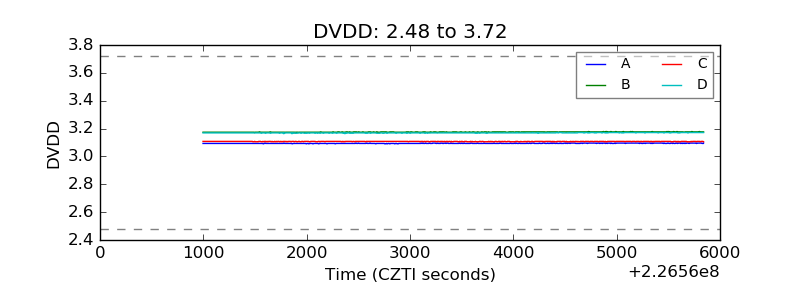 |
| Temperature 1 | 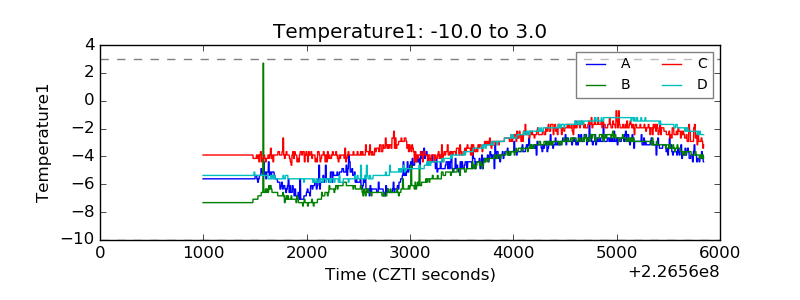 |
| Veto HV Monitor | 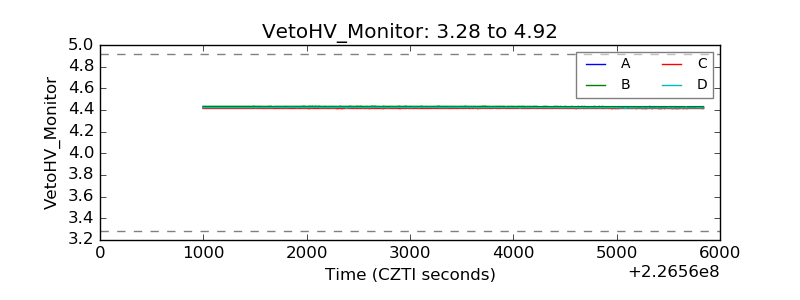 |
| Veto LLD | 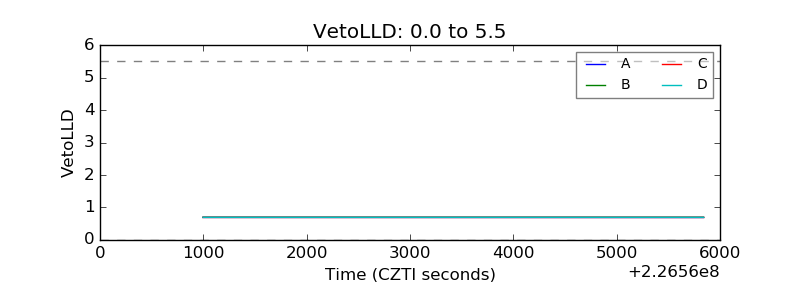 |
| Alpha Counter | 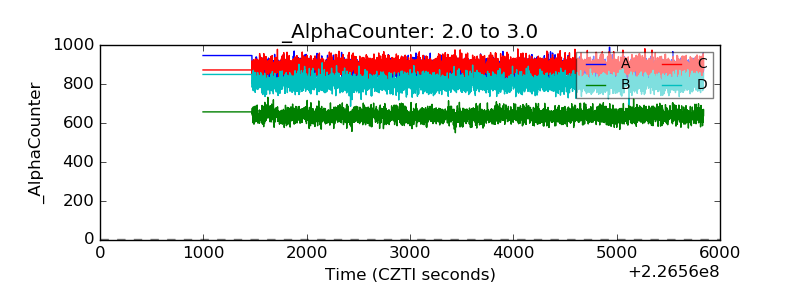 |
| _CPM_Rate | 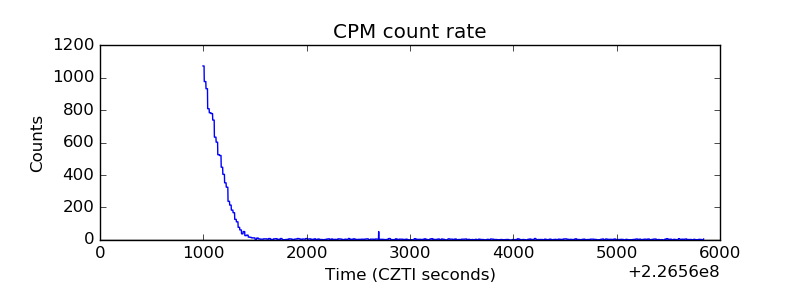 |
| CZT Counter | 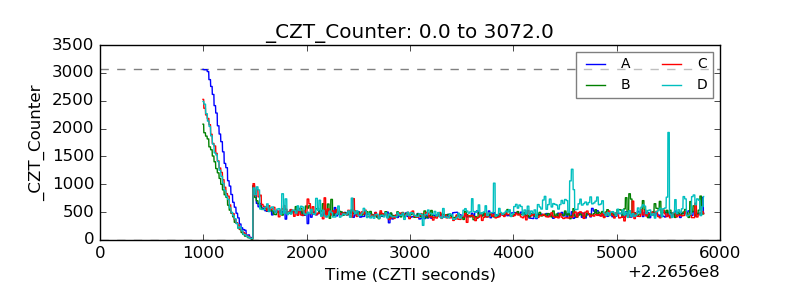 |
| +2.5 Volts monitor |  |
| +5 Volts monitor |  |
| _ROLL_ROT | 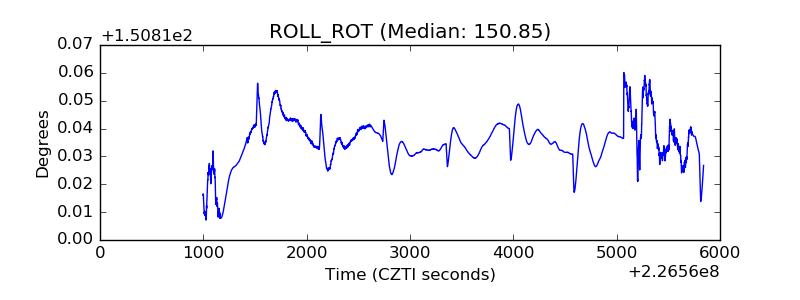 |
| _Roll_DEC | 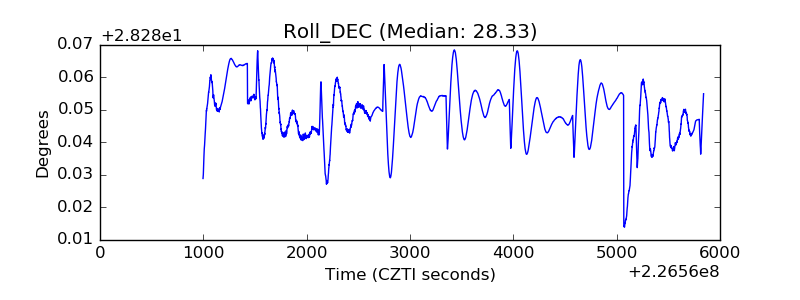 |
| _Roll_RA | 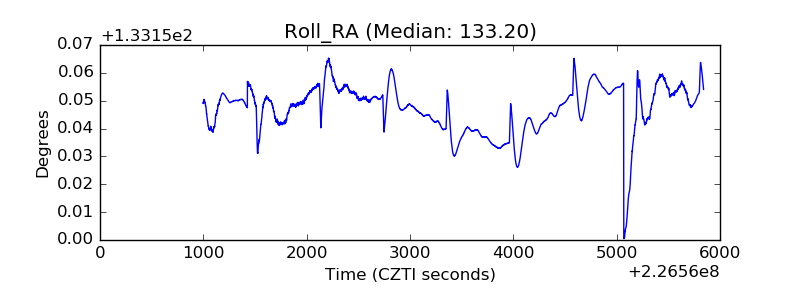 |
| Veto Counter | 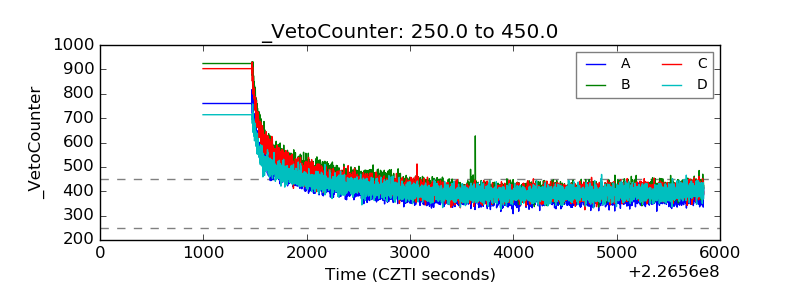 |