| Param | Original file | Final file |
|---|---|---|
| Filename | modeM0/AS1A02_132T01_9000001072cztM0_level2.fits | modeM0/AS1A02_132T01_9000001072cztM0_level2_quad_clean.evt |
| Size (bytes) | 304,652,160 | 300,288,960 |
| Size | 290.5 MB | 286.4 MB |
| Events in quadrant A | 1,825,702 | 1,783,725 |
| Events in quadrant B | 1,770,360 | 1,799,324 |
| Events in quadrant C | 1,809,556 | 1,717,575 |
| Events in quadrant D | 1,538,640 | 1,512,316 |
| Mode SS | |||
|---|---|---|---|
| Quadrant | BADHDUFLAG | Total packets | Discarded packets |
| A | 0 | 674 | 0 |
| B | 0 | 674 | 0 |
| C | 0 | 674 | 0 |
| D | 0 | 674 | 0 |
| Mode M0 | |||
|---|---|---|---|
| Quadrant | BADHDUFLAG | Total packets | Discarded packets |
| A | 0 | 68524 | 0 |
| B | 0 | 70013 | 0 |
| C | 0 | 70641 | 0 |
| D | 0 | 85637 | 0 |
| Mode M9 | |||
|---|---|---|---|
| Quadrant | BADHDUFLAG | Total packets | Discarded packets |
| A | 0 | 24 | 0 |
| B | 0 | 24 | 0 |
| C | 0 | 24 | 0 |
| D | 0 | 24 | 0 |
| Quadrant | Total seconds | Saturated seconds | Saturation percentage |
|---|---|---|---|
| A | 33196 | 777 | 2.340643% |
| B | 33197 | 783 | 2.358647% |
| C | 33197 | 726 | 2.186945% |
| D | 33197 | 1755 | 5.286622% |
Noise dominated data is calculated using 1-second bins in cleaned event files. If a bin has >2000 counts, and if more than 50% of those come from <1% of pixels, then it is considered to be noise-dominated and hence unusable.
| Quadrant | # 1 sec bins | Bins with >0 counts | Bins with >2000 counts | High rate bins dominated by noise | Noise dominated (total time) | Noise dominated (detector-on time) | Marked lightcurve |
|---|---|---|---|---|---|---|---|
| A | 35304 | 33193 | 0 | 0 | 0.00% | 0.00% | 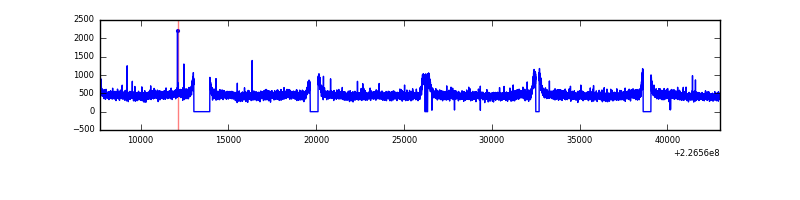 |
| B | 35305 | 33194 | 0 | 0 | 0.00% | 0.00% | 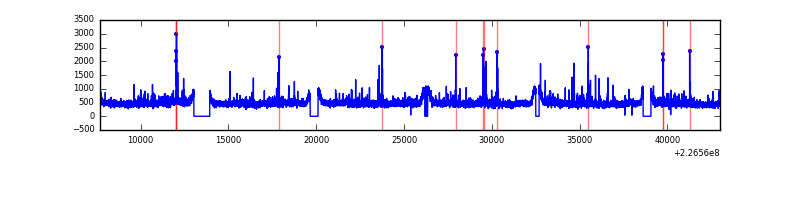 |
| C | 35305 | 33194 | 0 | 0 | 0.00% | 0.00% | 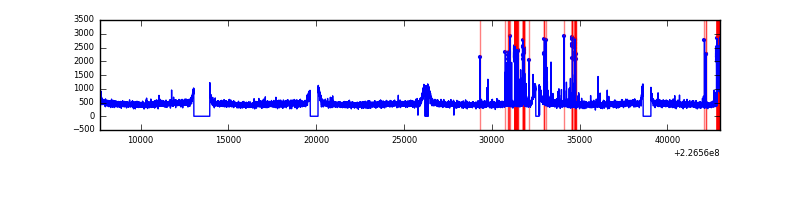 |
| D | 35305 | 33192 | 0 | 0 | 0.00% | 0.00% | 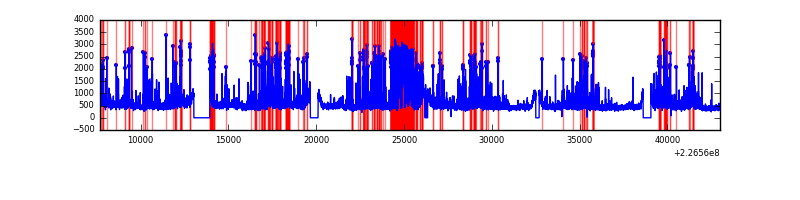 |
Top three noisy pixels from each quadrant. If the there are fewer than three noisy pixels in the level2.evt file, extra rows are filled as -1
| Pixel properties | Quadrant properties | ||||||
|---|---|---|---|---|---|---|---|
| Quadrant | DetID | PixID | Counts | Sigma | Mean | Median | Sigma |
| A | 0 | 29 | 1805 | 11.11 | 473 | 439 | 122.9 |
| A | 14 | 188 | 1774 | 10.86 | 473 | 439 | 122.9 |
| A | 14 | 204 | 1577 | 9.25 | 473 | 439 | 122.9 |
| B | 2 | 9 | 1587 | 11.78 | 466 | 441 | 97.3 |
| B | 3 | 17 | 1217 | 7.98 | 466 | 441 | 97.3 |
| B | 14 | 254 | 1212 | 7.93 | 466 | 441 | 97.3 |
| C | 1 | 80 | 1383 | 7.34 | 478 | 441 | 128.4 |
| C | 1 | 81 | 1379 | 7.31 | 478 | 441 | 128.4 |
| C | 12 | 241 | 1228 | 6.13 | 478 | 441 | 128.4 |
| D | 3 | 31 | 1105 | 5.88 | 439 | 398 | 120.2 |
| D | 7 | 3 | 1078 | 5.66 | 439 | 398 | 120.2 |
| D | 3 | 14 | 1076 | 5.64 | 439 | 398 | 120.2 |
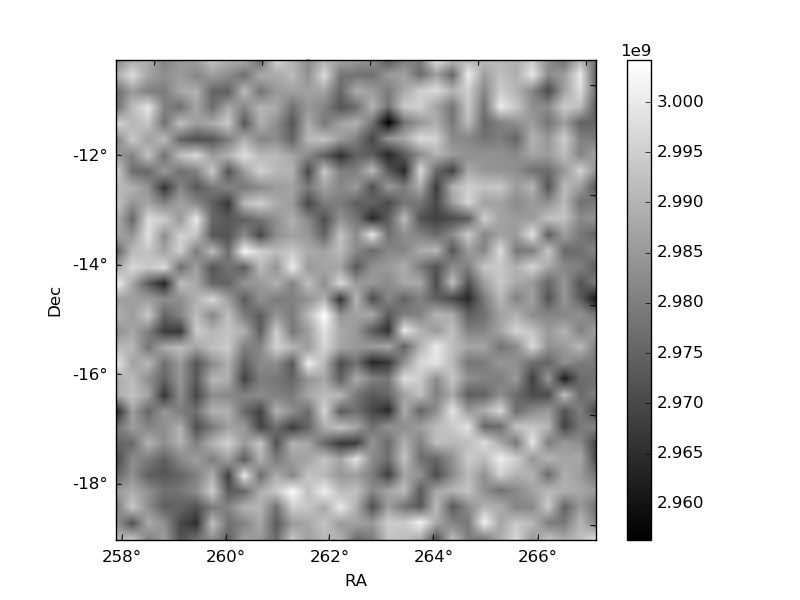
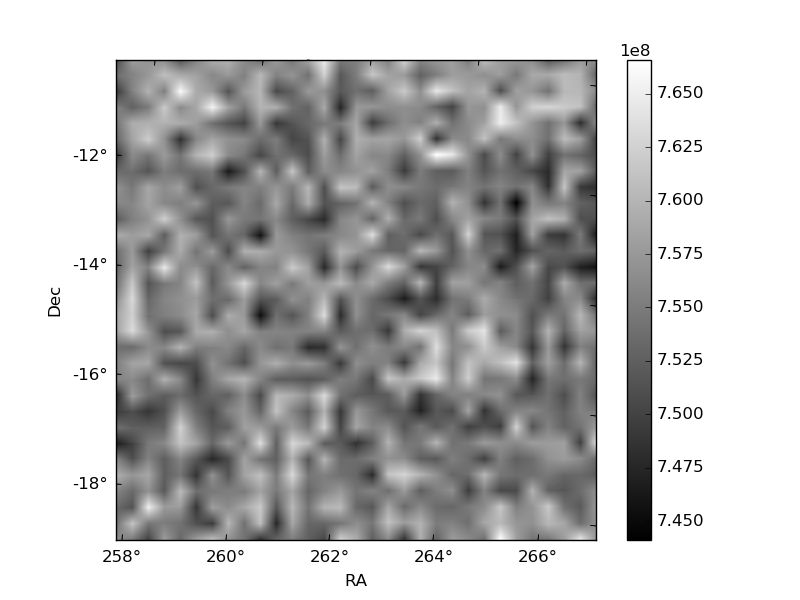
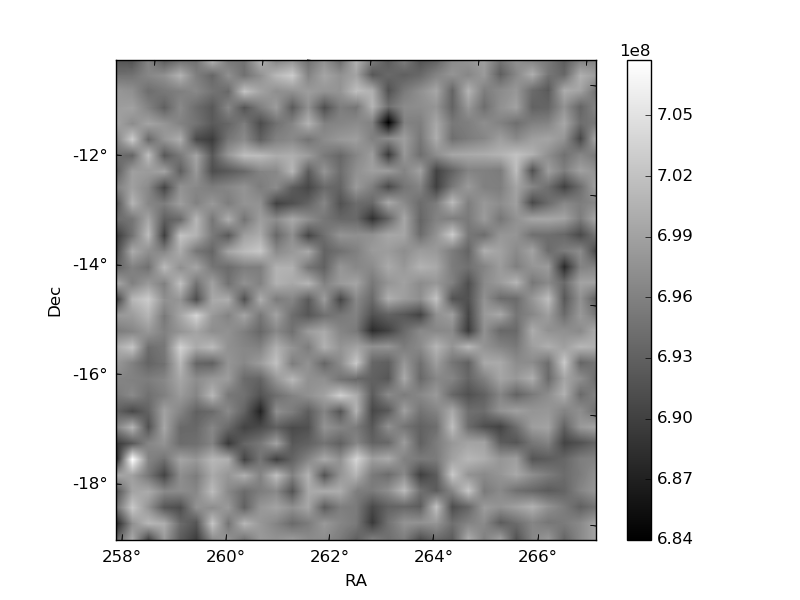
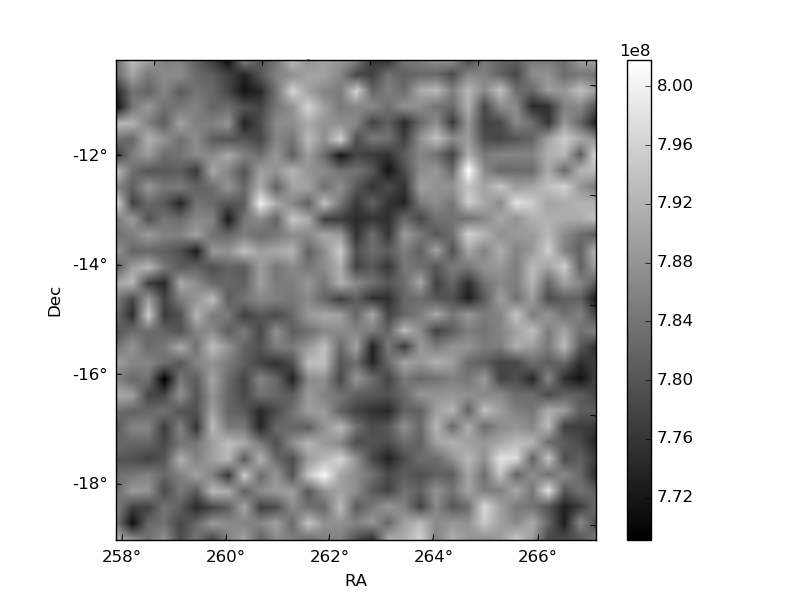
Histogram calculated using DETX and DETY for each event in the final _common_clean file
| Quadrant A | 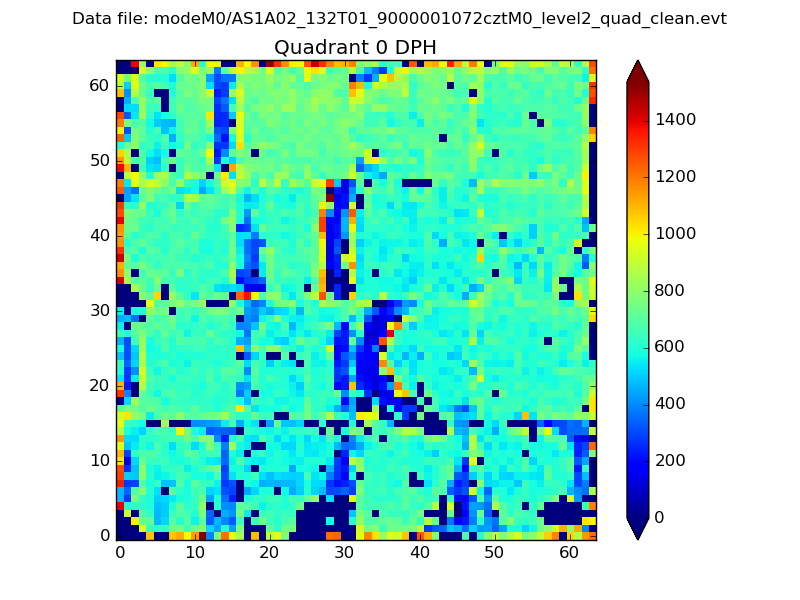 |
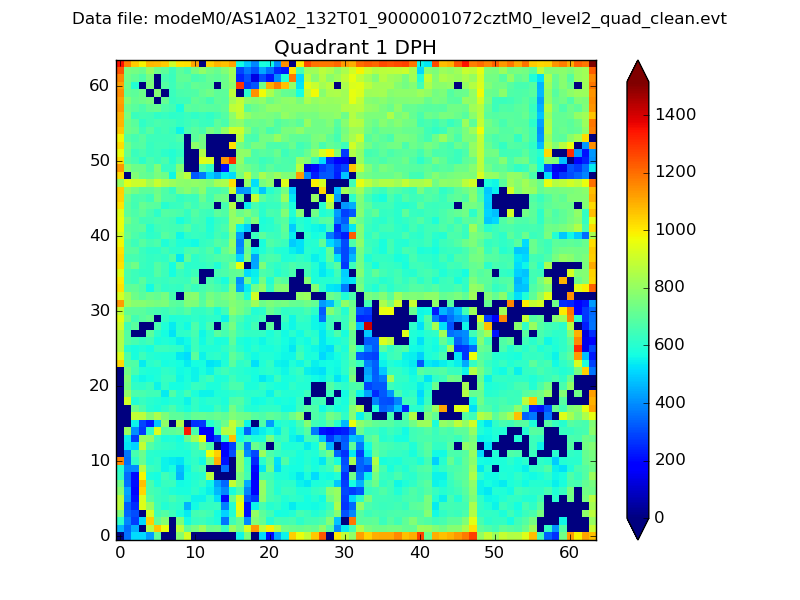 |
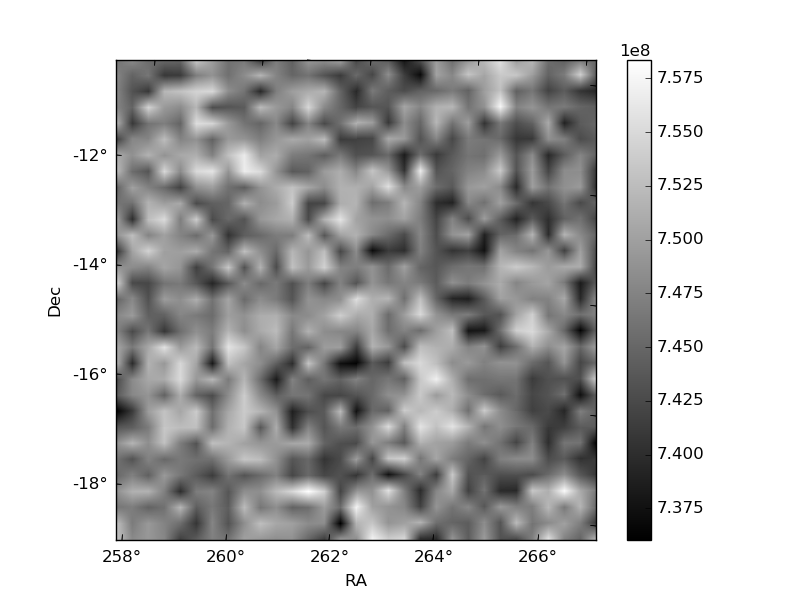
Quadrant B |
|---|---|---|---|
| Quadrant D | 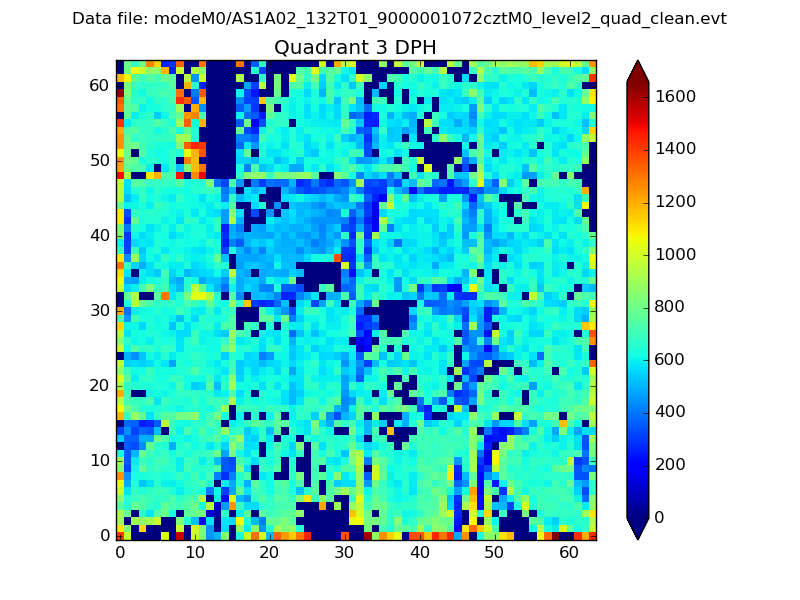 |
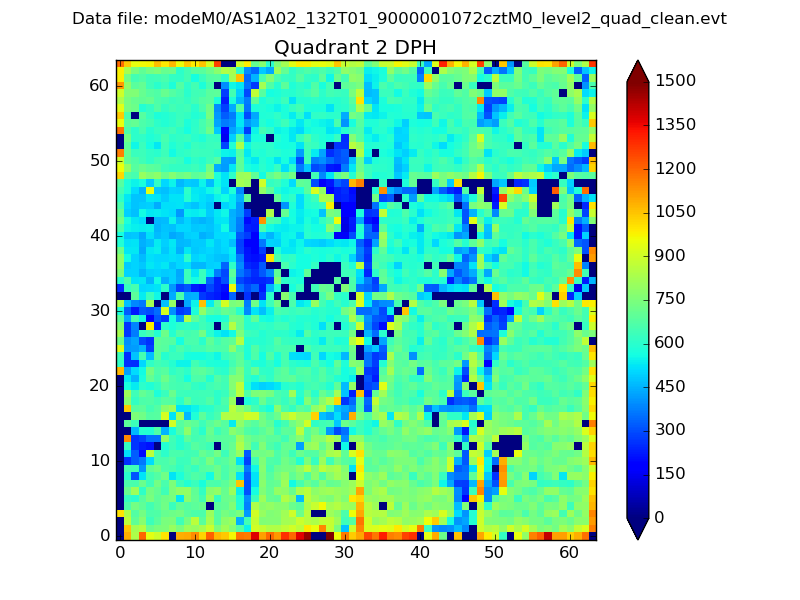 |
Quadrant C |
| Plot type | Count rate plots | Images |
|---|---|---|
| Comparison with Poisson distribution Blue bars denote a histogram of data divided into 1 sec bins. Red curve is a Poisson curve with rate = median count rate of data. |
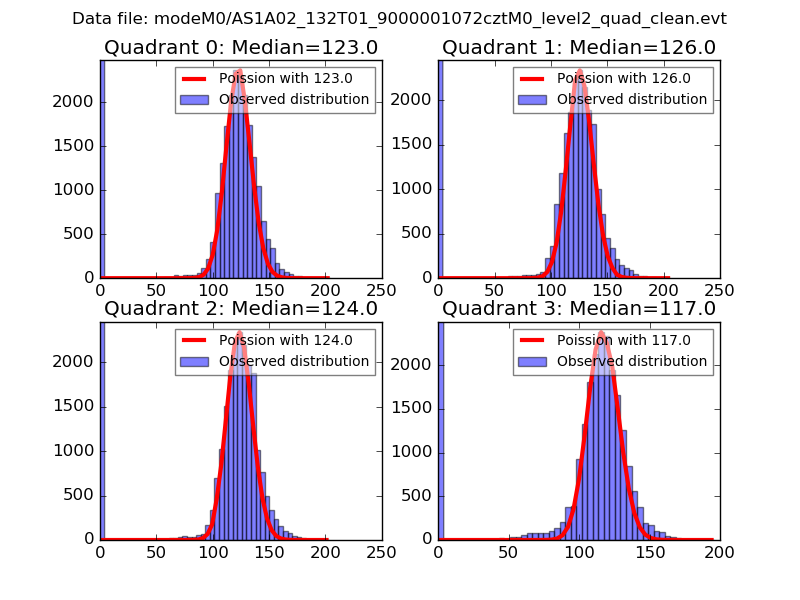 |
 |
| Quadrant-wise count rates Data is divided into 100 sec bins |
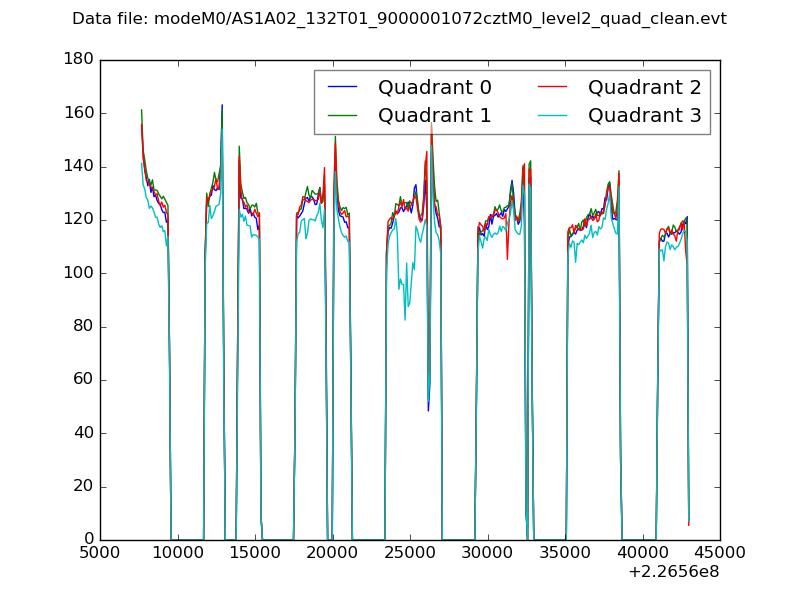 |
|
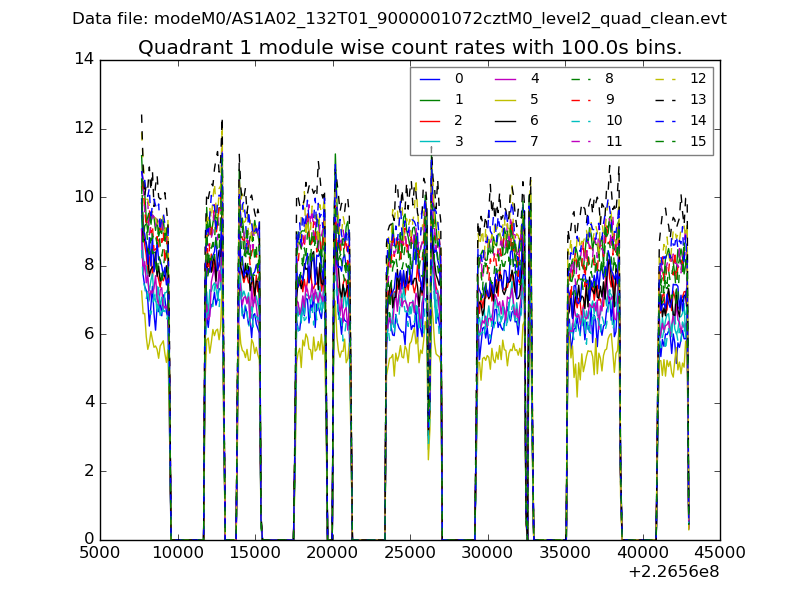
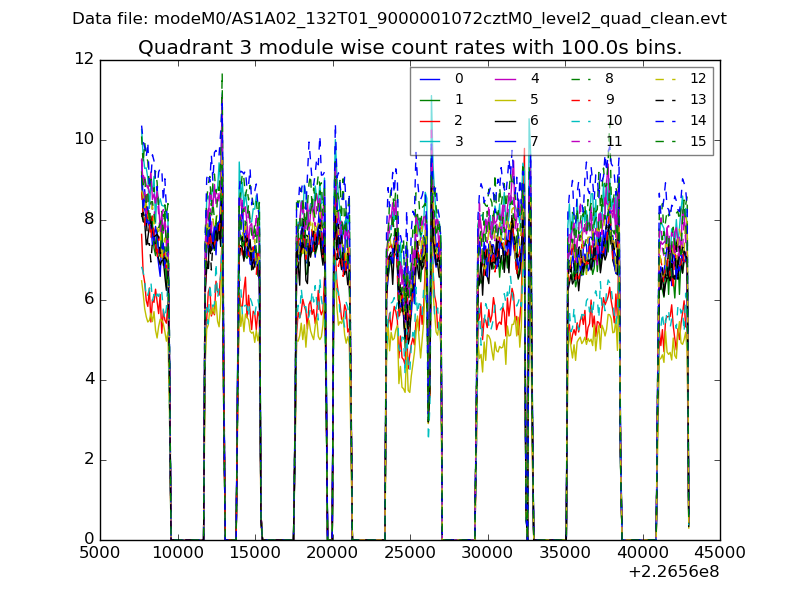
| Module-wise count rates for Quadrant A Data is divided into 100 sec bins |
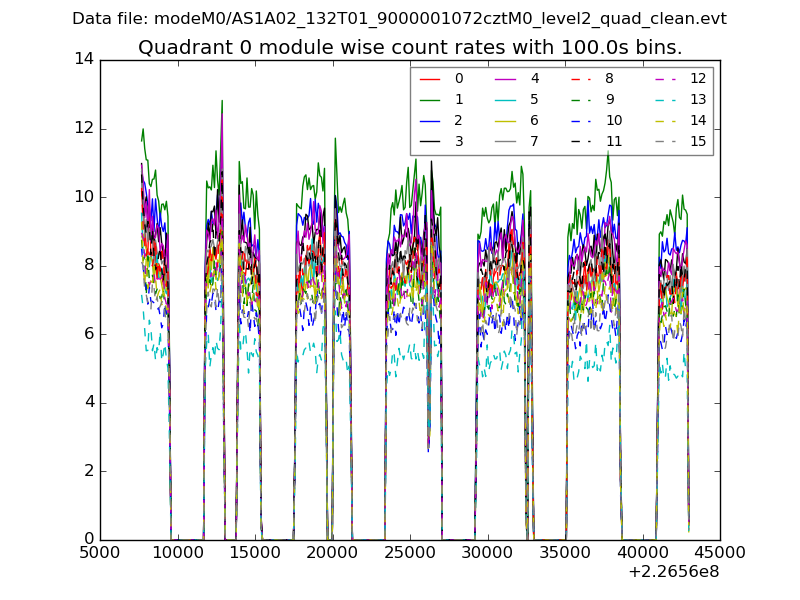 |
 |
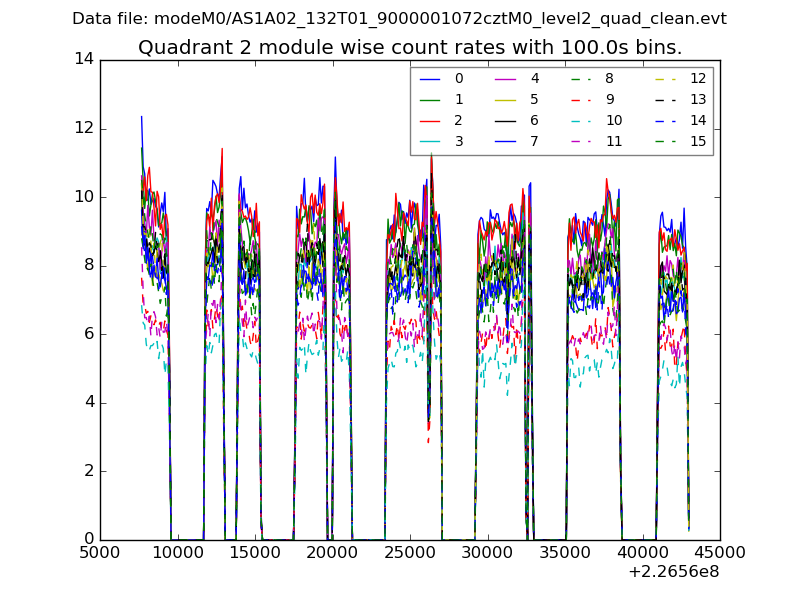
| Module-wise count rates for Quadrant B Data is divided into 100 sec bins |
 |
 |
| Module-wise count rates for Quadrant C Data is divided into 100 sec bins |
 |
 |
| Module-wise count rates for Quadrant D Data is divided into 100 sec bins |
 |
 |
| Parameter | Plot |
|---|---|
| CZT HV Monitor | 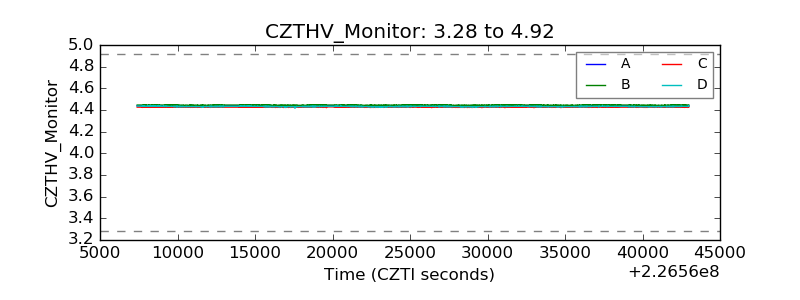 |
| D_VDD | 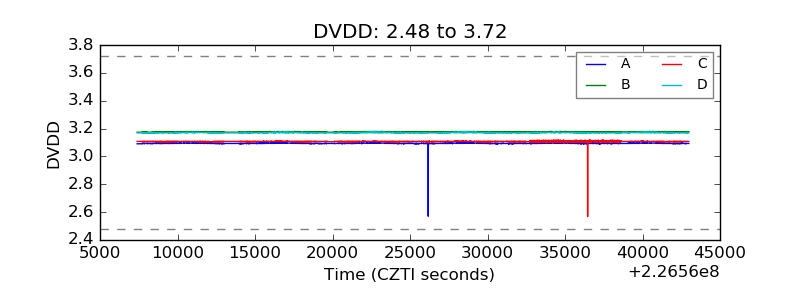 |
| Temperature 1 | 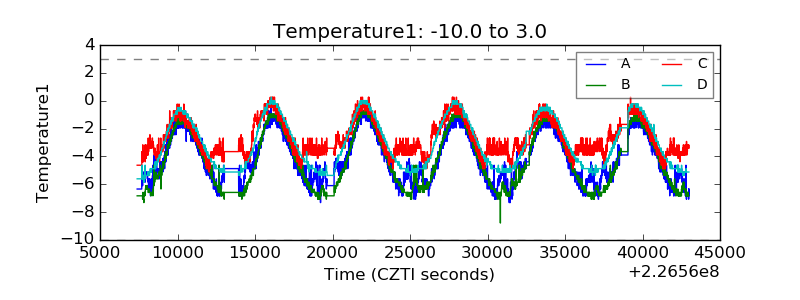 |
| Veto HV Monitor | 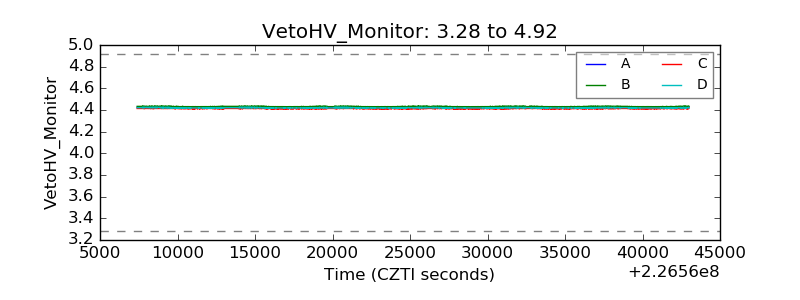 |
| Veto LLD | 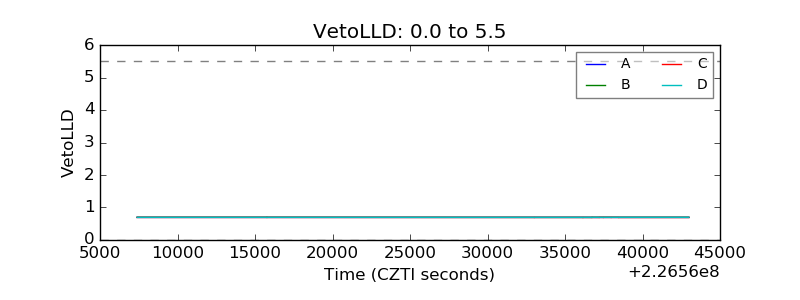 |
| Alpha Counter | 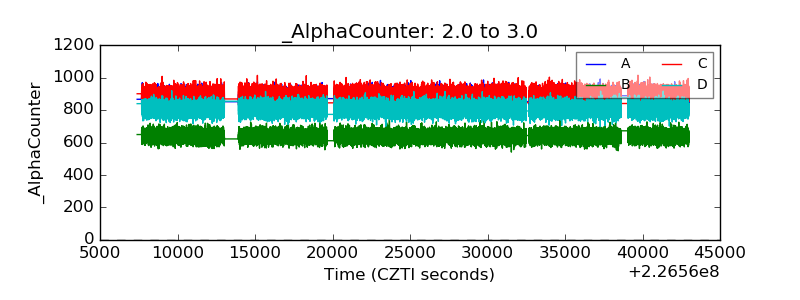 |
| _CPM_Rate | 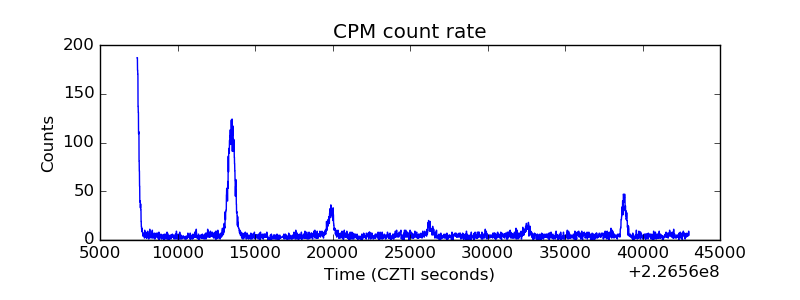 |
| CZT Counter | 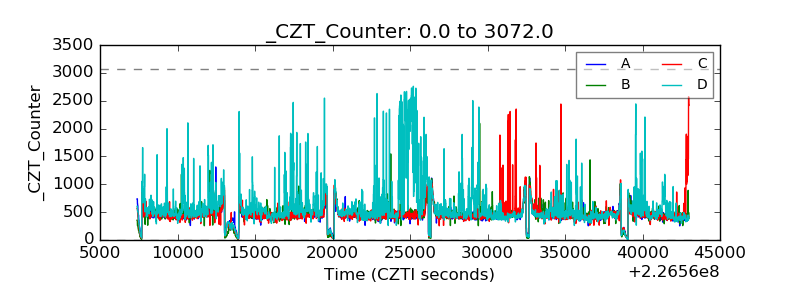 |
| +2.5 Volts monitor | 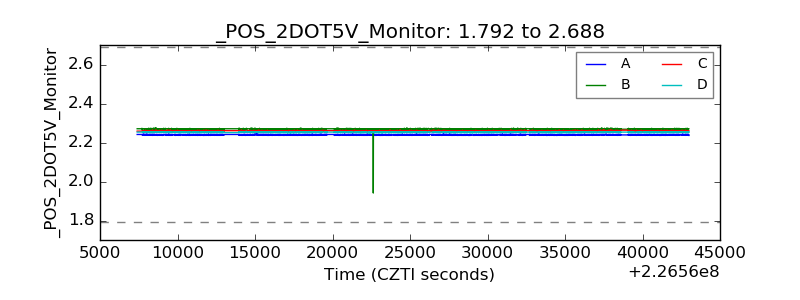 |
| +5 Volts monitor | 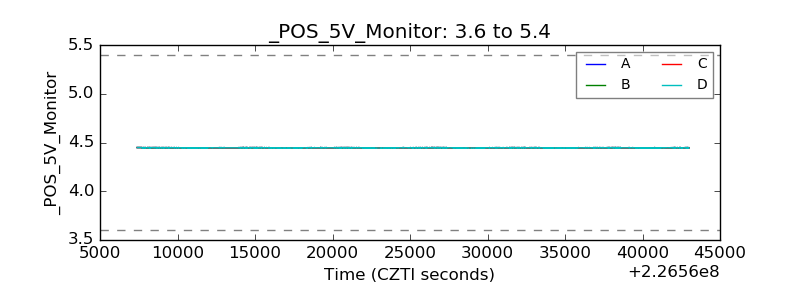 |
| _ROLL_ROT | 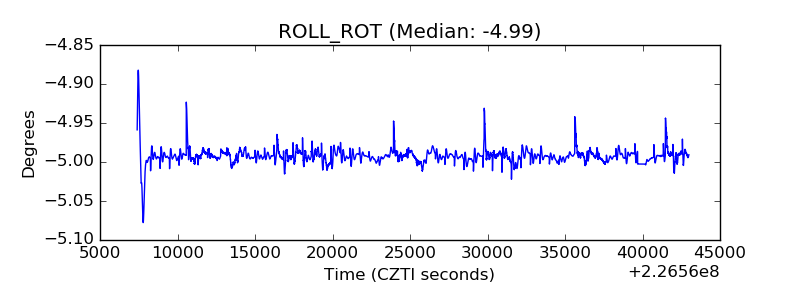 |
| _Roll_DEC | 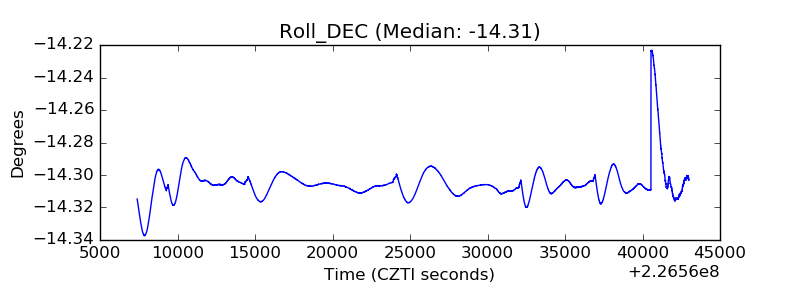 |
| _Roll_RA |  |
| Veto Counter | 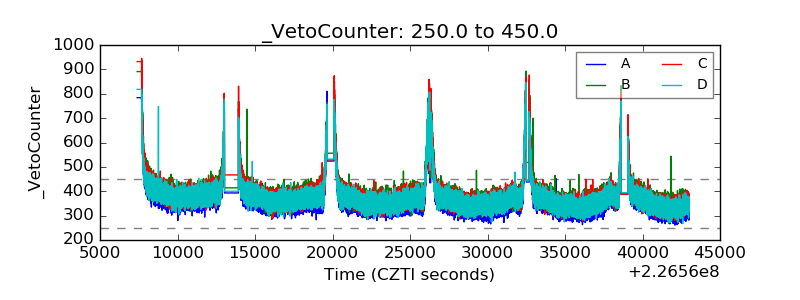 |