| Param | Original file | Final file |
|---|---|---|
| Filename | modeM0/AS1A02_132T01_9000001072_07788cztM0_level2.evt | modeM0/AS1A02_132T01_9000001072_07788cztM0_level2_quad_clean.evt |
| Size (bytes) | 112,265,280 | 31,734,720 |
| Size | 107.1 MB | 30.3 MB |
| Events in quadrant A | 756,754 | 212,112 |
| Events in quadrant B | 774,873 | 216,953 |
| Events in quadrant C | 763,213 | 213,699 |
| Events in quadrant D | 993,165 | 199,636 |
| Mode SS | |||
|---|---|---|---|
| Quadrant | BADHDUFLAG | Total packets | Discarded packets |
| A | 0 | 32 | 0 |
| B | 0 | 32 | 0 |
| C | 0 | 32 | 0 |
| D | 0 | 32 | 0 |
| Mode M0 | |||
|---|---|---|---|
| Quadrant | BADHDUFLAG | Total packets | Discarded packets |
| A | 0 | 3312 | 2 |
| B | 0 | 3316 | 1 |
| C | 0 | 3318 | 1 |
| D | 0 | 3934 | 1 |
| Mode M9 | |||
|---|---|---|---|
| Quadrant | BADHDUFLAG | Total packets | Discarded packets |
| A | 0 | 3 | 0 |
| B | 0 | 3 | 0 |
| C | 0 | 3 | 0 |
| D | 0 | 3 | 0 |
| Quadrant | Total seconds | Saturated seconds | Saturation percentage |
|---|---|---|---|
| A | 1604 | 28 | 1.745636% |
| B | 1604 | 30 | 1.870324% |
| C | 1604 | 28 | 1.745636% |
| D | 1604 | 48 | 2.992519% |
Noise dominated data is calculated using 1-second bins in cleaned event files. If a bin has >2000 counts, and if more than 50% of those come from <1% of pixels, then it is considered to be noise-dominated and hence unusable.
| Quadrant | # 1 sec bins | Bins with >0 counts | Bins with >2000 counts | High rate bins dominated by noise | Noise dominated (total time) | Noise dominated (detector-on time) | Marked lightcurve |
|---|---|---|---|---|---|---|---|
| A | 1604 | 1604 | 0 | 0 | 0.00% | 0.00% | 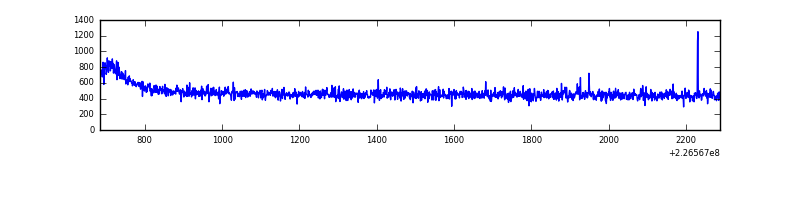 |
| B | 1604 | 1604 | 0 | 0 | 0.00% | 0.00% | 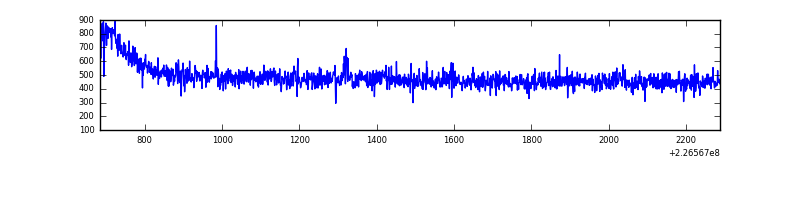 |
| C | 1604 | 1604 | 0 | 0 | 0.00% | 0.00% | 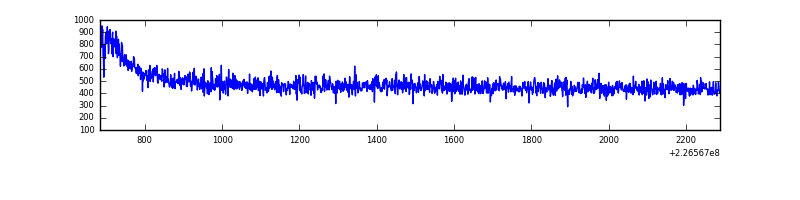 |
| D | 1604 | 1604 | 9 | 9 | 0.56% | 0.56% | 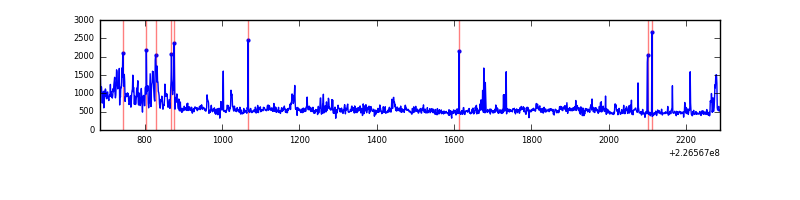 |
Top three noisy pixels from each quadrant. If the there are fewer than three noisy pixels in the level2.evt file, extra rows are filled as -1
| Pixel properties | Quadrant properties | ||||||
|---|---|---|---|---|---|---|---|
| Quadrant | DetID | PixID | Counts | Sigma | Mean | Median | Sigma |
| A | 13 | 248 | 3321 | 75.14 | 195 | 191 | 41.7 |
| A | 0 | 226 | 1892 | 40.84 | 195 | 191 | 41.7 |
| A | 12 | 194 | 1681 | 35.77 | 195 | 191 | 41.7 |
| B | 0 | 219 | 7151 | 178.9 | 196 | 192 | 38.9 |
| B | 12 | 111 | 3831 | 93.55 | 196 | 192 | 38.9 |
| B | 11 | 111 | 3088 | 74.45 | 196 | 192 | 38.9 |
| C | 1 | 16 | 9215 | 193.32 | 193 | 194 | 46.7 |
| C | 13 | 61 | 1451 | 26.94 | 193 | 194 | 46.7 |
| C | 3 | 202 | 477 | 6.06 | 193 | 194 | 46.7 |
| D | 1 | 52 | 126541 | 2637.0 | 190 | 185 | 47.9 |
| D | 13 | 137 | 107220 | 2233.78 | 190 | 185 | 47.9 |
| D | 2 | 152 | 32744 | 679.49 | 190 | 185 | 47.9 |
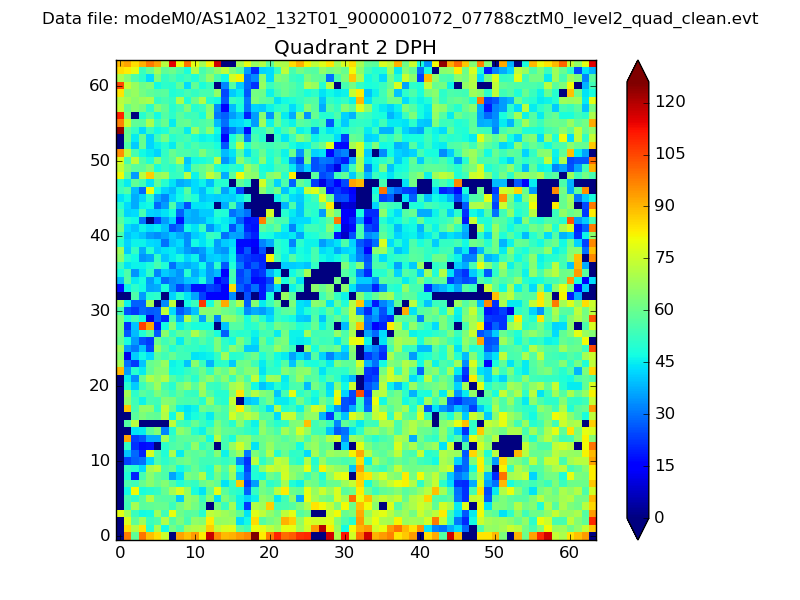
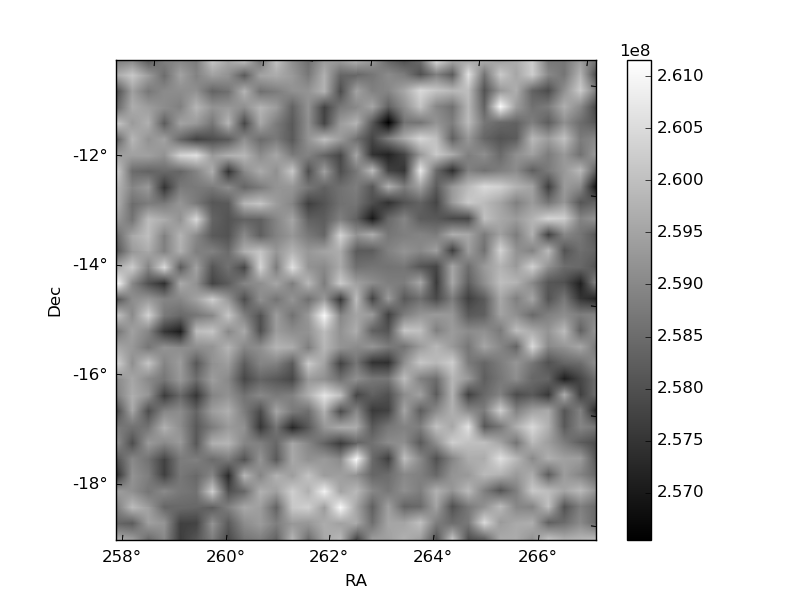
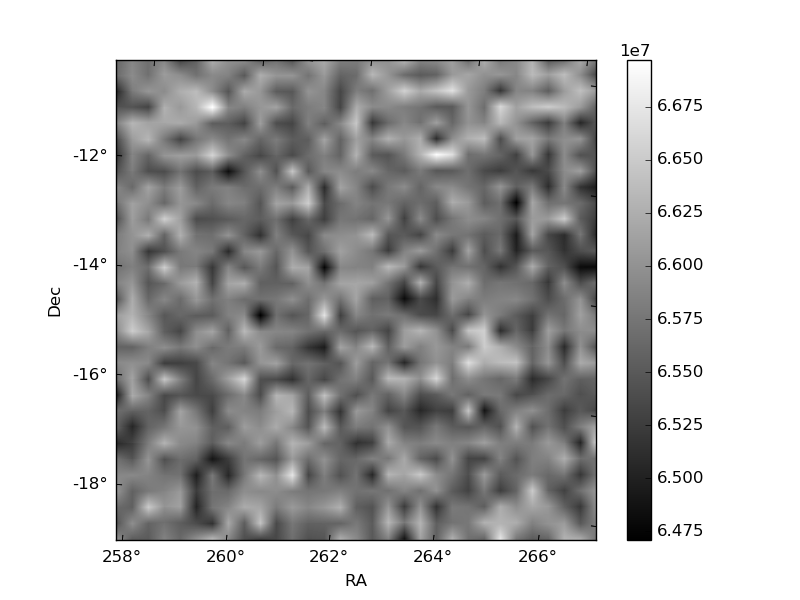
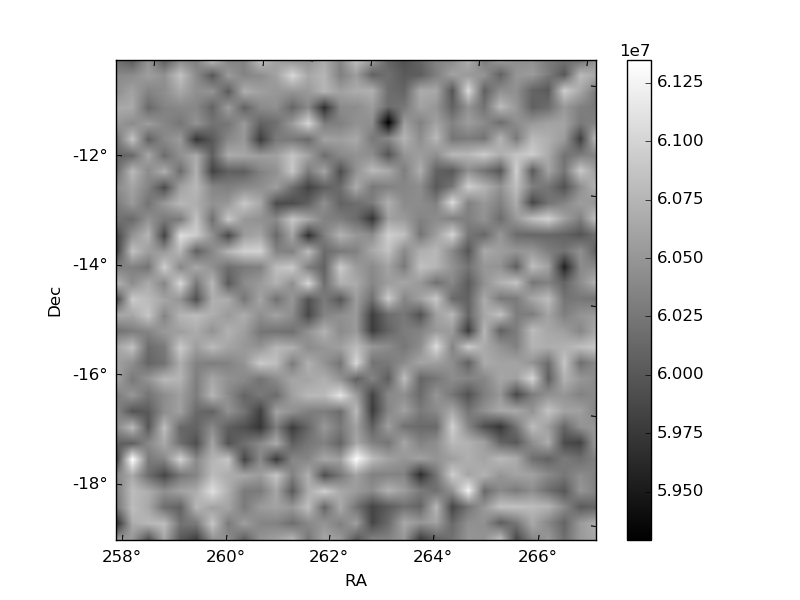
Histogram calculated using DETX and DETY for each event in the final _common_clean file
| Quadrant A | 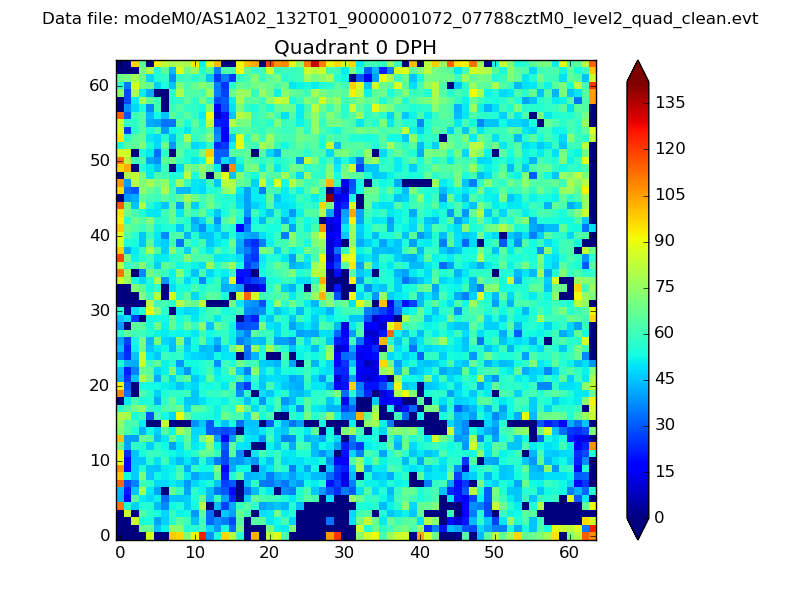 |
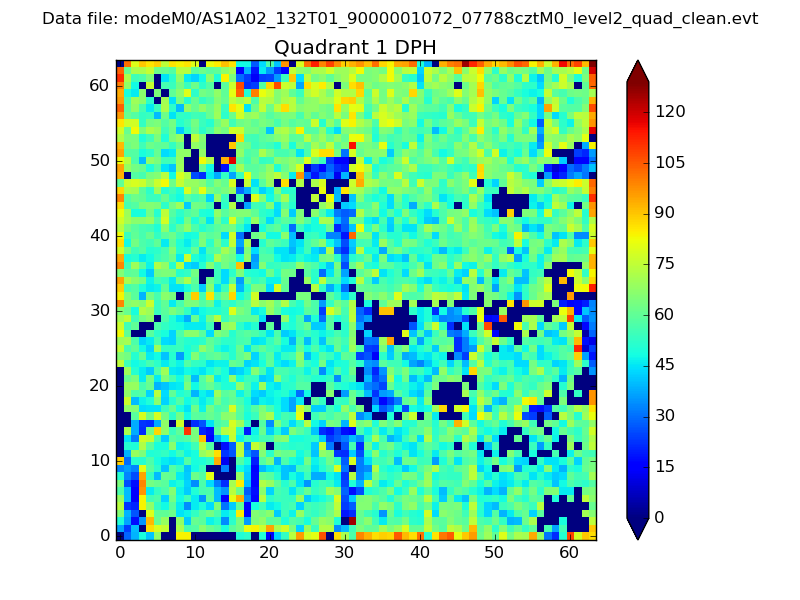 |
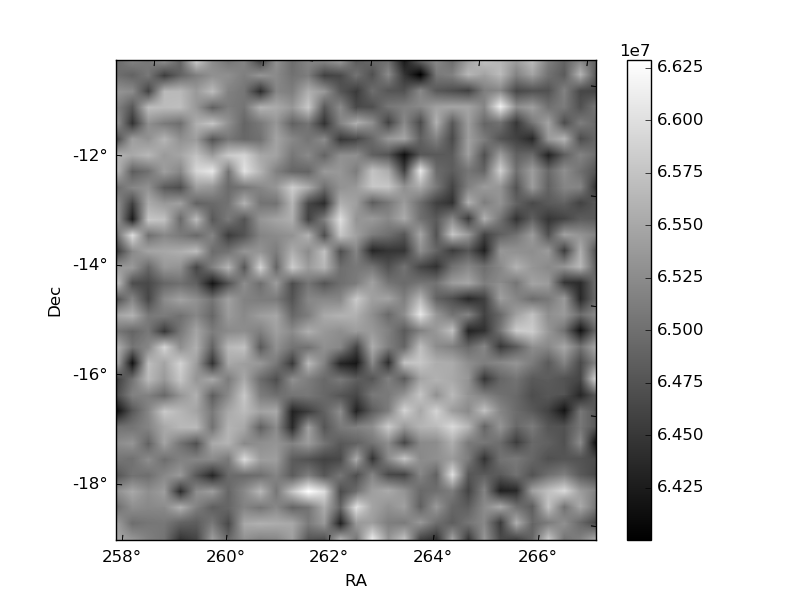
Quadrant B |
|---|---|---|---|
| Quadrant D | 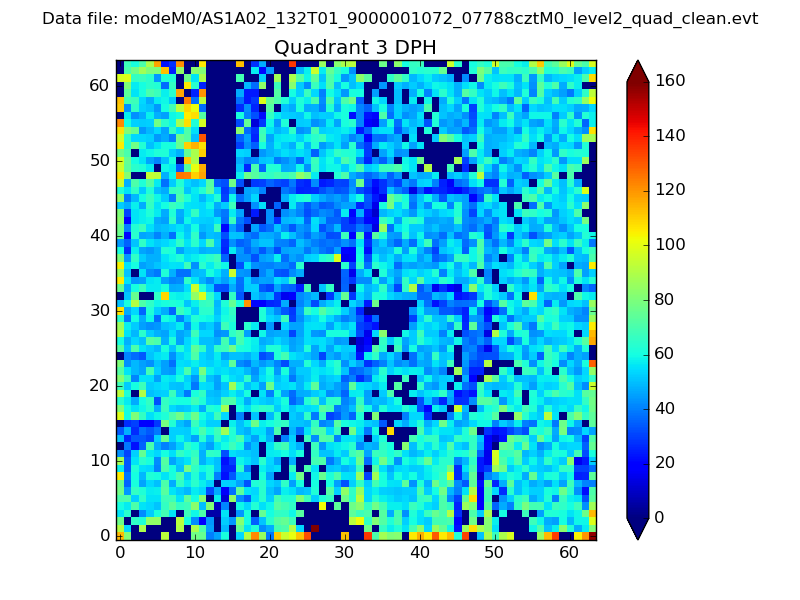 |
 |
Quadrant C |
| Plot type | Count rate plots | Images |
|---|---|---|
| Comparison with Poisson distribution Blue bars denote a histogram of data divided into 1 sec bins. Red curve is a Poisson curve with rate = median count rate of data. |
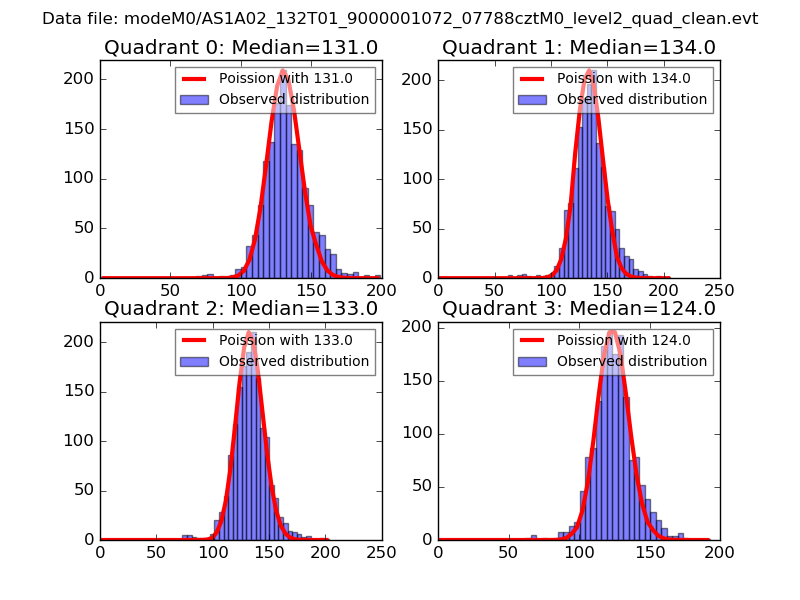 |
 |
| Quadrant-wise count rates Data is divided into 100 sec bins |
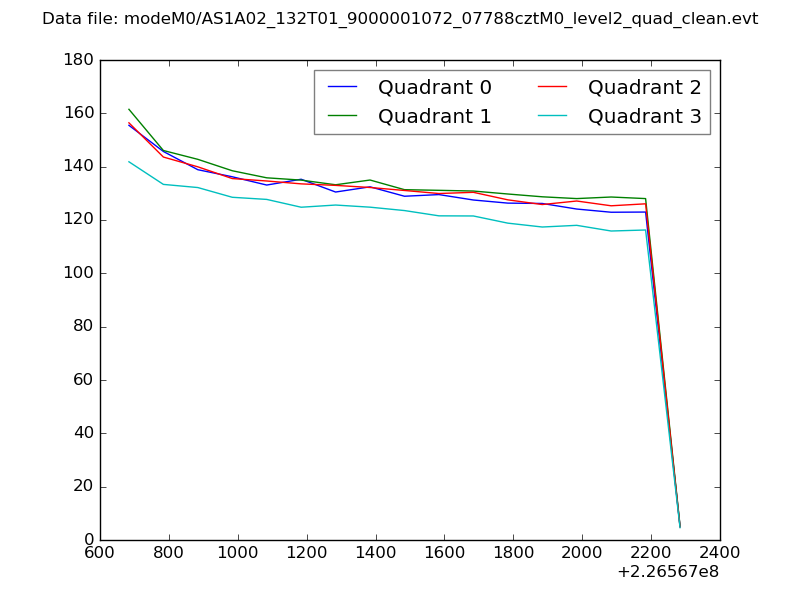 |
|
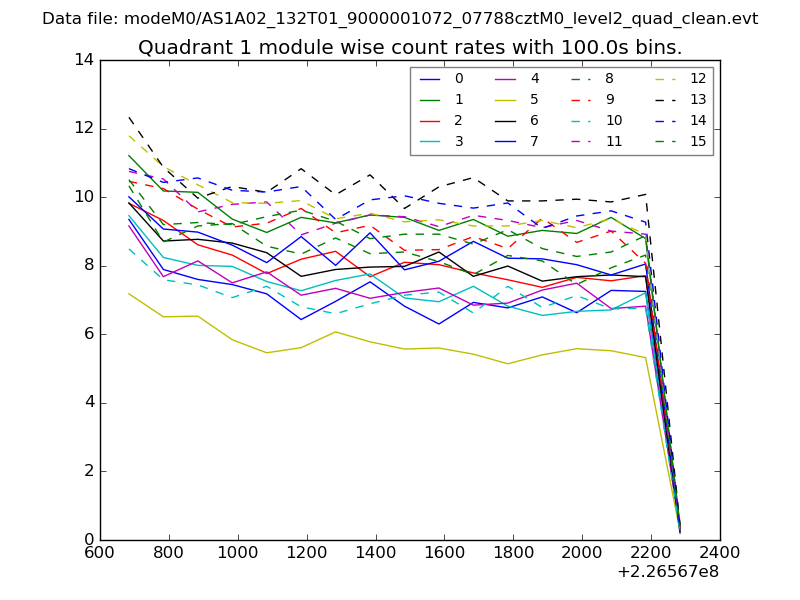
| Module-wise count rates for Quadrant A Data is divided into 100 sec bins |
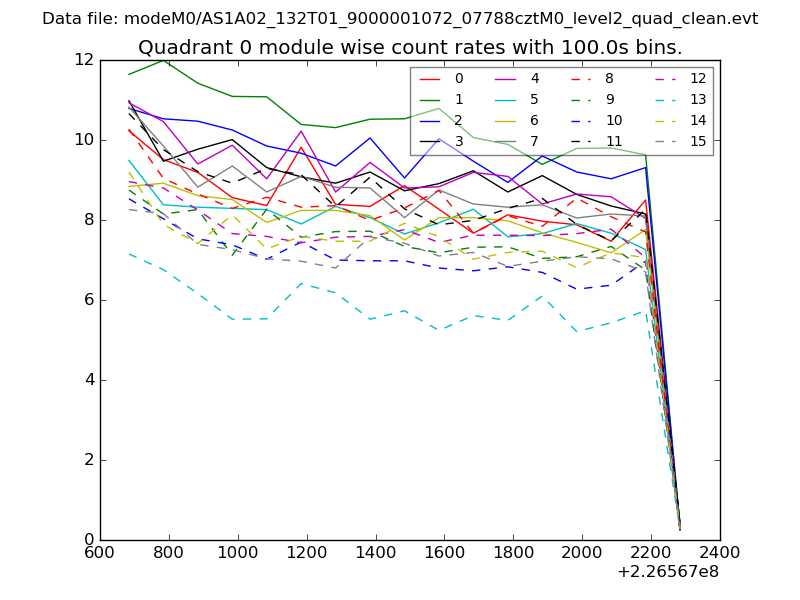 |
 |
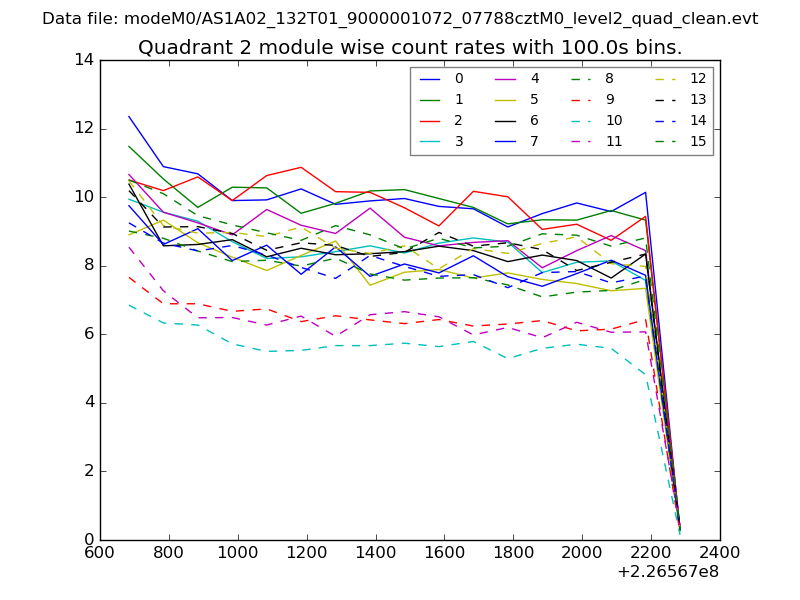
| Module-wise count rates for Quadrant B Data is divided into 100 sec bins |
 |
 |
| Module-wise count rates for Quadrant C Data is divided into 100 sec bins |
 |
 |
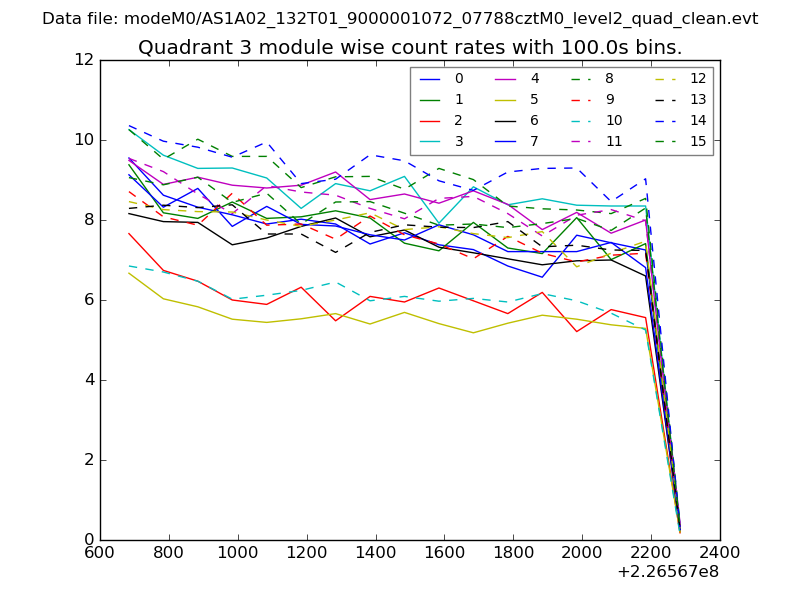
| Module-wise count rates for Quadrant D Data is divided into 100 sec bins |
 |
 |
| Parameter | Plot |
|---|---|
| CZT HV Monitor | 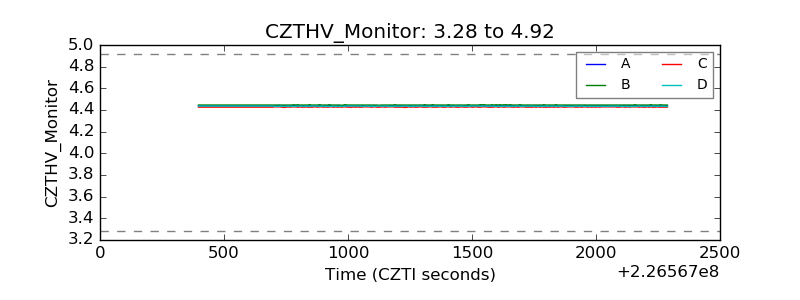 |
| D_VDD | 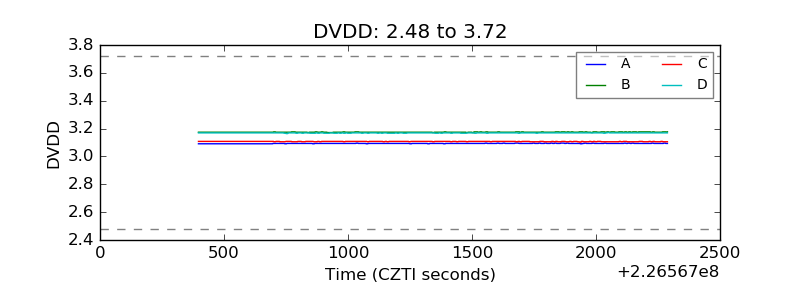 |
| Temperature 1 | 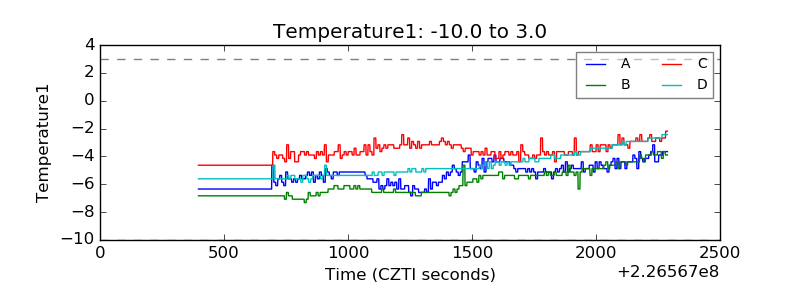 |
| Veto HV Monitor | 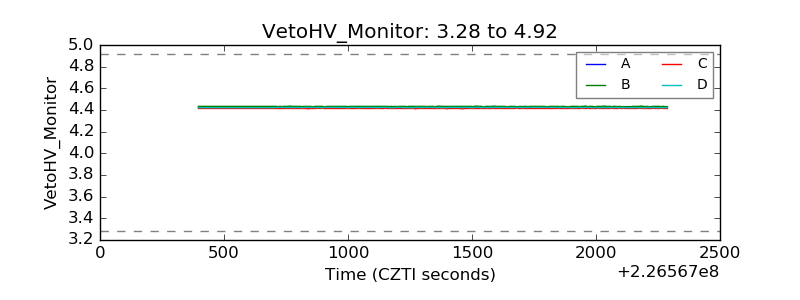 |
| Veto LLD | 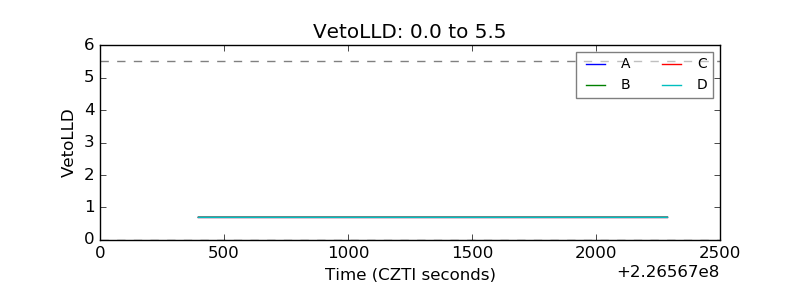 |
| Alpha Counter | 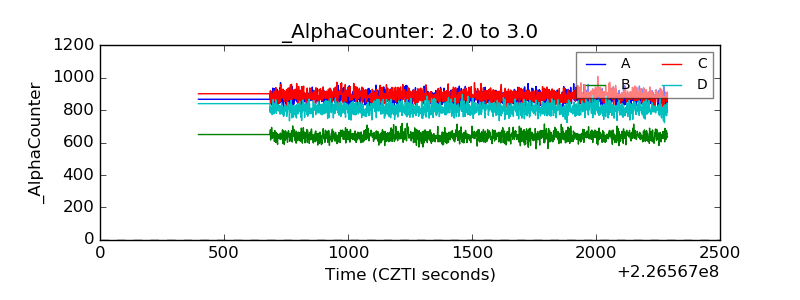 |
| _CPM_Rate | 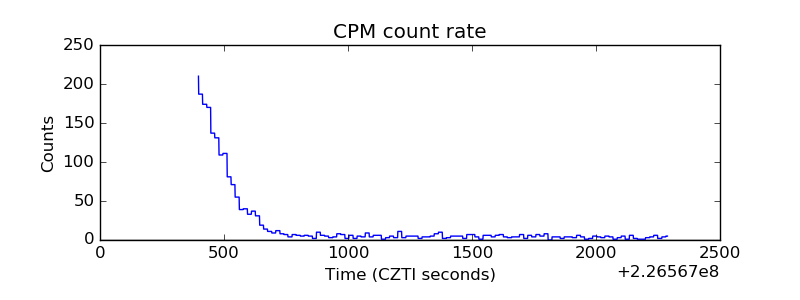 |
| CZT Counter | 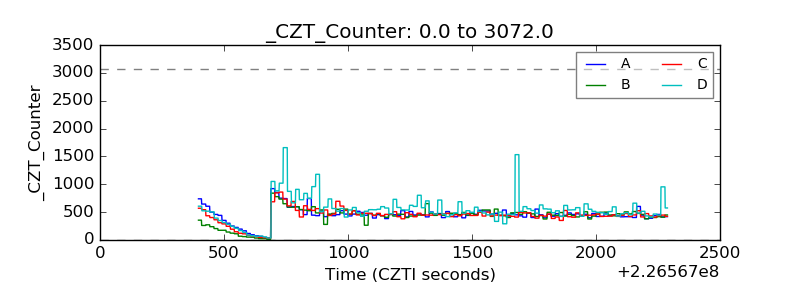 |
| +2.5 Volts monitor |  |
| +5 Volts monitor |  |
| _ROLL_ROT | 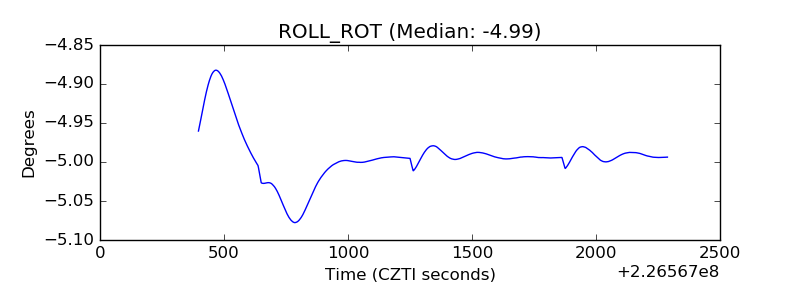 |
| _Roll_DEC | 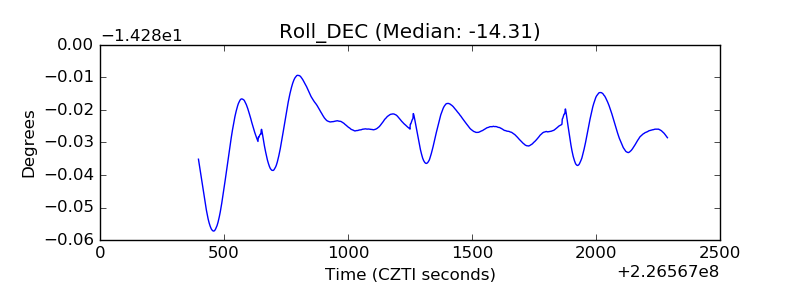 |
| _Roll_RA | 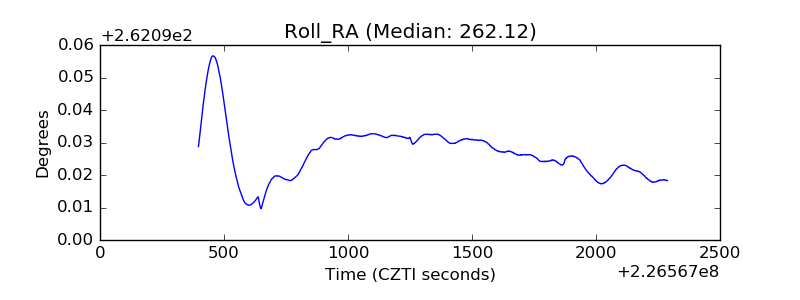 |
| Veto Counter | 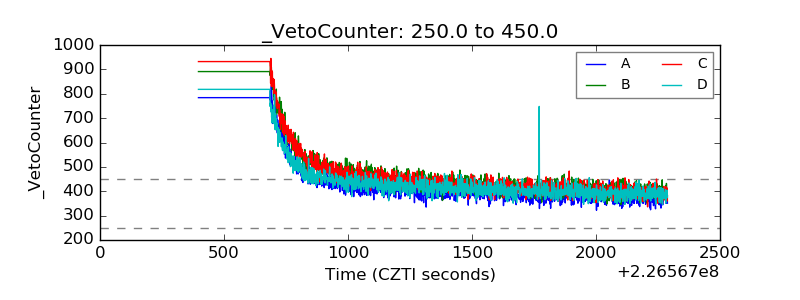 |