| Param | Original file | Final file |
|---|---|---|
| Filename | modeM0/AS1A02_132T01_9000001072_07790cztM0_level2.evt | modeM0/AS1A02_132T01_9000001072_07790cztM0_level2_quad_clean.evt |
| Size (bytes) | 497,975,040 | 89,784,000 |
| Size | 474.9 MB | 85.6 MB |
| Events in quadrant A | 3,341,499 | 555,069 |
| Events in quadrant B | 3,532,453 | 569,769 |
| Events in quadrant C | 3,319,147 | 565,465 |
| Events in quadrant D | 4,398,101 | 526,276 |
| Mode SS | |||
|---|---|---|---|
| Quadrant | BADHDUFLAG | Total packets | Discarded packets |
| A | 0 | 146 | 0 |
| B | 0 | 146 | 0 |
| C | 0 | 146 | 0 |
| D | 0 | 146 | 0 |
| Mode M0 | |||
|---|---|---|---|
| Quadrant | BADHDUFLAG | Total packets | Discarded packets |
| A | 0 | 14806 | 2 |
| B | 0 | 15028 | 1 |
| C | 0 | 14822 | 1 |
| D | 0 | 17723 | 1 |
| Mode M9 | |||
|---|---|---|---|
| Quadrant | BADHDUFLAG | Total packets | Discarded packets |
| A | 0 | 5 | 0 |
| B | 0 | 5 | 0 |
| C | 0 | 5 | 0 |
| D | 0 | 5 | 0 |
| Quadrant | Total seconds | Saturated seconds | Saturation percentage |
|---|---|---|---|
| A | 7209 | 185 | 2.566237% |
| B | 7209 | 191 | 2.649466% |
| C | 7209 | 136 | 1.886531% |
| D | 7209 | 301 | 4.175336% |
Noise dominated data is calculated using 1-second bins in cleaned event files. If a bin has >2000 counts, and if more than 50% of those come from <1% of pixels, then it is considered to be noise-dominated and hence unusable.
| Quadrant | # 1 sec bins | Bins with >0 counts | Bins with >2000 counts | High rate bins dominated by noise | Noise dominated (total time) | Noise dominated (detector-on time) | Marked lightcurve |
|---|---|---|---|---|---|---|---|
| A | 7654 | 7209 | 0 | 0 | 0.00% | 0.00% |  |
| B | 7654 | 7209 | 1 | 1 | 0.01% | 0.01% | 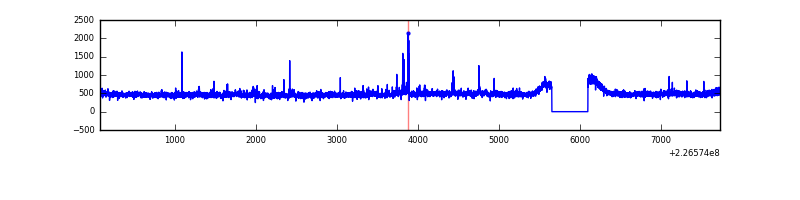 |
| C | 7654 | 7209 | 0 | 0 | 0.00% | 0.00% | 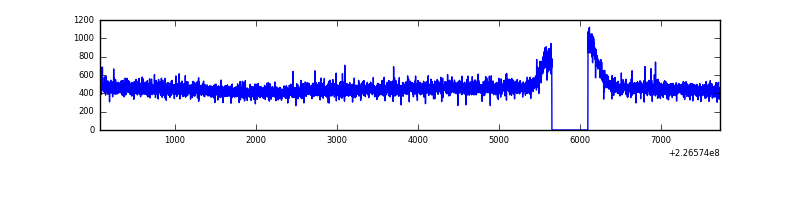 |
| D | 7654 | 7209 | 106 | 106 | 1.38% | 1.47% | 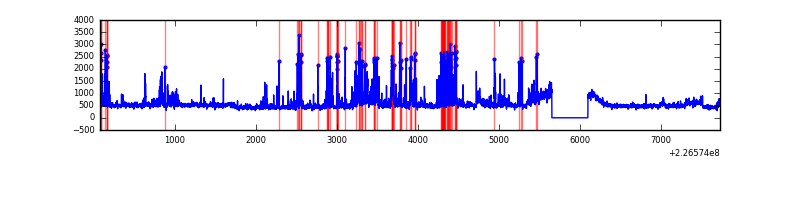 |
Top three noisy pixels from each quadrant. If the there are fewer than three noisy pixels in the level2.evt file, extra rows are filled as -1
| Pixel properties | Quadrant properties | ||||||
|---|---|---|---|---|---|---|---|
| Quadrant | DetID | PixID | Counts | Sigma | Mean | Median | Sigma |
| A | 0 | 226 | 8170 | 40.95 | 867 | 846 | 178.8 |
| A | 12 | 194 | 7588 | 37.7 | 867 | 846 | 178.8 |
| A | 15 | 174 | 4930 | 22.84 | 867 | 846 | 178.8 |
| B | 0 | 219 | 66643 | 393.75 | 868 | 847 | 167.1 |
| B | 4 | 239 | 29115 | 169.17 | 868 | 847 | 167.1 |
| B | 0 | 214 | 18411 | 105.11 | 868 | 847 | 167.1 |
| C | 13 | 61 | 6470 | 28.33 | 849 | 851 | 198.4 |
| C | 1 | 16 | 5868 | 25.29 | 849 | 851 | 198.4 |
| C | 10 | 22 | 3058 | 11.12 | 849 | 851 | 198.4 |
| D | 1 | 52 | 457908 | 2203.56 | 840 | 813 | 207.4 |
| D | 13 | 104 | 320086 | 1539.15 | 840 | 813 | 207.4 |
| D | 2 | 152 | 277087 | 1331.86 | 840 | 813 | 207.4 |
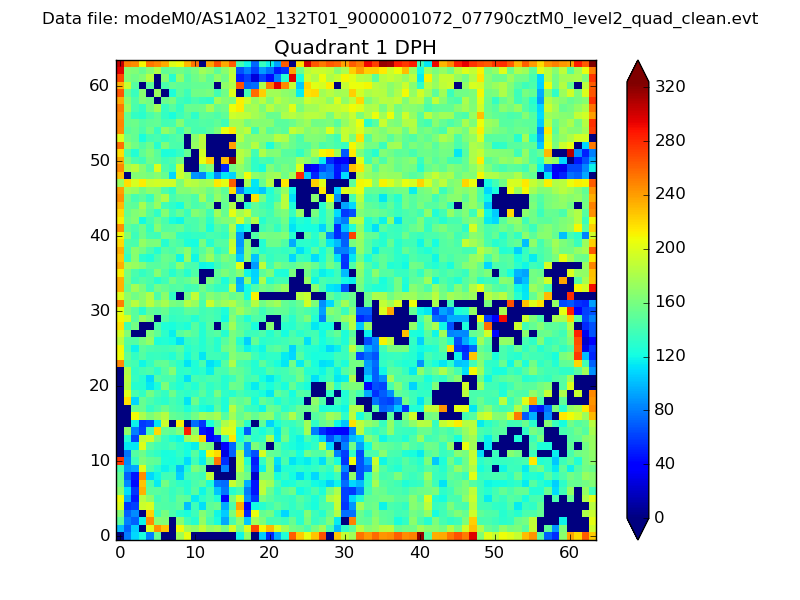
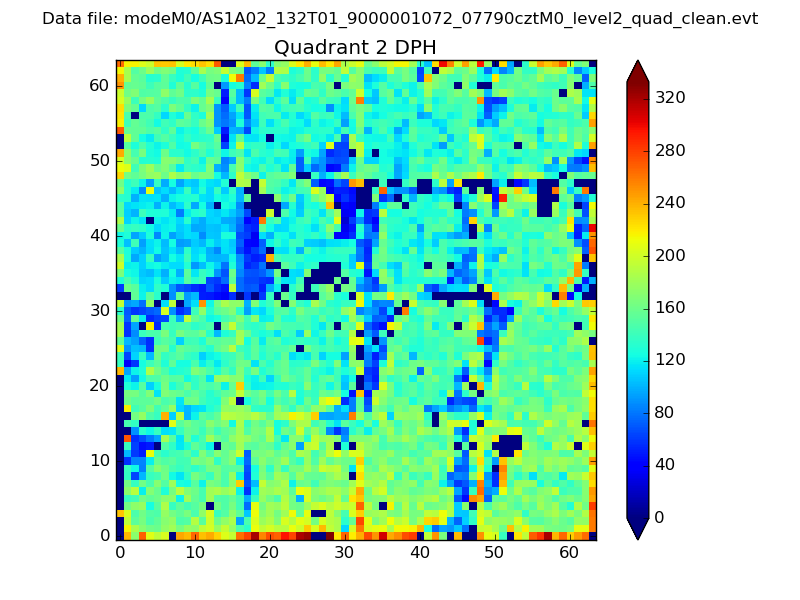
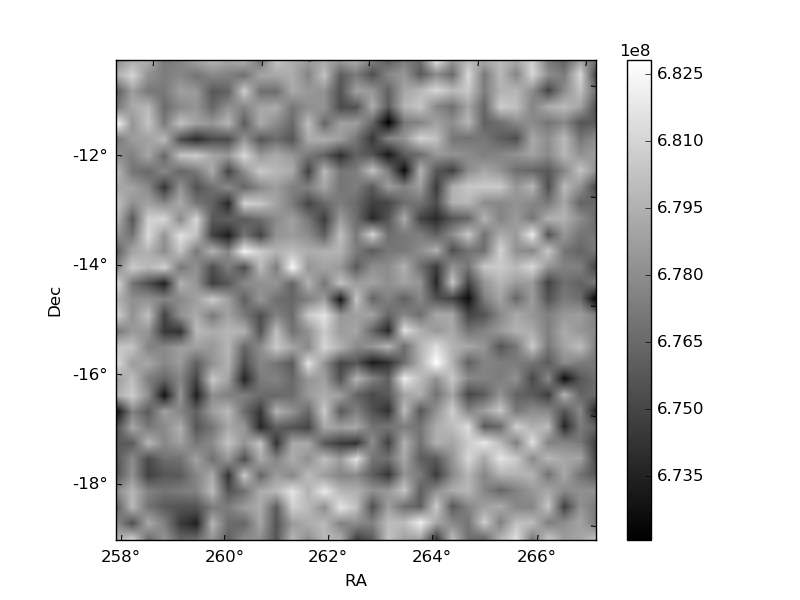
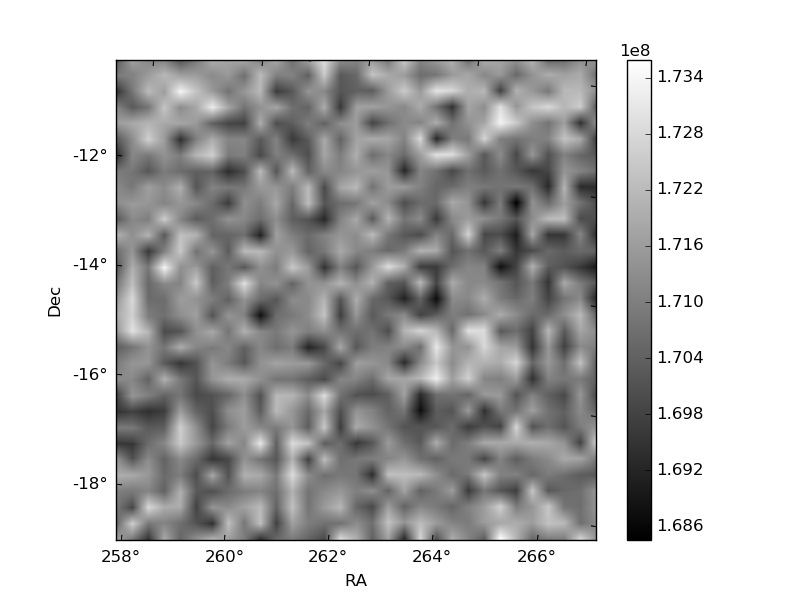
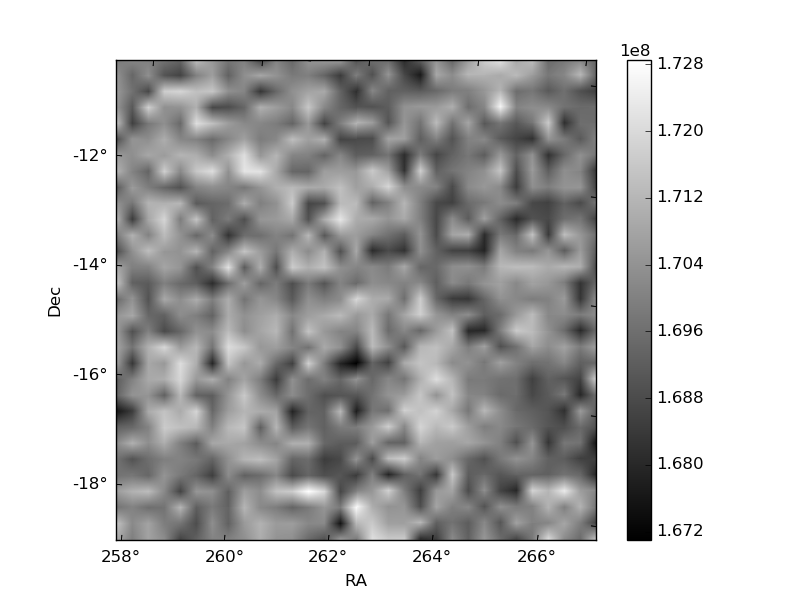
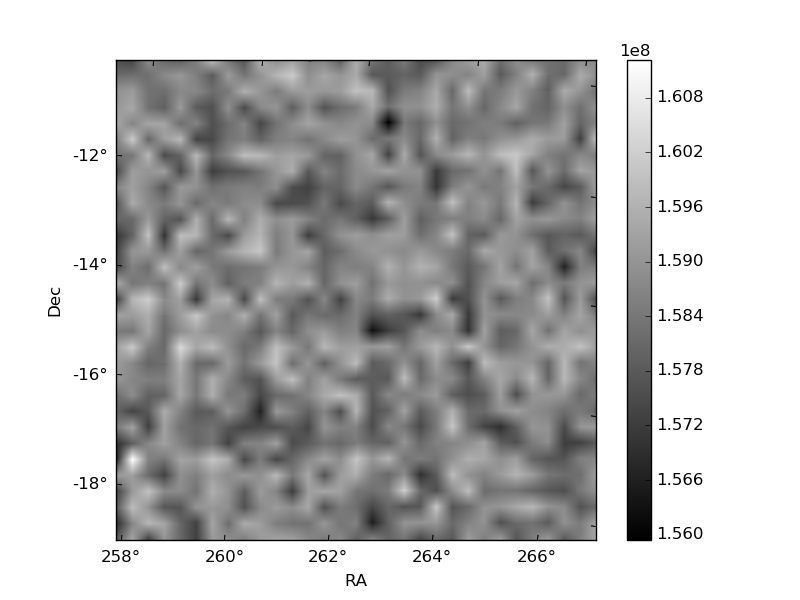
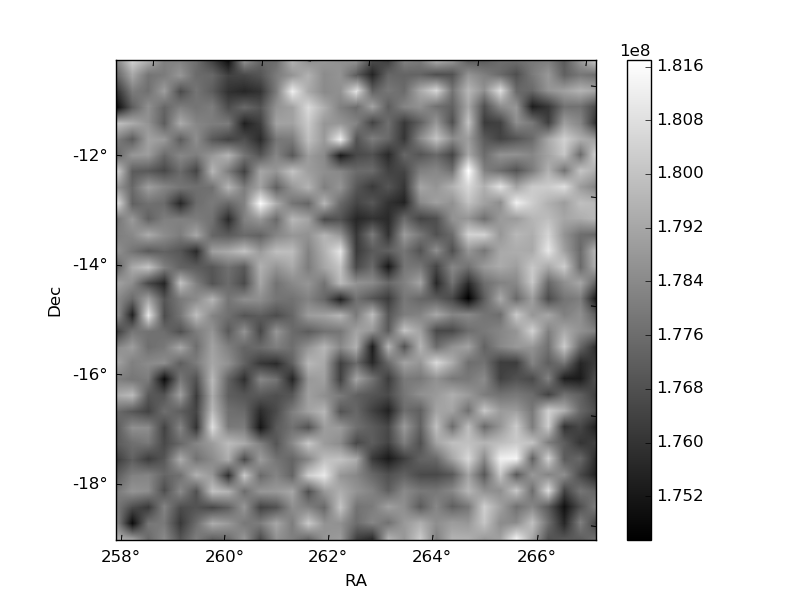
Histogram calculated using DETX and DETY for each event in the final _common_clean file
| Quadrant A | 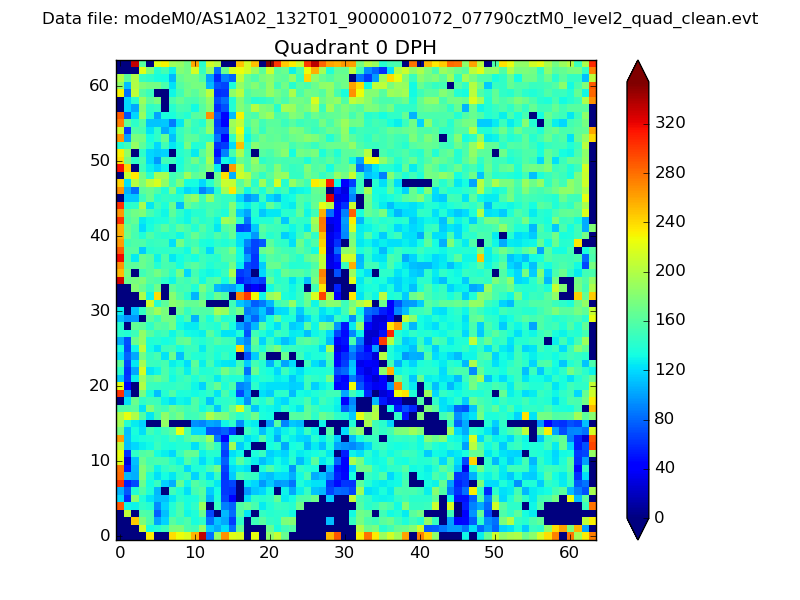 |
 |
Quadrant B |
|---|---|---|---|
| Quadrant D | 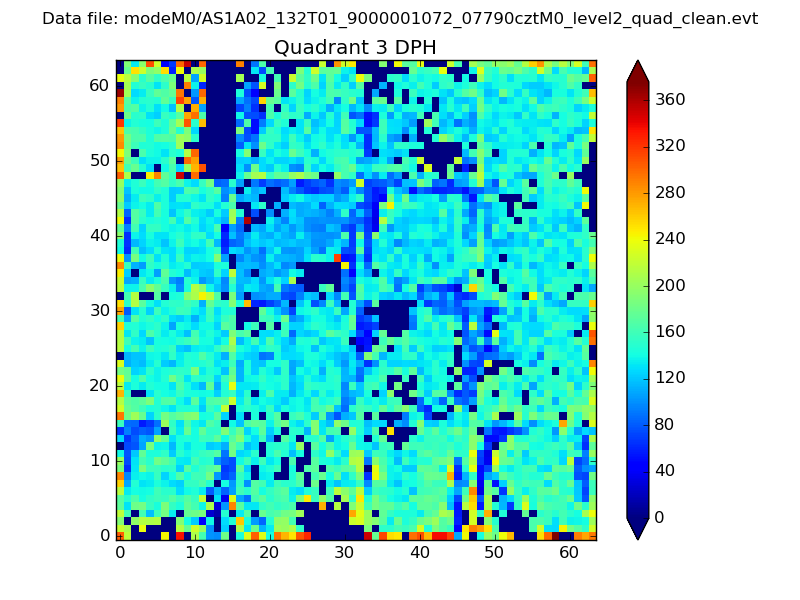 |
 |
Quadrant C |
| Plot type | Count rate plots | Images |
|---|---|---|
| Comparison with Poisson distribution Blue bars denote a histogram of data divided into 1 sec bins. Red curve is a Poisson curve with rate = median count rate of data. |
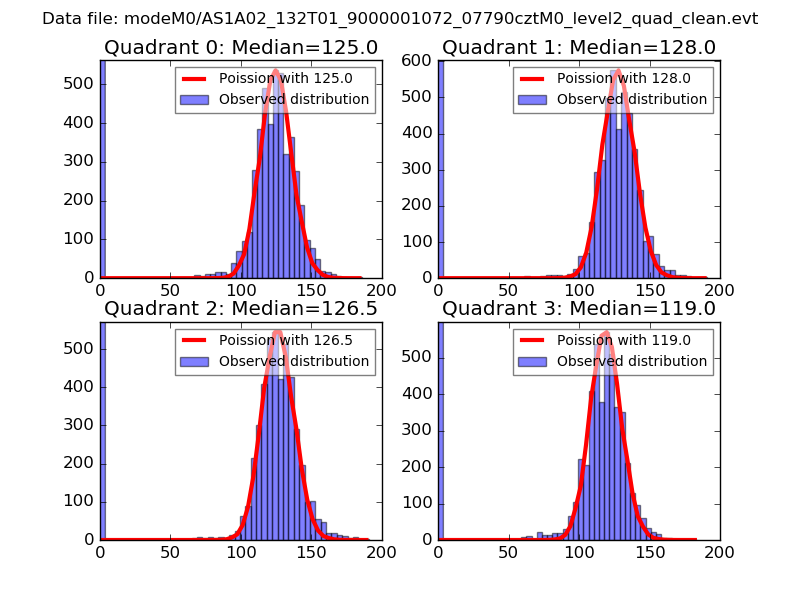 |
 |
| Quadrant-wise count rates Data is divided into 100 sec bins |
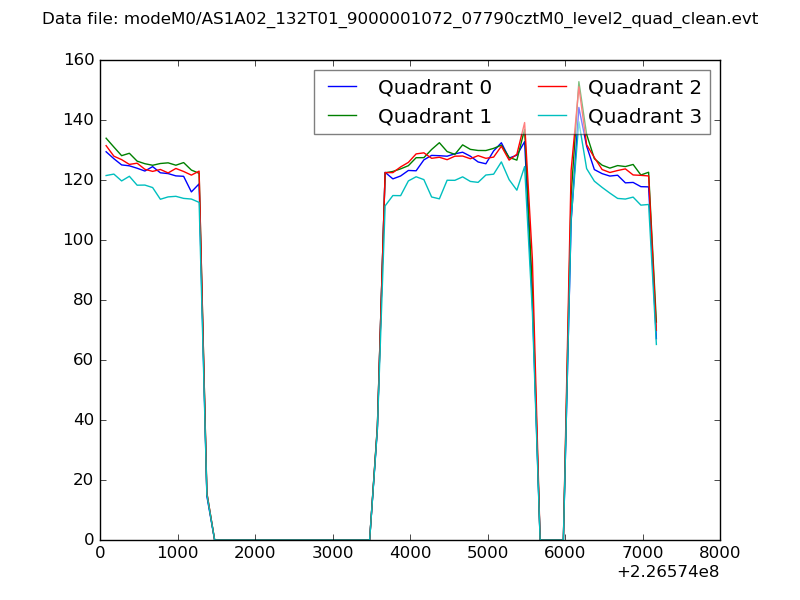 |
|
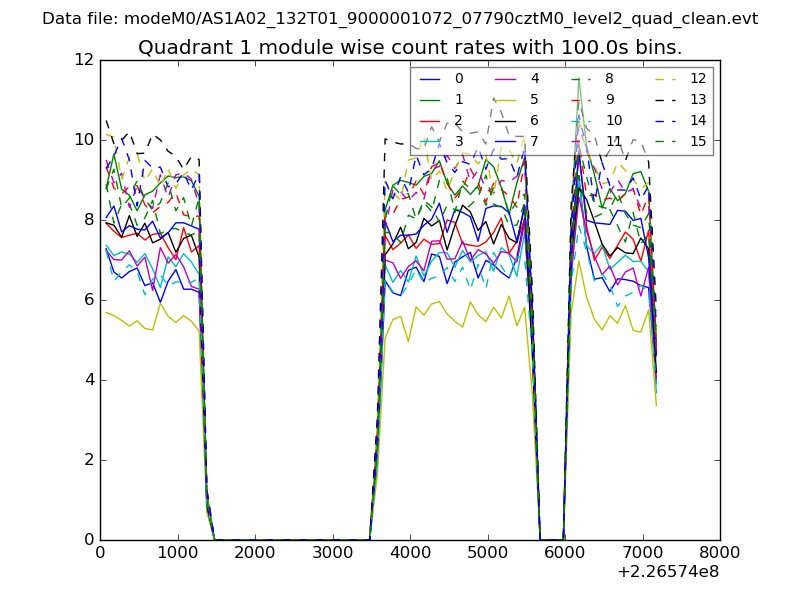
| Module-wise count rates for Quadrant A Data is divided into 100 sec bins |
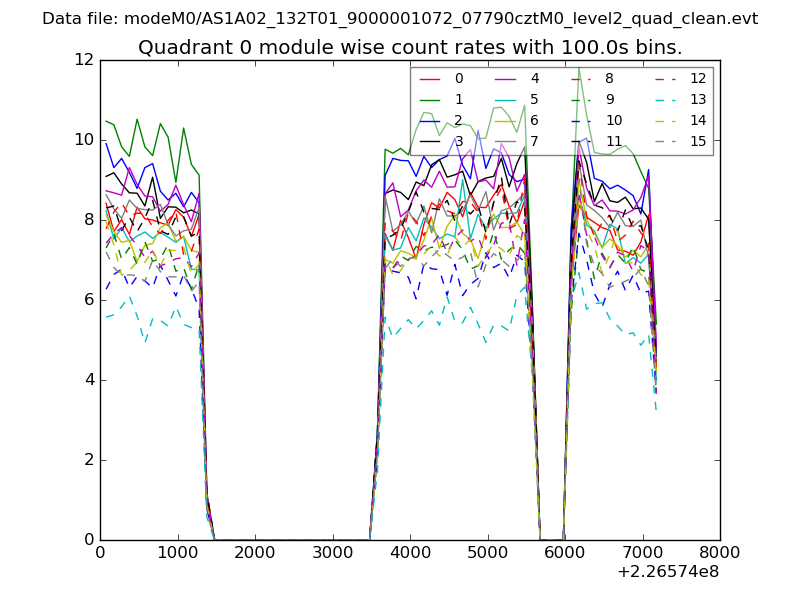 |
 |
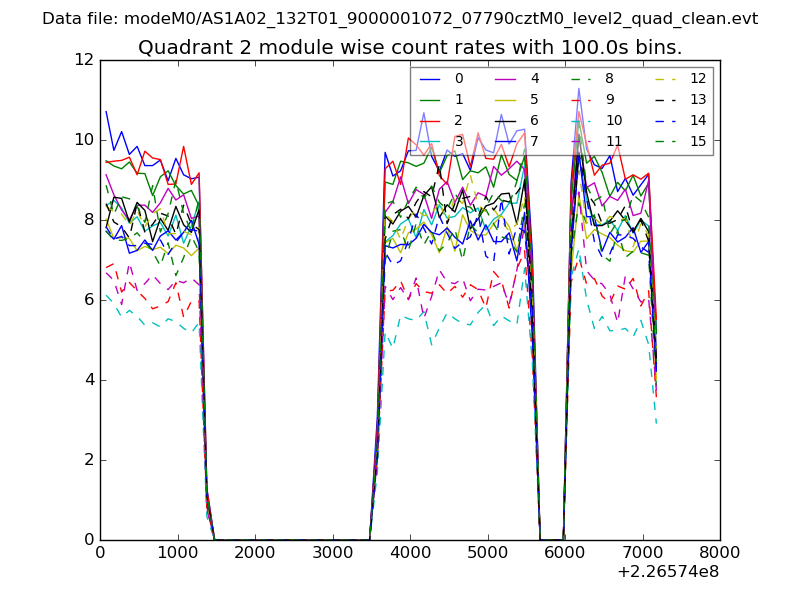
| Module-wise count rates for Quadrant B Data is divided into 100 sec bins |
 |
 |
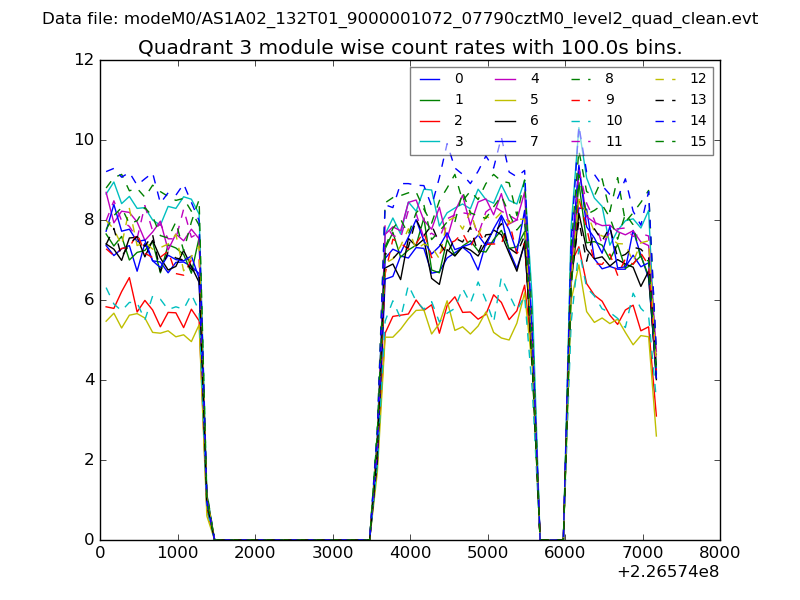
| Module-wise count rates for Quadrant C Data is divided into 100 sec bins |
 |
 |
| Module-wise count rates for Quadrant D Data is divided into 100 sec bins |
 |
 |
| Parameter | Plot |
|---|---|
| CZT HV Monitor | 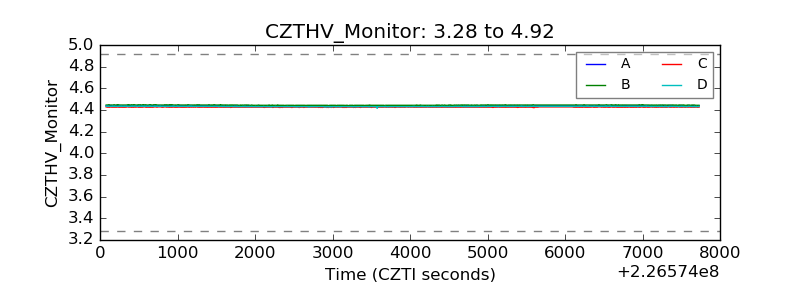 |
| D_VDD | 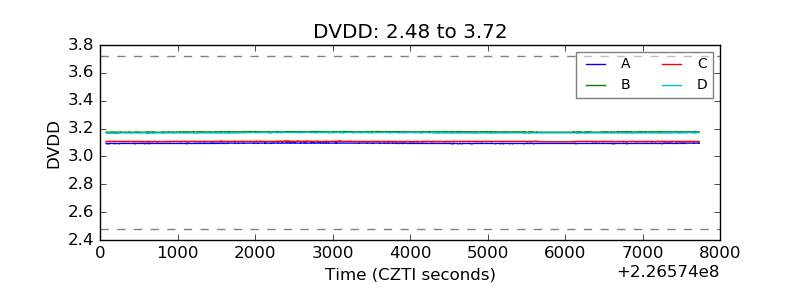 |
| Temperature 1 | 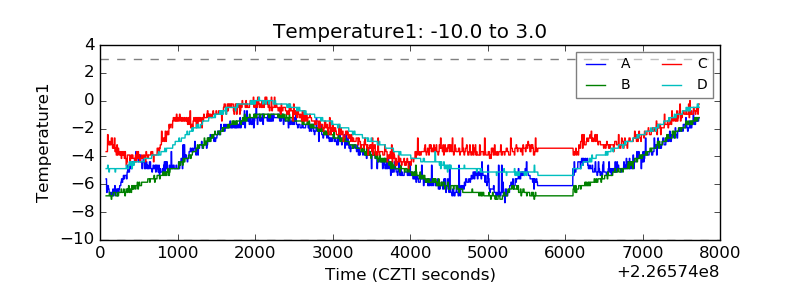 |
| Veto HV Monitor | 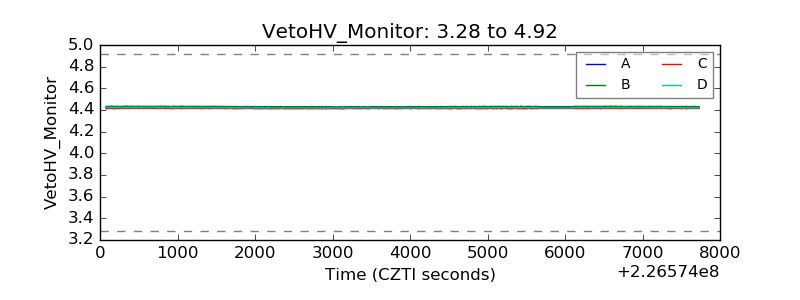 |
| Veto LLD | 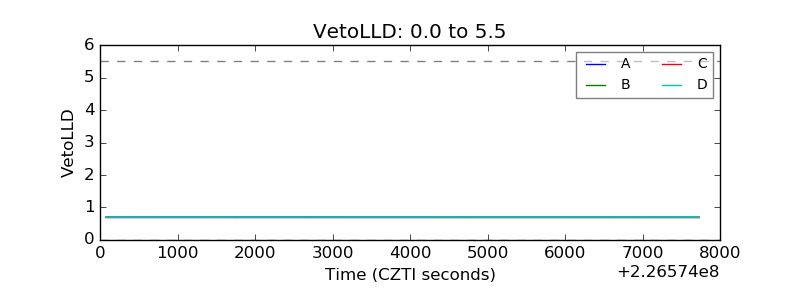 |
| Alpha Counter | 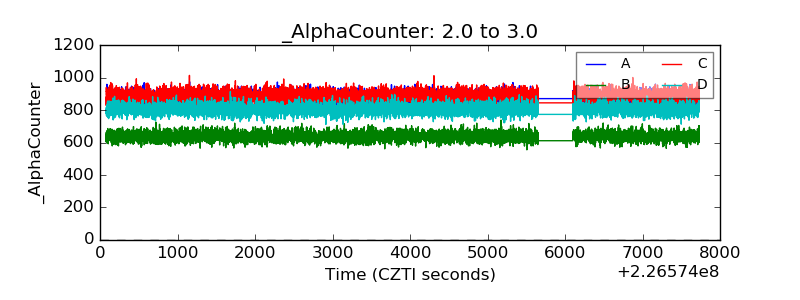 |
| _CPM_Rate | 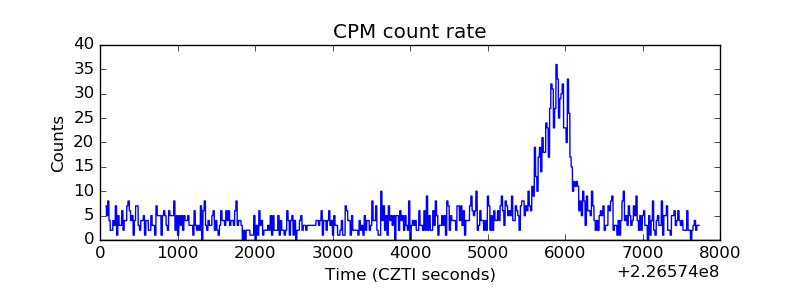 |
| CZT Counter | 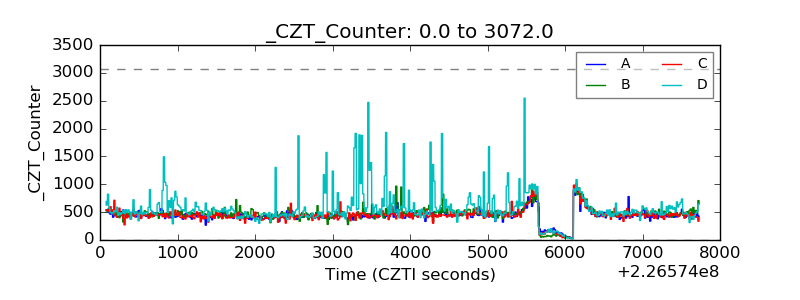 |
| +2.5 Volts monitor |  |
| +5 Volts monitor |  |
| _ROLL_ROT | 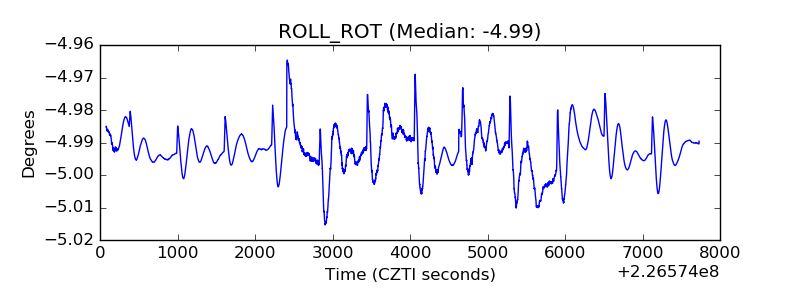 |
| _Roll_DEC | 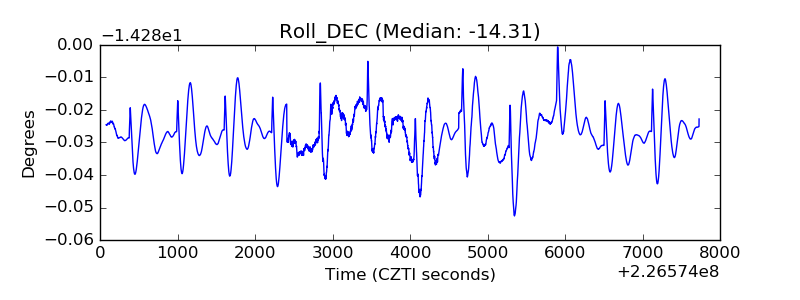 |
| _Roll_RA | 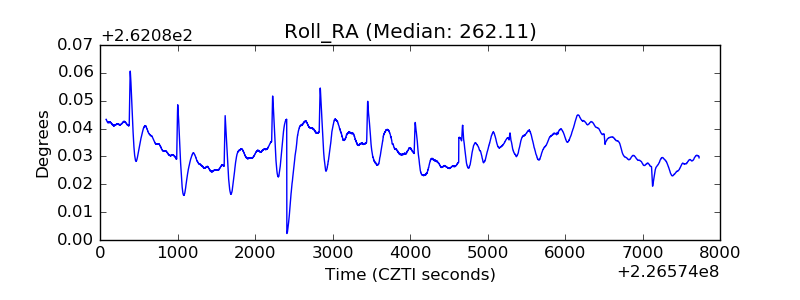 |
| Veto Counter | 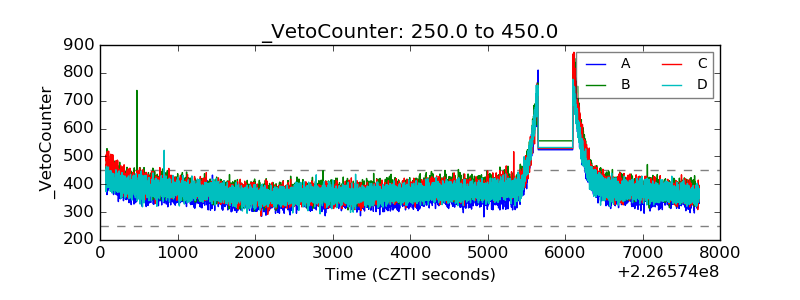 |