| Param | Original file | Final file |
|---|---|---|
| Filename | modeM0/AS1A02_132T01_9000001072_07795cztM0_level2.evt | modeM0/AS1A02_132T01_9000001072_07795cztM0_level2_quad_clean.evt |
| Size (bytes) | 626,832,000 | 104,402,880 |
| Size | 597.8 MB | 99.6 MB |
| Events in quadrant A | 4,219,925 | 628,941 |
| Events in quadrant B | 4,470,461 | 636,486 |
| Events in quadrant C | 4,652,886 | 632,959 |
| Events in quadrant D | 4,998,377 | 607,075 |
| Mode SS | |||
|---|---|---|---|
| Quadrant | BADHDUFLAG | Total packets | Discarded packets |
| A | 0 | 194 | 2 |
| B | 0 | 194 | 2 |
| C | 0 | 194 | 4 |
| D | 0 | 194 | 0 |
| Mode M0 | |||
|---|---|---|---|
| Quadrant | BADHDUFLAG | Total packets | Discarded packets |
| A | 0 | 19413 | 226 |
| B | 0 | 19816 | 261 |
| C | 0 | 20696 | 277 |
| D | 0 | 21889 | 308 |
| Mode M9 | |||
|---|---|---|---|
| Quadrant | BADHDUFLAG | Total packets | Discarded packets |
| A | 0 | 4 | 0 |
| B | 0 | 4 | 0 |
| C | 0 | 4 | 0 |
| D | 0 | 4 | 0 |
| Quadrant | Total seconds | Saturated seconds | Saturation percentage |
|---|---|---|---|
| A | 9460 | 64 | 0.676533% |
| B | 9448 | 72 | 0.762066% |
| C | 9451 | 125 | 1.322611% |
| D | 9458 | 117 | 1.237048% |
Noise dominated data is calculated using 1-second bins in cleaned event files. If a bin has >2000 counts, and if more than 50% of those come from <1% of pixels, then it is considered to be noise-dominated and hence unusable.
| Quadrant | # 1 sec bins | Bins with >0 counts | Bins with >2000 counts | High rate bins dominated by noise | Noise dominated (total time) | Noise dominated (detector-on time) | Marked lightcurve |
|---|---|---|---|---|---|---|---|
| A | 10017 | 9568 | 0 | 0 | 0.00% | 0.00% | 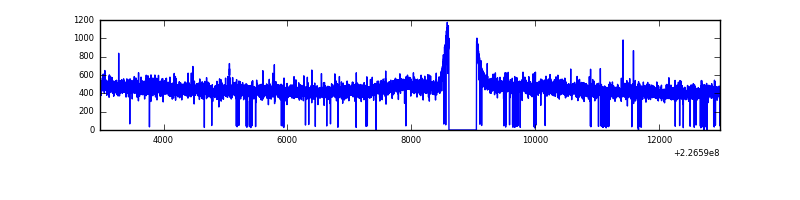 |
| B | 10017 | 9564 | 4 | 4 | 0.04% | 0.04% | 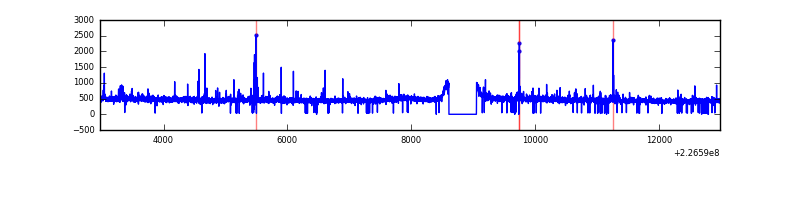 |
| C | 10017 | 9569 | 79 | 79 | 0.79% | 0.83% | 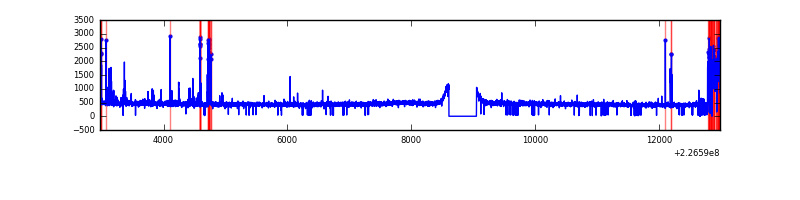 |
| D | 10017 | 9559 | 57 | 57 | 0.57% | 0.60% | 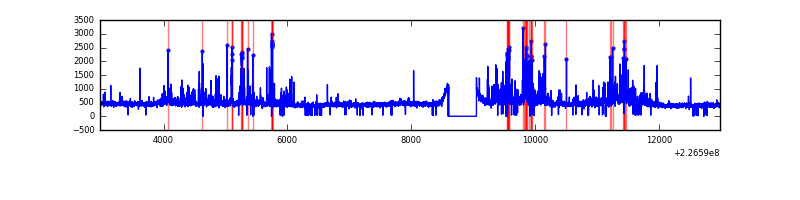 |
Top three noisy pixels from each quadrant. If the there are fewer than three noisy pixels in the level2.evt file, extra rows are filled as -1
| Pixel properties | Quadrant properties | ||||||
|---|---|---|---|---|---|---|---|
| Quadrant | DetID | PixID | Counts | Sigma | Mean | Median | Sigma |
| A | 0 | 226 | 10309 | 41.01 | 1095 | 1071 | 225.3 |
| A | 12 | 194 | 9499 | 37.42 | 1095 | 1071 | 225.3 |
| A | 13 | 14 | 5881 | 21.35 | 1095 | 1071 | 225.3 |
| B | 4 | 239 | 60219 | 278.75 | 1101 | 1075 | 212.2 |
| B | 0 | 214 | 48887 | 225.34 | 1101 | 1075 | 212.2 |
| B | 4 | 173 | 23817 | 107.19 | 1101 | 1075 | 212.2 |
| C | 9 | 68 | 294062 | 1174.48 | 1065 | 1070 | 249.5 |
| C | 4 | 254 | 162678 | 647.82 | 1065 | 1070 | 249.5 |
| C | 1 | 16 | 16851 | 63.26 | 1065 | 1070 | 249.5 |
| D | 2 | 152 | 616944 | 2356.16 | 1063 | 1031 | 261.4 |
| D | 13 | 104 | 139555 | 529.92 | 1063 | 1031 | 261.4 |
| D | 2 | 14 | 108881 | 412.58 | 1063 | 1031 | 261.4 |
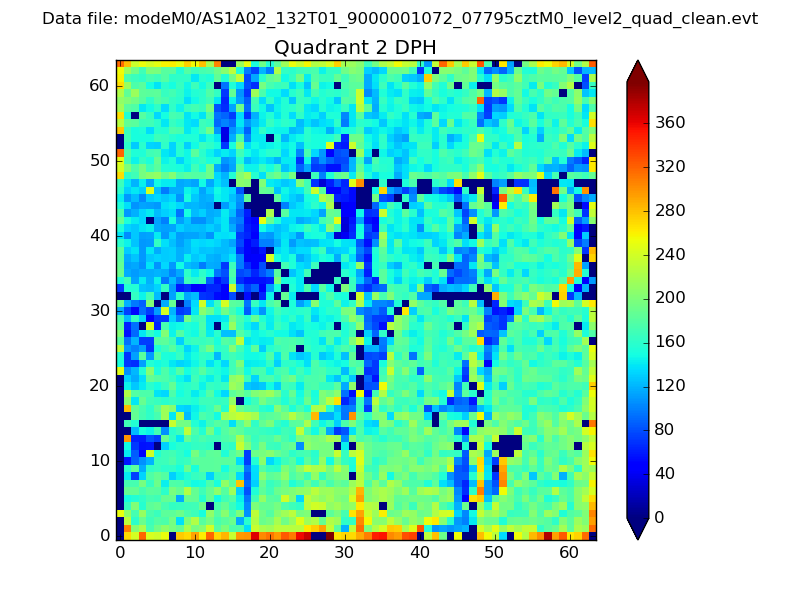
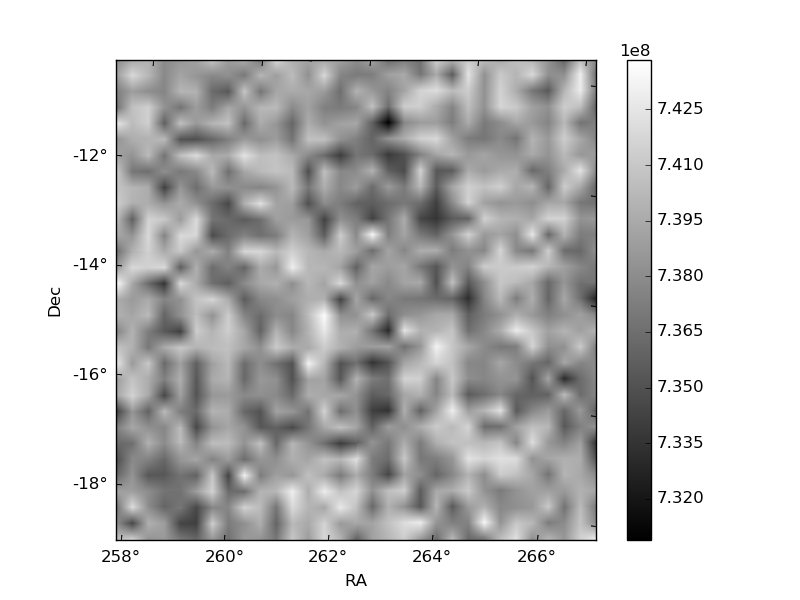
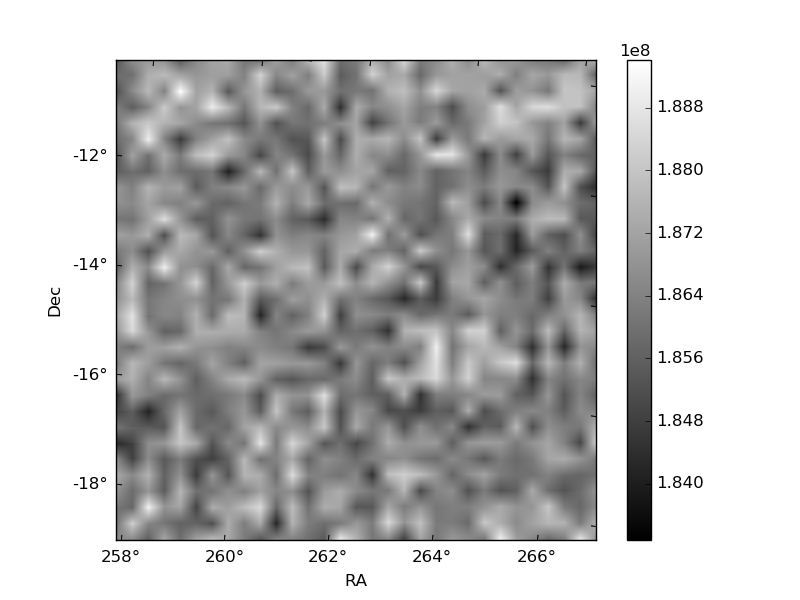
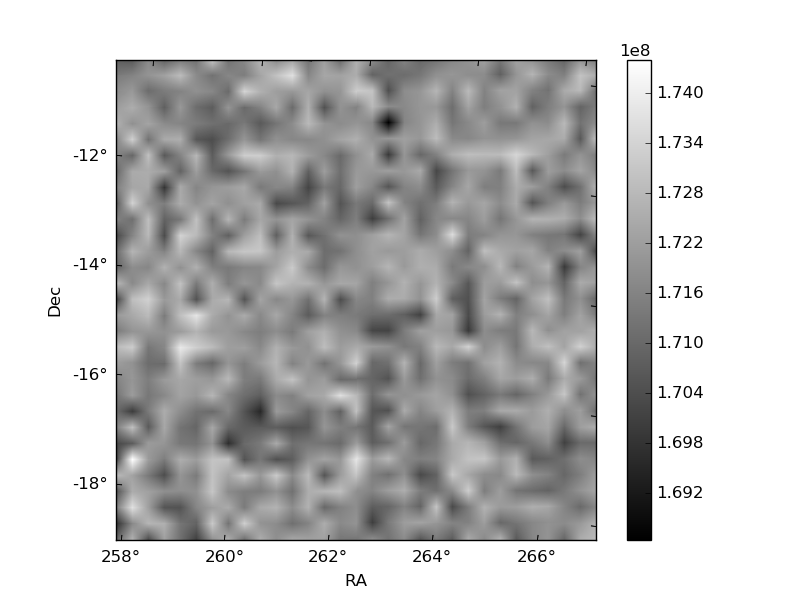
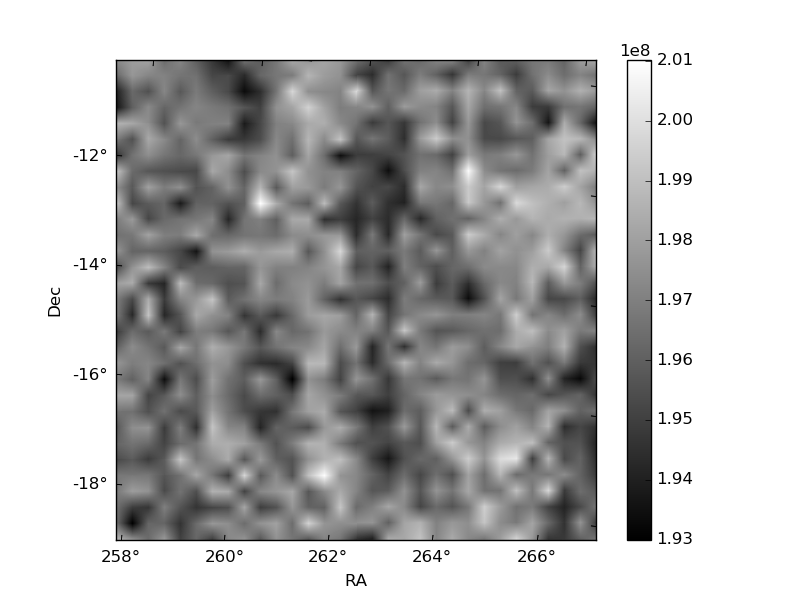
Histogram calculated using DETX and DETY for each event in the final _common_clean file
| Quadrant A | 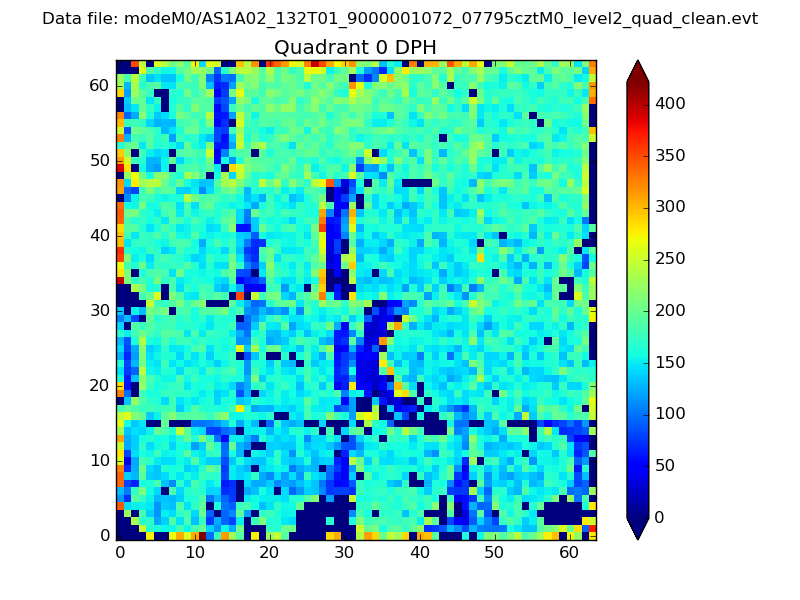 |
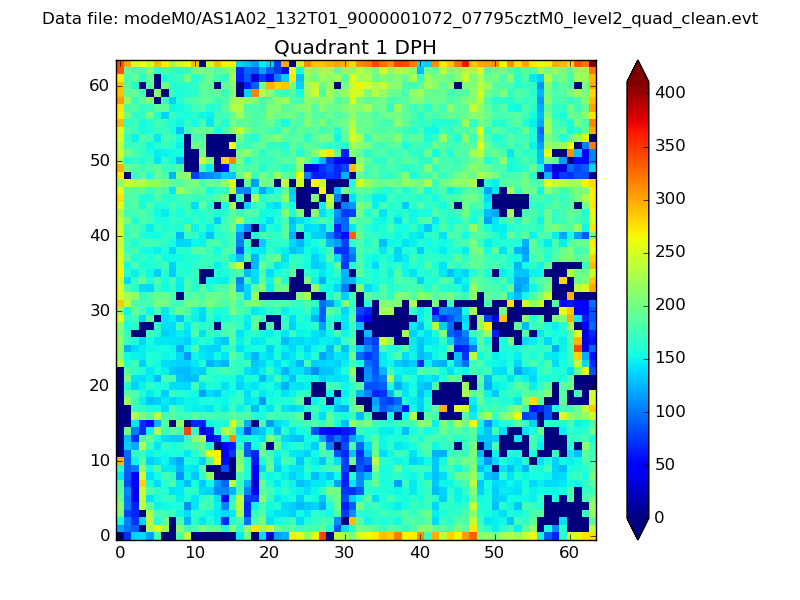 |
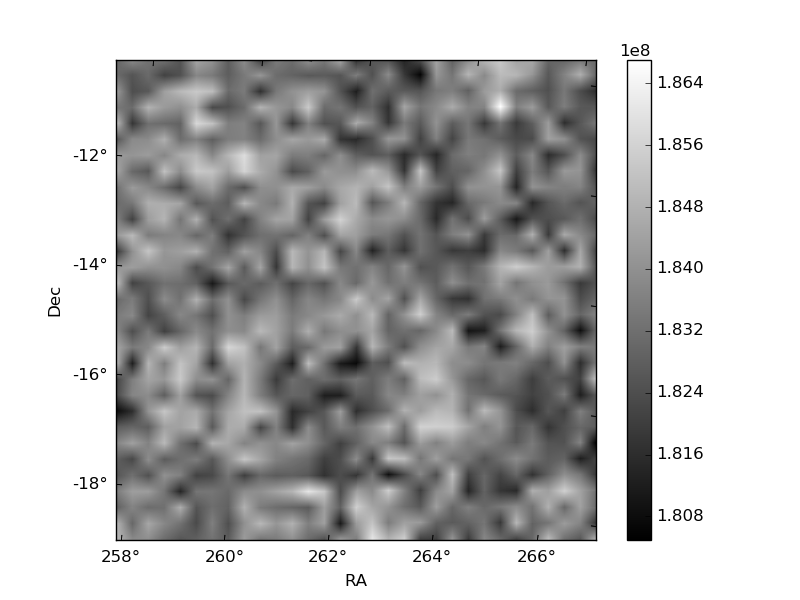
Quadrant B |
|---|---|---|---|
| Quadrant D | 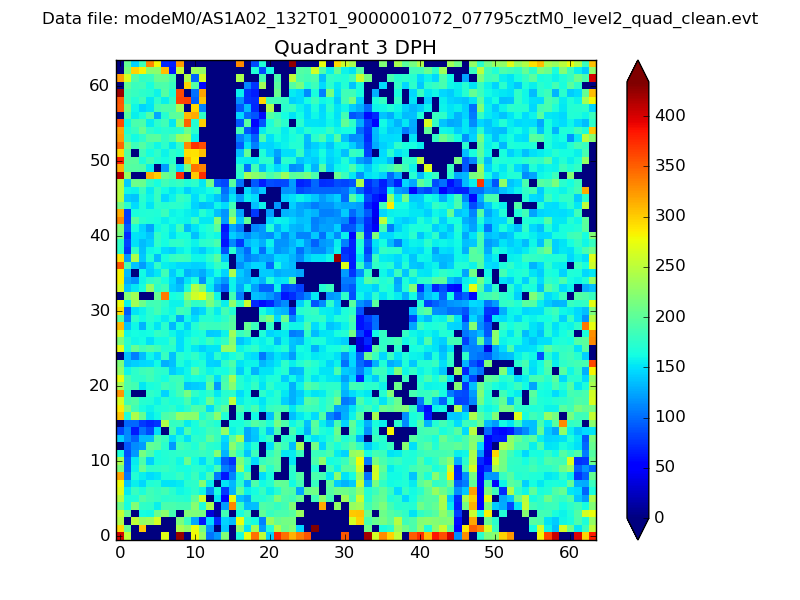 |
 |
Quadrant C |
| Plot type | Count rate plots | Images |
|---|---|---|
| Comparison with Poisson distribution Blue bars denote a histogram of data divided into 1 sec bins. Red curve is a Poisson curve with rate = median count rate of data. |
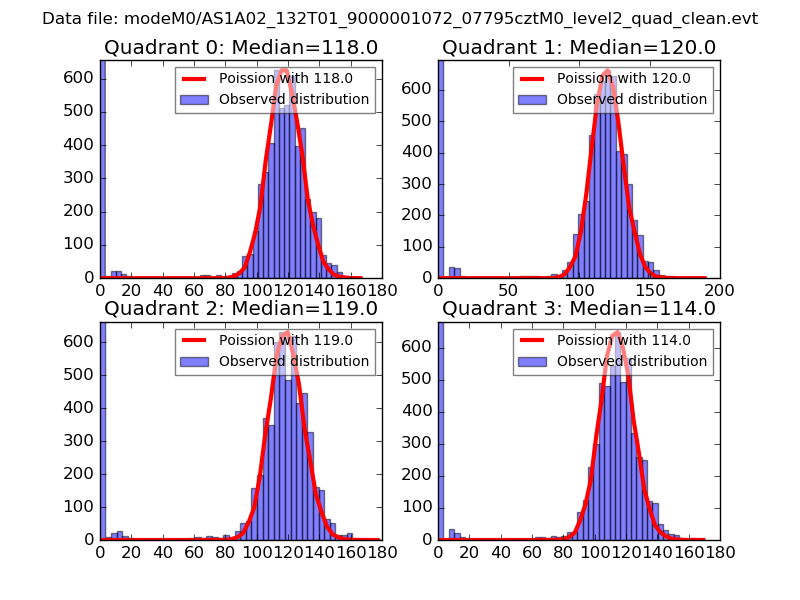 |
 |
| Quadrant-wise count rates Data is divided into 100 sec bins |
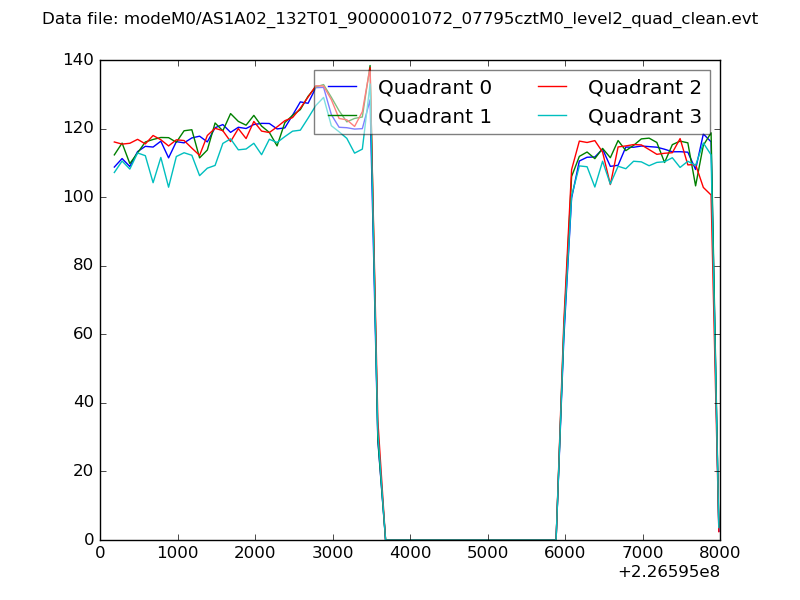 |
|
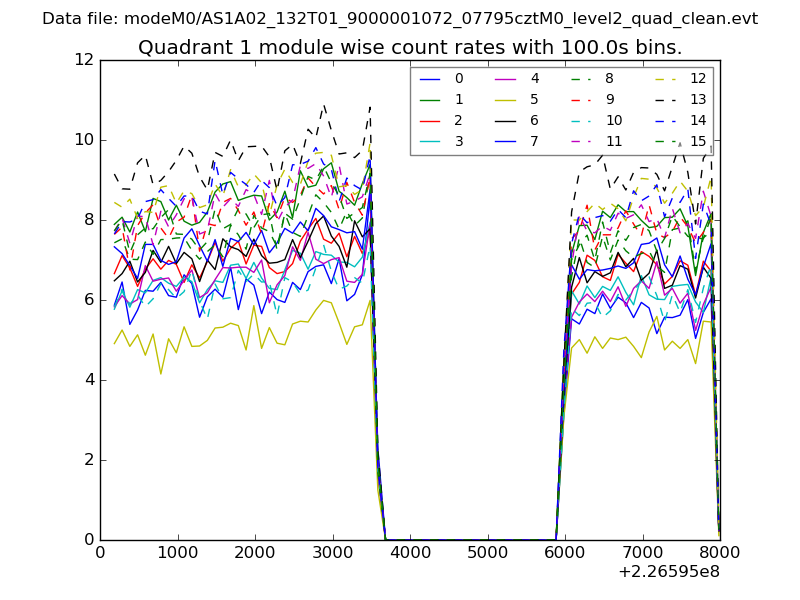
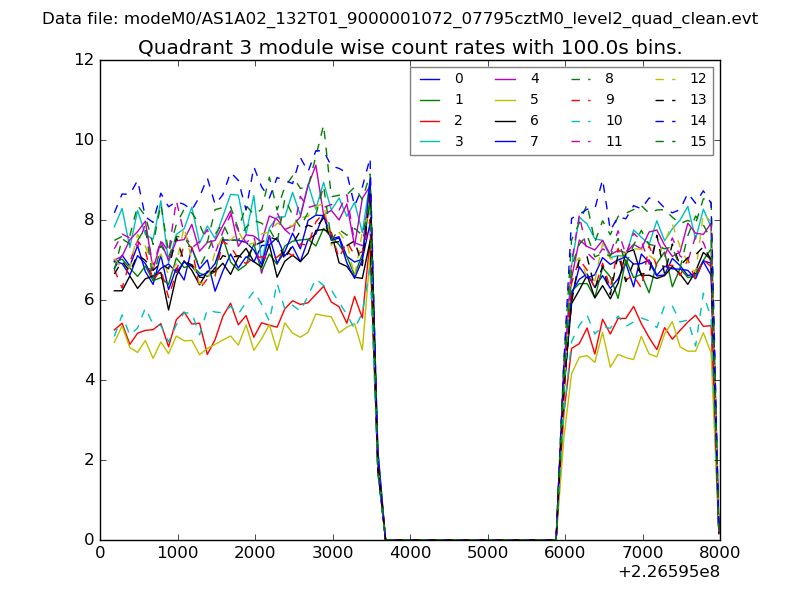
| Module-wise count rates for Quadrant A Data is divided into 100 sec bins |
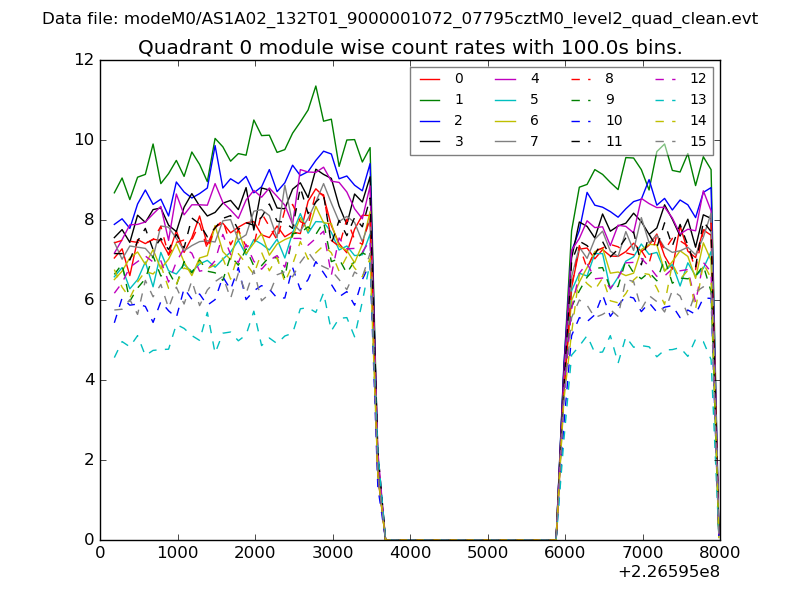 |
 |
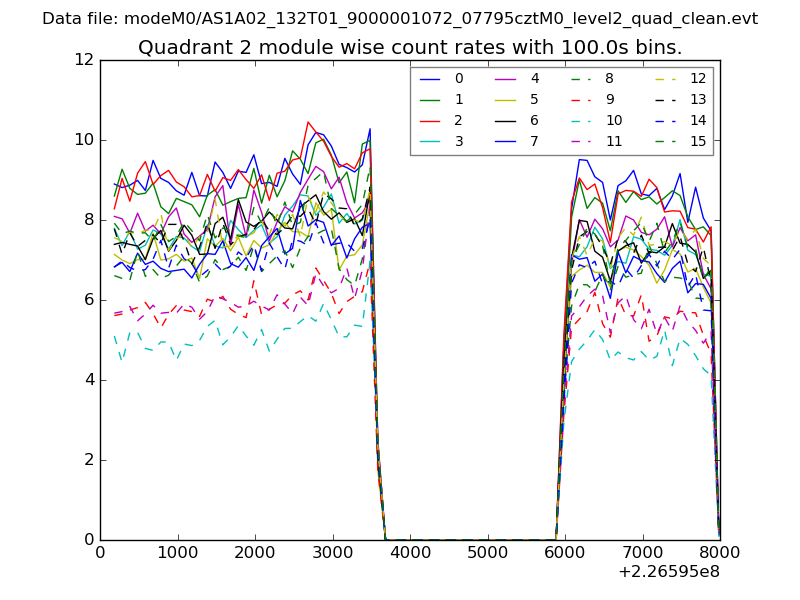
| Module-wise count rates for Quadrant B Data is divided into 100 sec bins |
 |
 |
| Module-wise count rates for Quadrant C Data is divided into 100 sec bins |
 |
 |
| Module-wise count rates for Quadrant D Data is divided into 100 sec bins |
 |
 |
| Parameter | Plot |
|---|---|
| CZT HV Monitor | 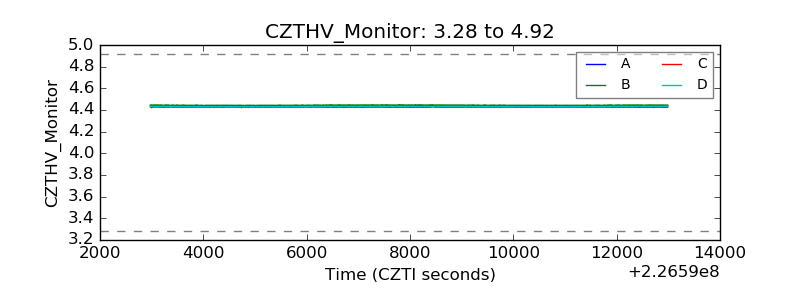 |
| D_VDD | 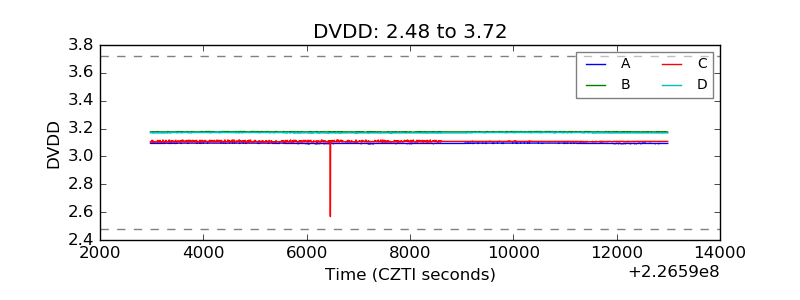 |
| Temperature 1 | 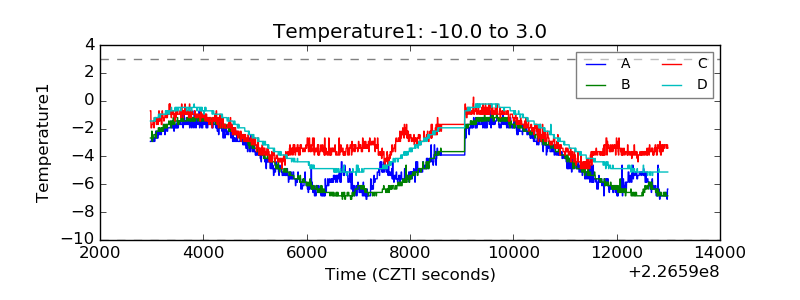 |
| Veto HV Monitor | 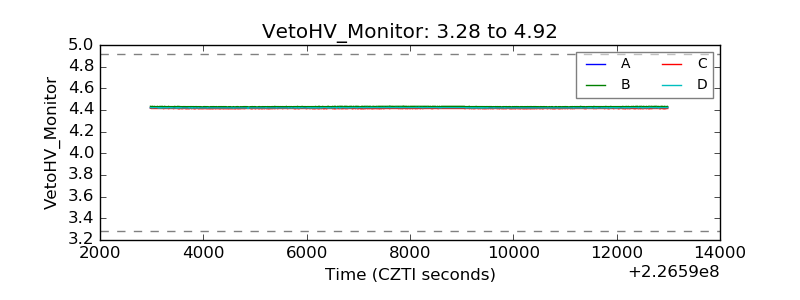 |
| Veto LLD | 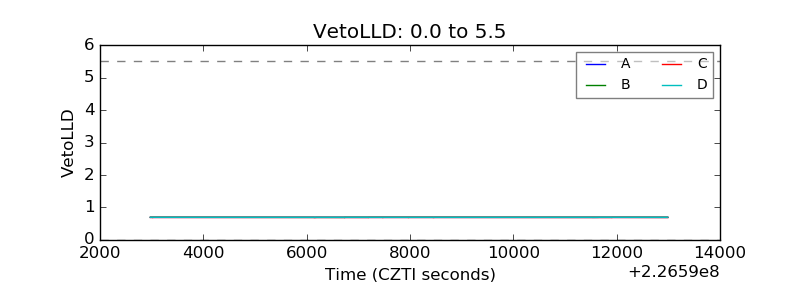 |
| Alpha Counter | 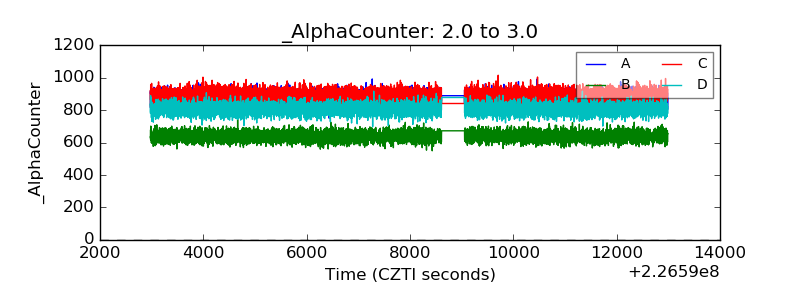 |
| _CPM_Rate | 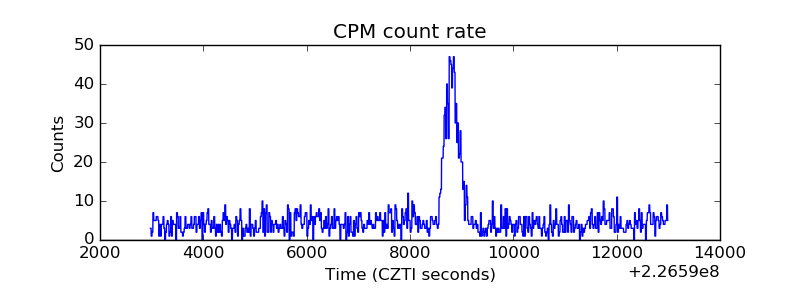 |
| CZT Counter | 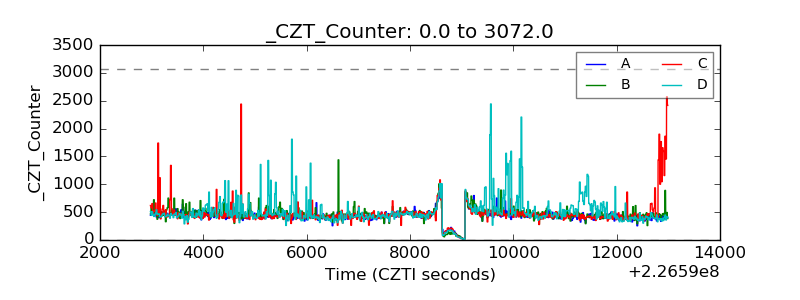 |
| +2.5 Volts monitor |  |
| +5 Volts monitor |  |
| _ROLL_ROT | 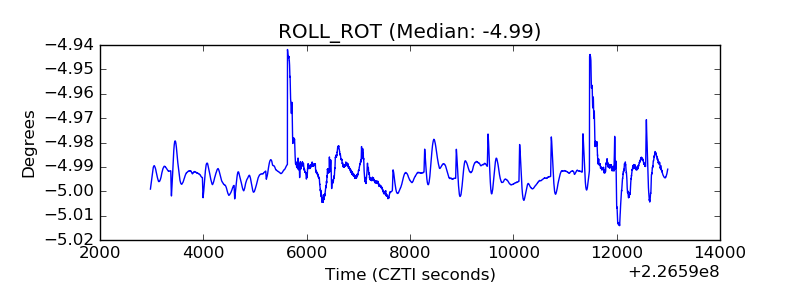 |
| _Roll_DEC | 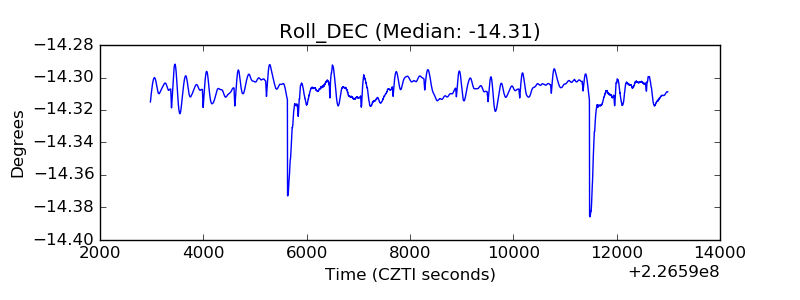 |
| _Roll_RA | 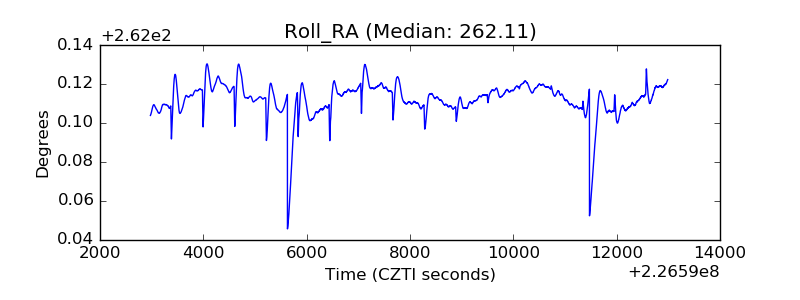 |
| Veto Counter | 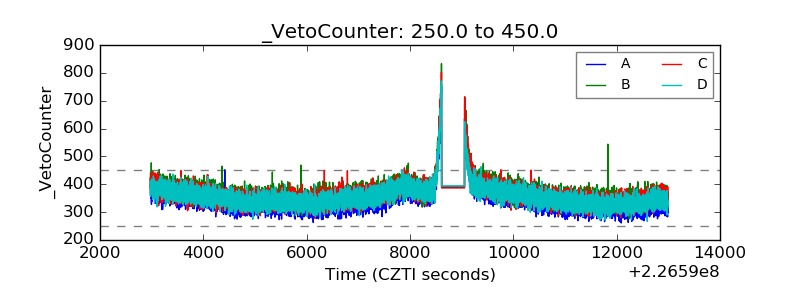 |