| Param | Original file | Final file |
|---|---|---|
| Filename | modeM0/AS1A02_132T01_9000001072_07796cztM0_level2.evt | modeM0/AS1A02_132T01_9000001072_07796cztM0_level2_quad_clean.evt |
| Size (bytes) | 1,012,325,760 | 172,851,840 |
| Size | 965.4 MB | 164.8 MB |
| Events in quadrant A | 6,777,822 | 1,054,307 |
| Events in quadrant B | 7,229,231 | 1,069,065 |
| Events in quadrant C | 7,494,143 | 1,060,478 |
| Events in quadrant D | 8,143,535 | 1,017,468 |
| Mode SS | |||
|---|---|---|---|
| Quadrant | BADHDUFLAG | Total packets | Discarded packets |
| A | 0 | 304 | 0 |
| B | 0 | 304 | 0 |
| C | 0 | 304 | 0 |
| D | 0 | 304 | 0 |
| Mode M0 | |||
|---|---|---|---|
| Quadrant | BADHDUFLAG | Total packets | Discarded packets |
| A | 0 | 30723 | 8 |
| B | 0 | 31440 | 8 |
| C | 0 | 32785 | 6 |
| D | 0 | 34806 | 9 |
| Mode M9 | |||
|---|---|---|---|
| Quadrant | BADHDUFLAG | Total packets | Discarded packets |
| A | 0 | 5 | 0 |
| B | 0 | 5 | 0 |
| C | 0 | 5 | 0 |
| D | 0 | 5 | 0 |
| Quadrant | Total seconds | Saturated seconds | Saturation percentage |
|---|---|---|---|
| A | 14963 | 245 | 1.637372% |
| B | 14963 | 254 | 1.697521% |
| C | 14965 | 347 | 2.318744% |
| D | 14963 | 308 | 2.058411% |
Noise dominated data is calculated using 1-second bins in cleaned event files. If a bin has >2000 counts, and if more than 50% of those come from <1% of pixels, then it is considered to be noise-dominated and hence unusable.
| Quadrant | # 1 sec bins | Bins with >0 counts | Bins with >2000 counts | High rate bins dominated by noise | Noise dominated (total time) | Noise dominated (detector-on time) | Marked lightcurve |
|---|---|---|---|---|---|---|---|
| A | 15606 | 14966 | 0 | 0 | 0.00% | 0.00% | 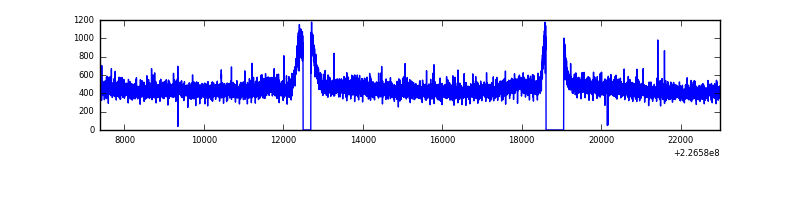 |
| B | 15606 | 14966 | 8 | 8 | 0.05% | 0.05% | 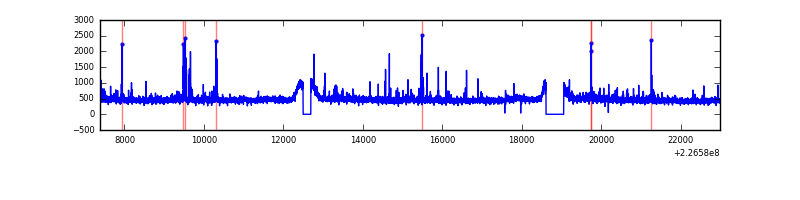 |
| C | 15606 | 14966 | 141 | 141 | 0.90% | 0.94% | 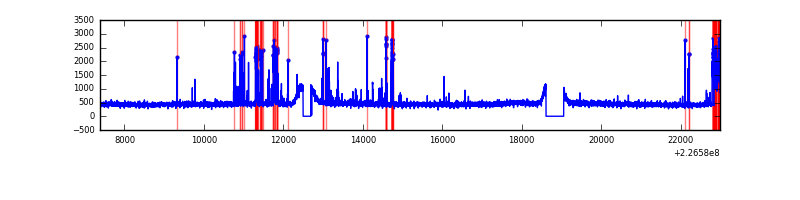 |
| D | 15606 | 14966 | 99 | 99 | 0.63% | 0.66% | 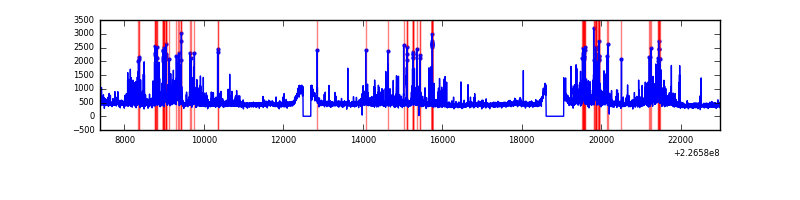 |
Top three noisy pixels from each quadrant. If the there are fewer than three noisy pixels in the level2.evt file, extra rows are filled as -1
| Pixel properties | Quadrant properties | ||||||
|---|---|---|---|---|---|---|---|
| Quadrant | DetID | PixID | Counts | Sigma | Mean | Median | Sigma |
| A | 0 | 226 | 16635 | 41.35 | 1757 | 1718 | 360.7 |
| A | 12 | 194 | 15215 | 37.42 | 1757 | 1718 | 360.7 |
| A | 13 | 254 | 7148 | 15.05 | 1757 | 1718 | 360.7 |
| B | 4 | 239 | 116786 | 337.18 | 1773 | 1731 | 341.2 |
| B | 0 | 214 | 66691 | 190.37 | 1773 | 1731 | 341.2 |
| B | 0 | 213 | 33965 | 94.46 | 1773 | 1731 | 341.2 |
| C | 4 | 254 | 436727 | 1085.25 | 1717 | 1725 | 400.8 |
| C | 9 | 68 | 308660 | 765.75 | 1717 | 1725 | 400.8 |
| C | 1 | 16 | 22269 | 51.25 | 1717 | 1725 | 400.8 |
| D | 2 | 152 | 1057723 | 2516.24 | 1711 | 1660 | 419.7 |
| D | 13 | 104 | 240008 | 567.9 | 1711 | 1660 | 419.7 |
| D | 2 | 14 | 135778 | 319.56 | 1711 | 1660 | 419.7 |
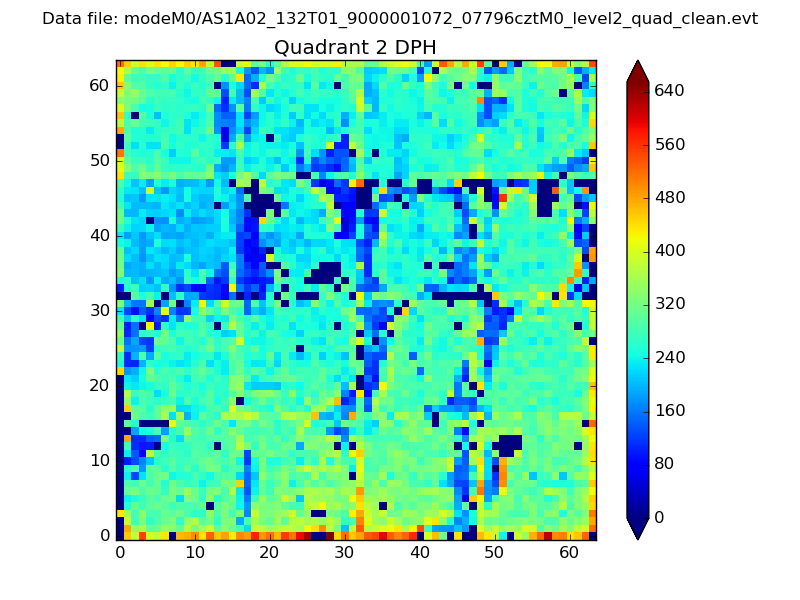
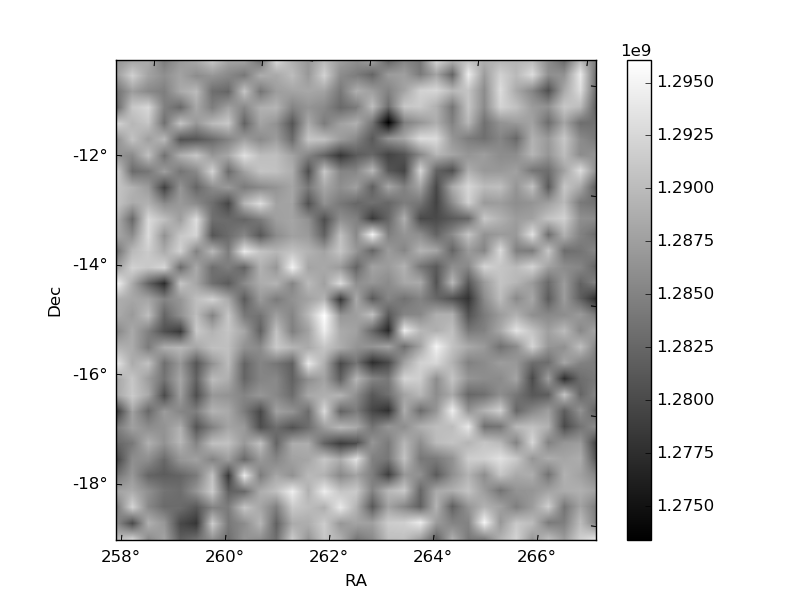
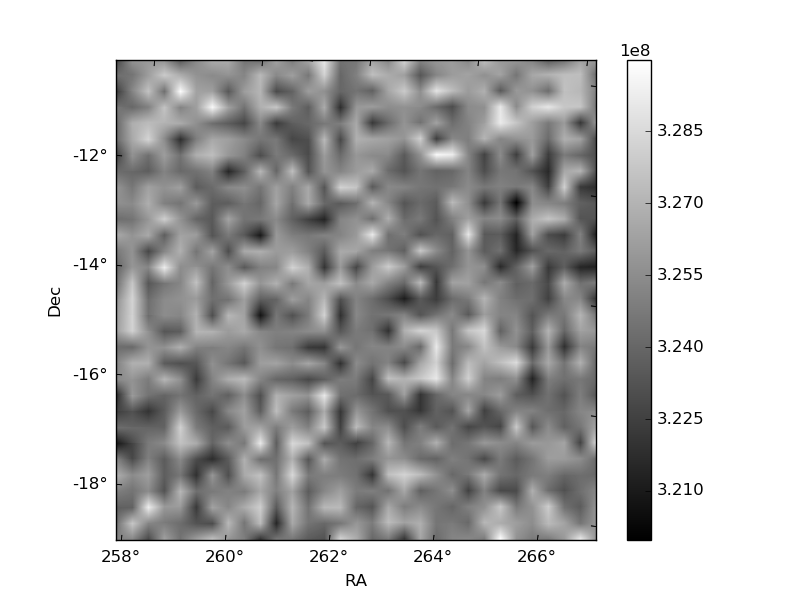
Histogram calculated using DETX and DETY for each event in the final _common_clean file
| Quadrant A | 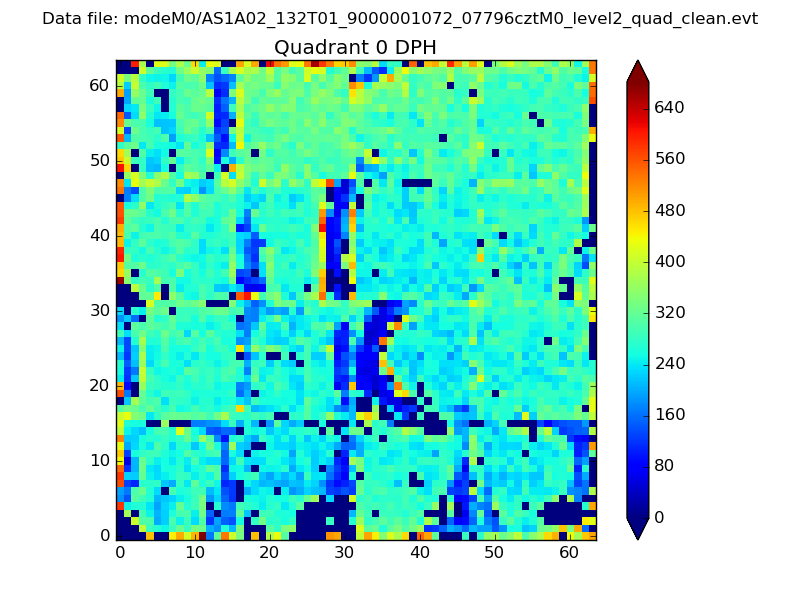 |
 |
Quadrant B |
|---|---|---|---|
| Quadrant D | 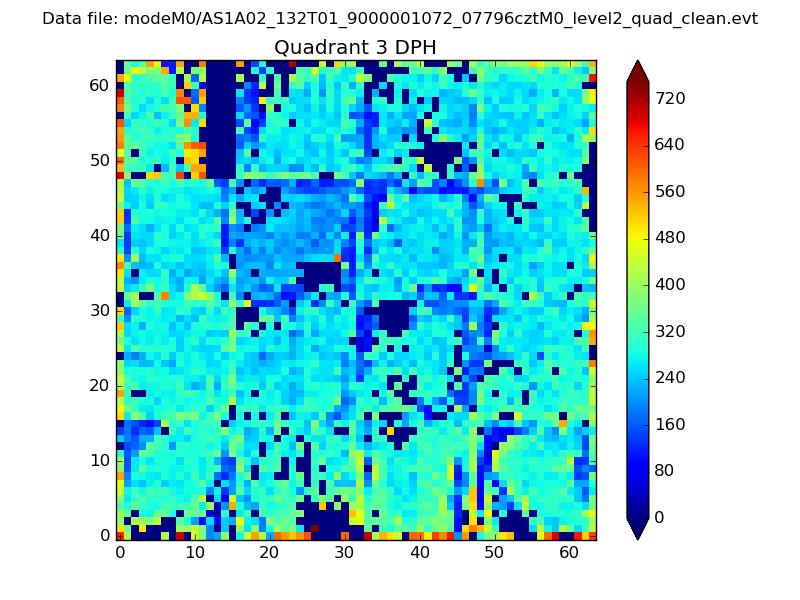 |
 |
Quadrant C |
| Plot type | Count rate plots | Images |
|---|---|---|
| Comparison with Poisson distribution Blue bars denote a histogram of data divided into 1 sec bins. Red curve is a Poisson curve with rate = median count rate of data. |
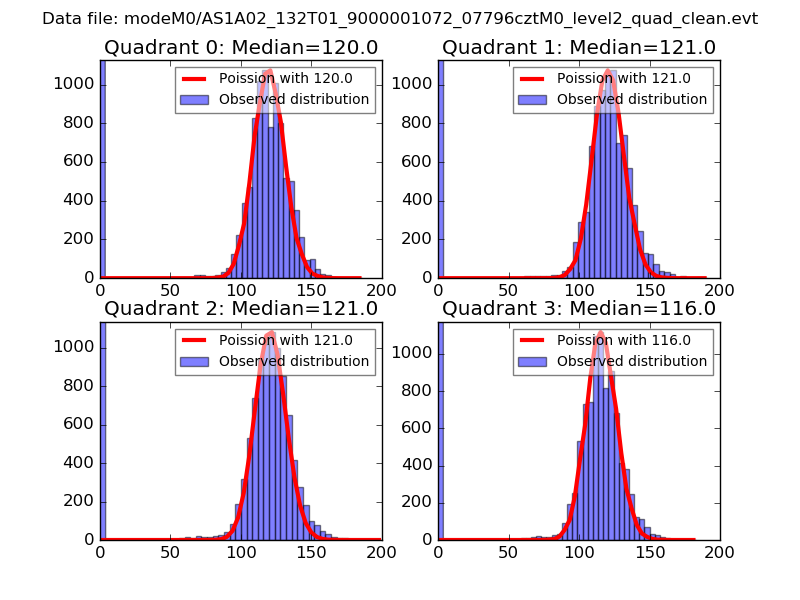 |
 |
| Quadrant-wise count rates Data is divided into 100 sec bins |
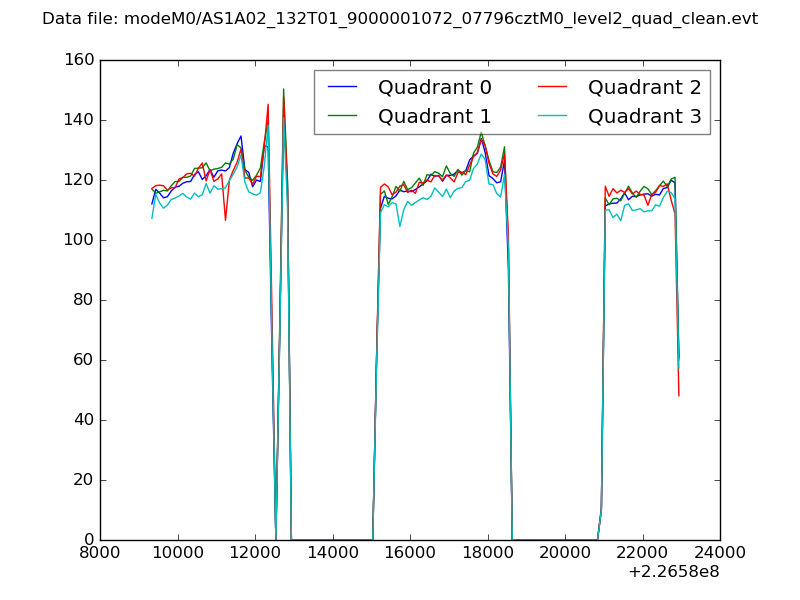 |
|
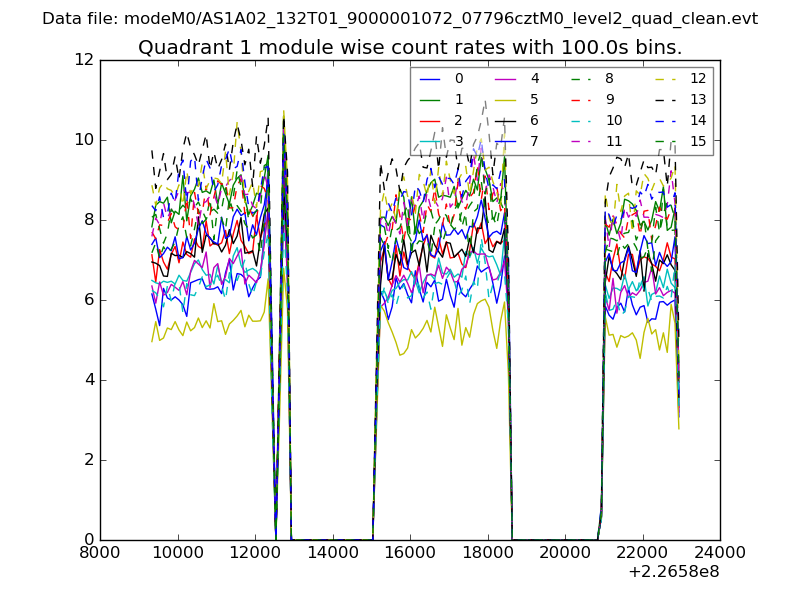
| Module-wise count rates for Quadrant A Data is divided into 100 sec bins |
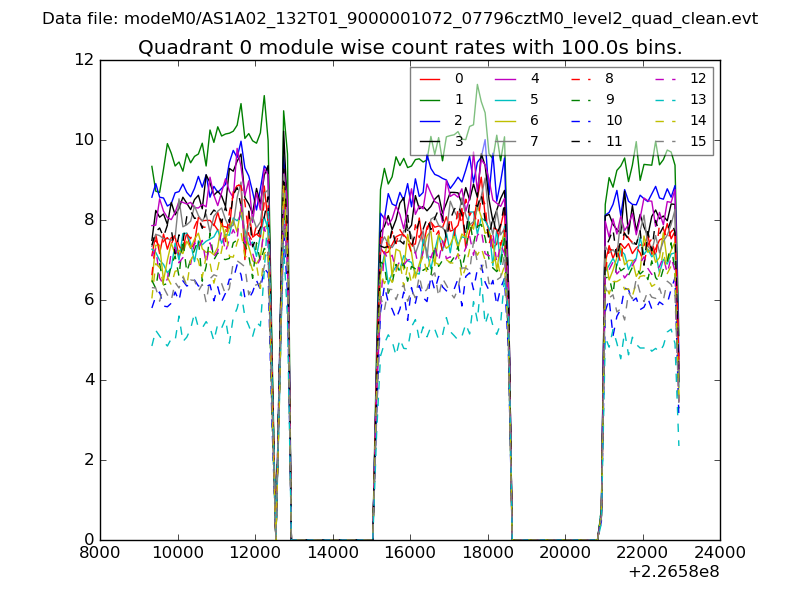 |
 |
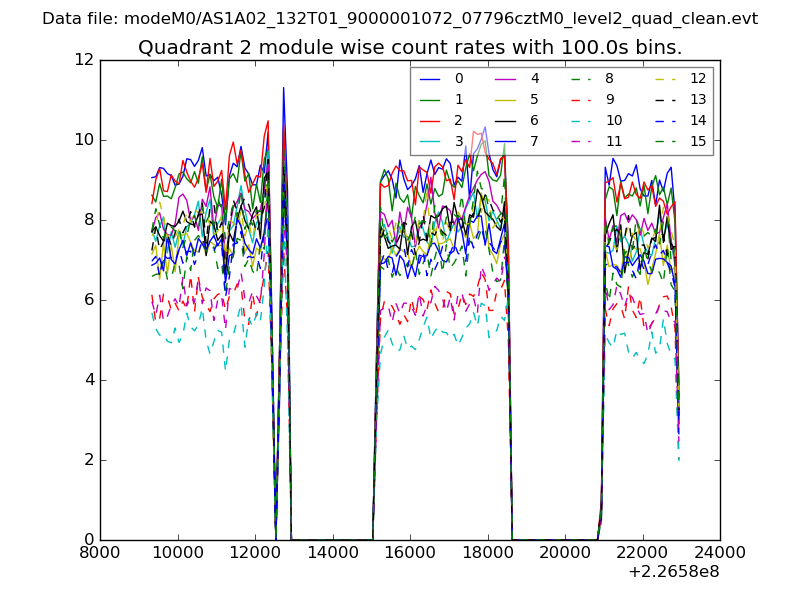
| Module-wise count rates for Quadrant B Data is divided into 100 sec bins |
 |
 |
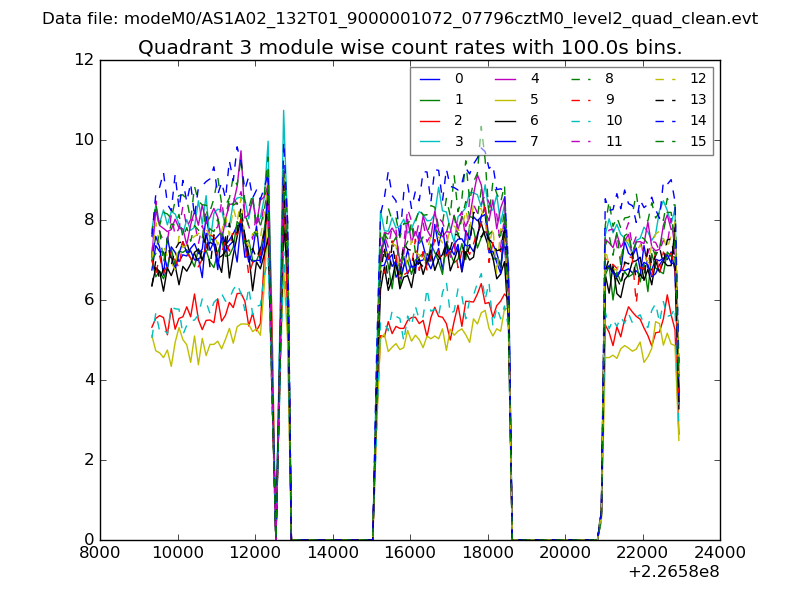
| Module-wise count rates for Quadrant C Data is divided into 100 sec bins |
 |
 |
| Module-wise count rates for Quadrant D Data is divided into 100 sec bins |
 |
 |
| Parameter | Plot |
|---|---|
| CZT HV Monitor | 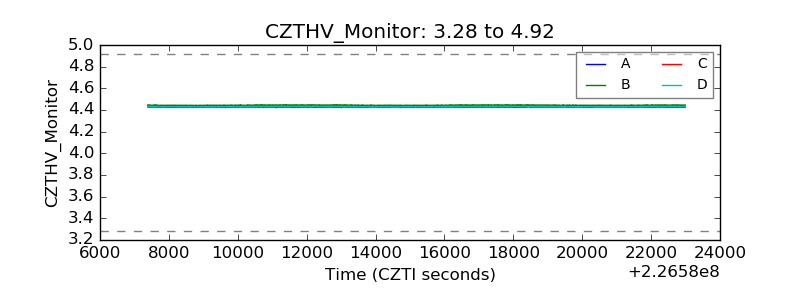 |
| D_VDD | 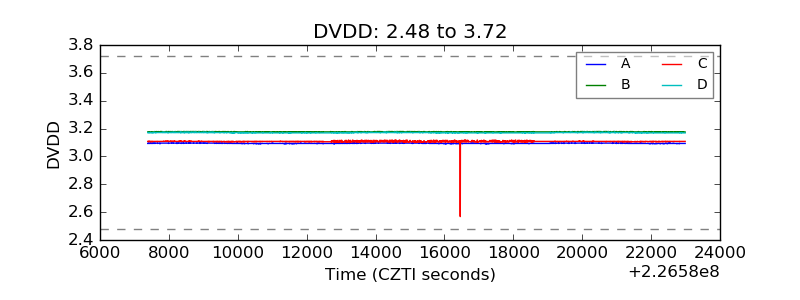 |
| Temperature 1 |  |
| Veto HV Monitor | 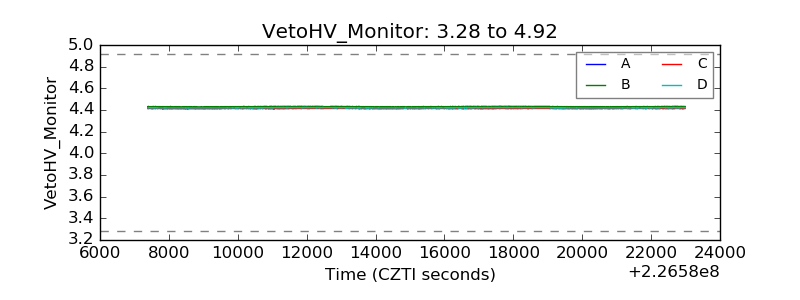 |
| Veto LLD | 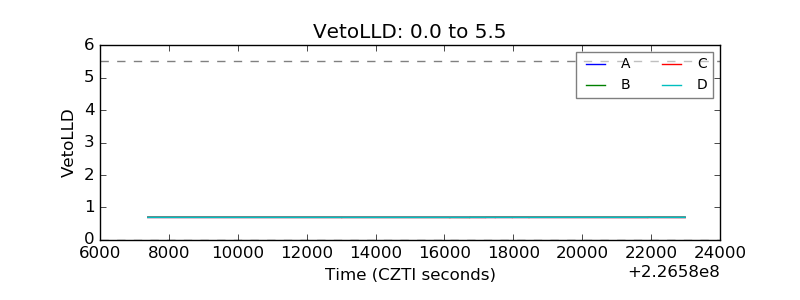 |
| Alpha Counter | 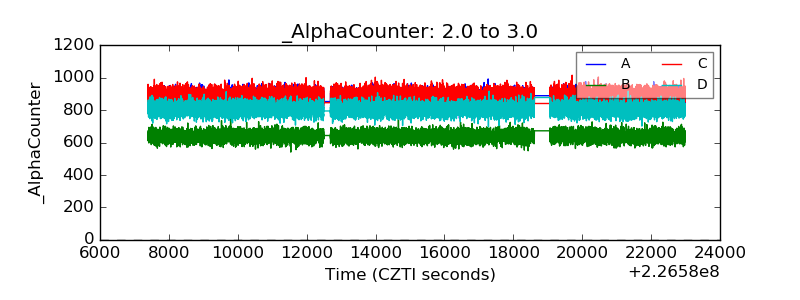 |
| _CPM_Rate | 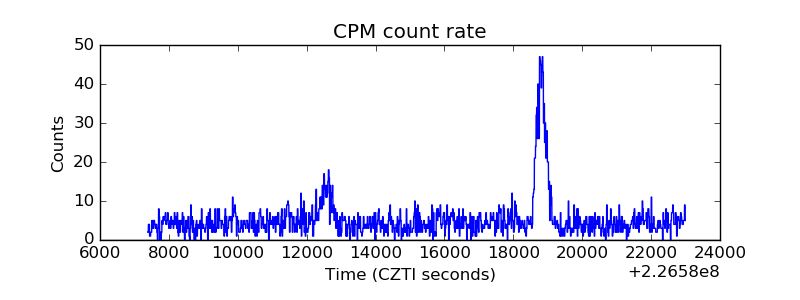 |
| CZT Counter | 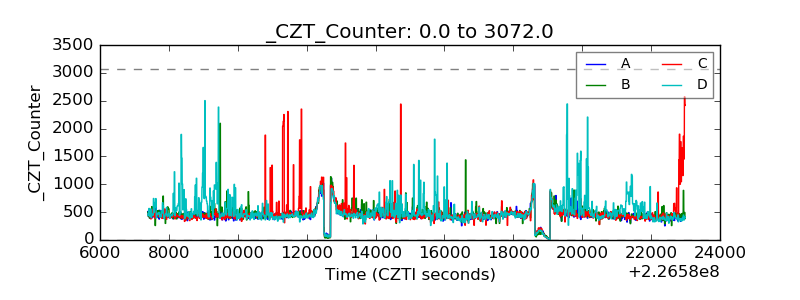 |
| +2.5 Volts monitor |  |
| +5 Volts monitor | 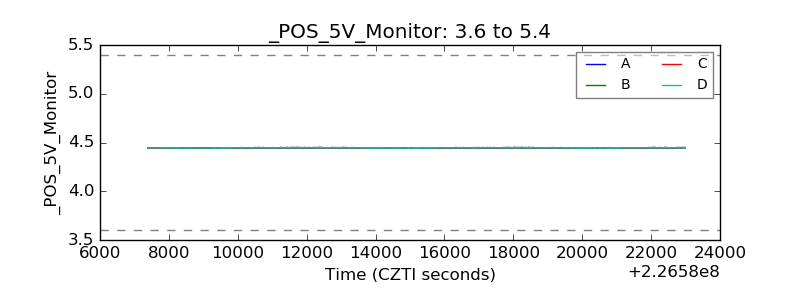 |
| _ROLL_ROT | 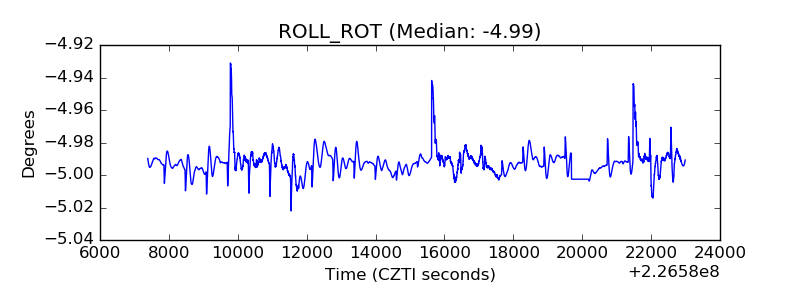 |
| _Roll_DEC | 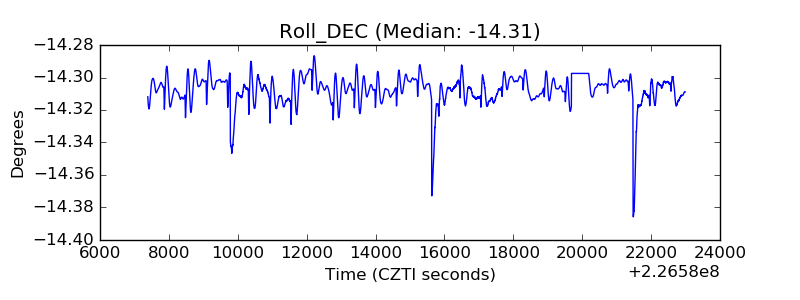 |
| _Roll_RA | 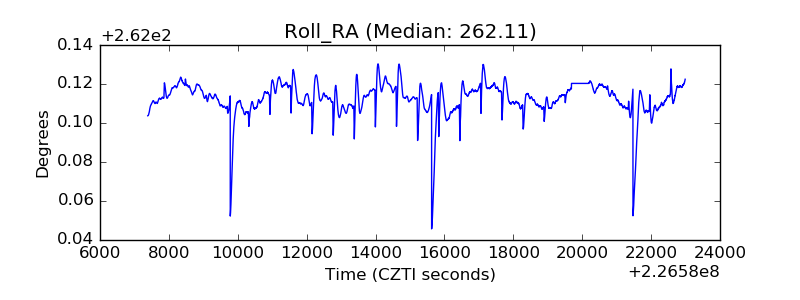 |
| Veto Counter | 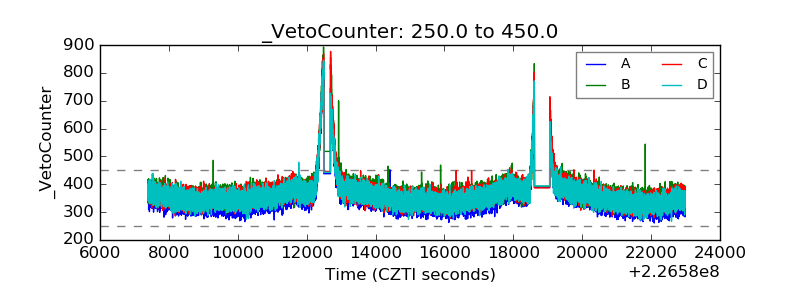 |