| Param | Original file | Final file |
|---|---|---|
| Filename | modeM0/AS1G06_032T01_9000001074_07795cztM0_level2.evt | modeM0/AS1G06_032T01_9000001074_07795cztM0_level2_quad_clean.evt |
| Size (bytes) | 456,883,200 | 107,256,960 |
| Size | 435.7 MB | 102.3 MB |
| Events in quadrant A | 3,248,972 | 698,353 |
| Events in quadrant B | 3,386,670 | 715,716 |
| Events in quadrant C | 3,375,872 | 684,045 |
| Events in quadrant D | 3,338,037 | 651,862 |
| Mode M0 | |||
|---|---|---|---|
| Quadrant | BADHDUFLAG | Total packets | Discarded packets |
| A | 0 | 16292 | 1777 |
| B | 0 | 16517 | 1830 |
| C | 0 | 17004 | 2023 |
| D | 0 | 17037 | 2089 |
| Mode M9 | |||
|---|---|---|---|
| Quadrant | BADHDUFLAG | Total packets | Discarded packets |
| A | 0 | 14 | 3 |
| B | 0 | 14 | 1 |
| C | 0 | 14 | 0 |
| D | 0 | 14 | 0 |
| Mode SS | |||
|---|---|---|---|
| Quadrant | BADHDUFLAG | Total packets | Discarded packets |
| A | 0 | 166 | 10 |
| B | 0 | 166 | 14 |
| C | 0 | 166 | 10 |
| D | 0 | 166 | 24 |
| Quadrant | Total seconds | Saturated seconds | Saturation percentage |
|---|---|---|---|
| A | 7159 | 54 | 0.754295% |
| B | 7151 | 48 | 0.671235% |
| C | 7119 | 46 | 0.646158% |
| D | 7091 | 45 | 0.634607% |
Noise dominated data is calculated using 1-second bins in cleaned event files. If a bin has >2000 counts, and if more than 50% of those come from <1% of pixels, then it is considered to be noise-dominated and hence unusable.
| Quadrant | # 1 sec bins | Bins with >0 counts | Bins with >2000 counts | High rate bins dominated by noise | Noise dominated (total time) | Noise dominated (detector-on time) | Marked lightcurve |
|---|---|---|---|---|---|---|---|
| A | 9429 | 7742 | 0 | 0 | 0.00% | 0.00% | 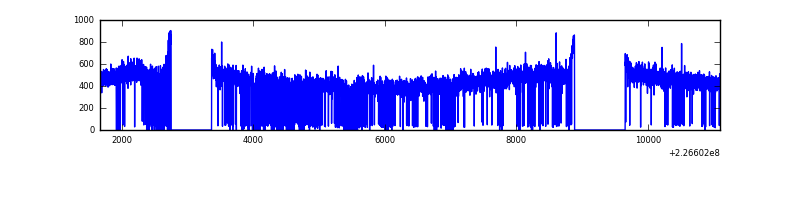 |
| B | 9429 | 7720 | 0 | 0 | 0.00% | 0.00% | 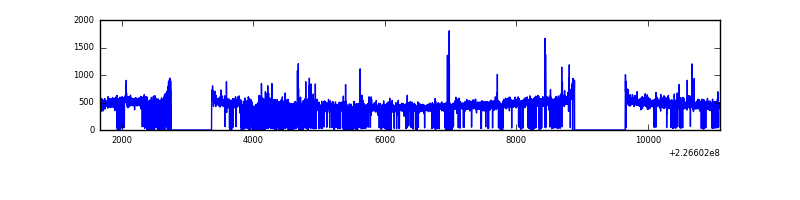 |
| C | 9429 | 7723 | 21 | 21 | 0.22% | 0.27% | 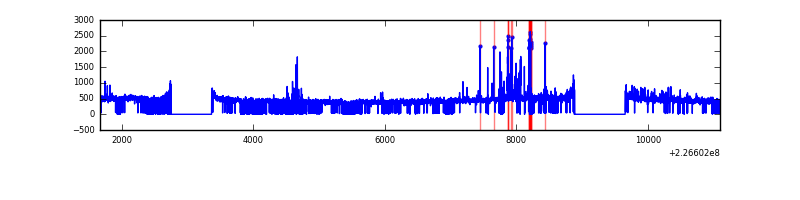 |
| D | 9429 | 7686 | 16 | 16 | 0.17% | 0.21% | 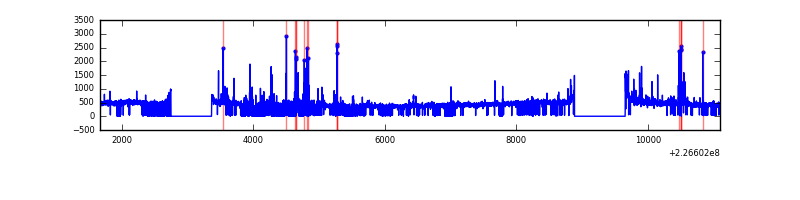 |
Top three noisy pixels from each quadrant. If the there are fewer than three noisy pixels in the level2.evt file, extra rows are filled as -1
| Pixel properties | Quadrant properties | ||||||
|---|---|---|---|---|---|---|---|
| Quadrant | DetID | PixID | Counts | Sigma | Mean | Median | Sigma |
| A | 0 | 226 | 7892 | 40.82 | 844 | 822 | 173.2 |
| A | 12 | 194 | 7334 | 37.6 | 844 | 822 | 173.2 |
| A | 3 | 137 | 3085 | 13.07 | 844 | 822 | 173.2 |
| B | 4 | 239 | 21205 | 125.54 | 851 | 829 | 162.3 |
| B | 12 | 111 | 15997 | 93.45 | 851 | 829 | 162.3 |
| B | 0 | 214 | 13038 | 75.22 | 851 | 829 | 162.3 |
| C | 4 | 254 | 120786 | 632.88 | 810 | 811 | 189.6 |
| C | 9 | 243 | 49695 | 257.87 | 810 | 811 | 189.6 |
| C | 12 | 4 | 24939 | 127.28 | 810 | 811 | 189.6 |
| D | 13 | 104 | 122354 | 613.56 | 806 | 780 | 198.1 |
| D | 2 | 152 | 54259 | 269.9 | 806 | 780 | 198.1 |
| D | 2 | 14 | 52774 | 262.4 | 806 | 780 | 198.1 |
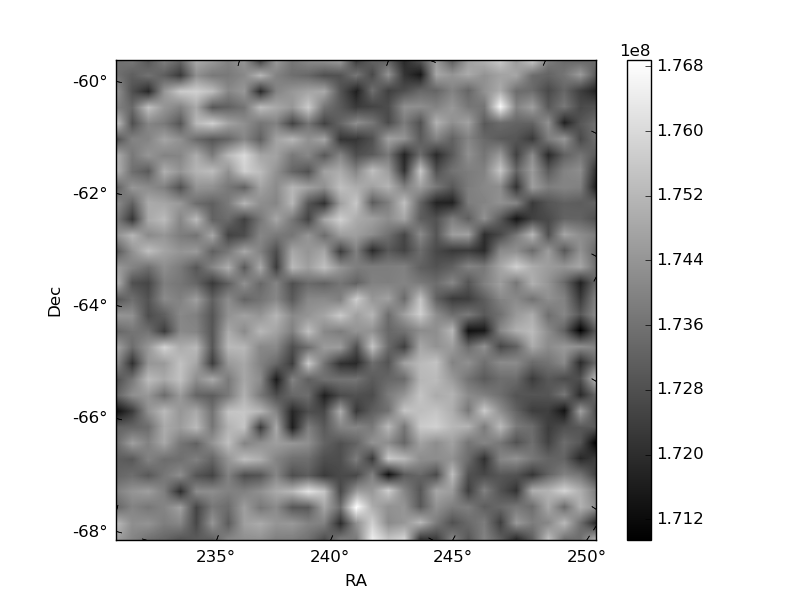
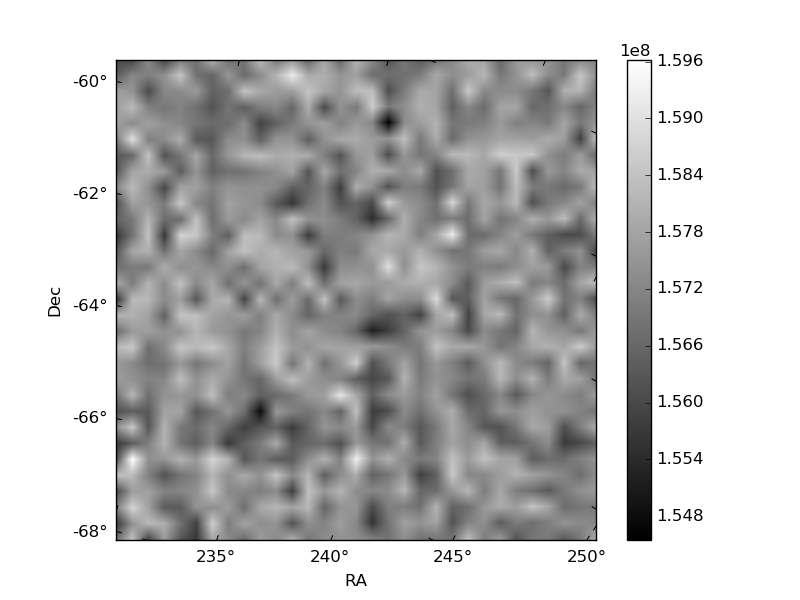
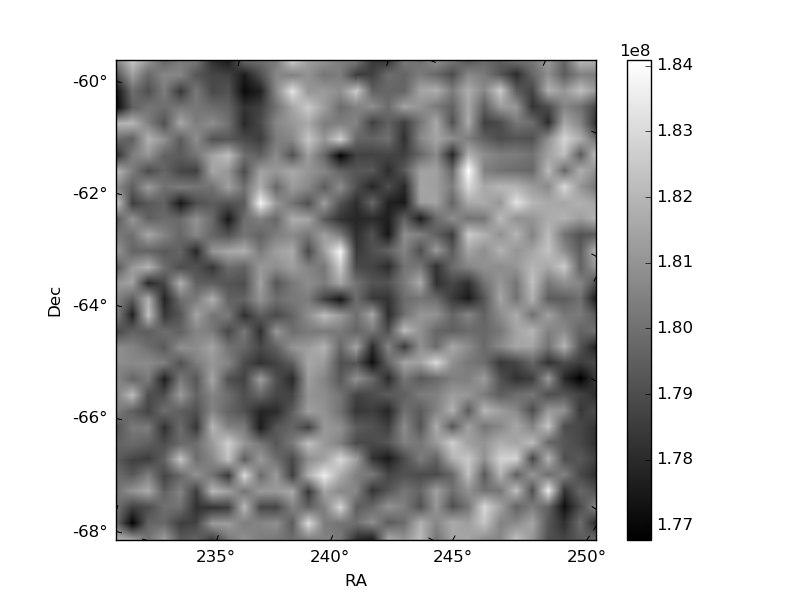
Histogram calculated using DETX and DETY for each event in the final _common_clean file
| Quadrant A | 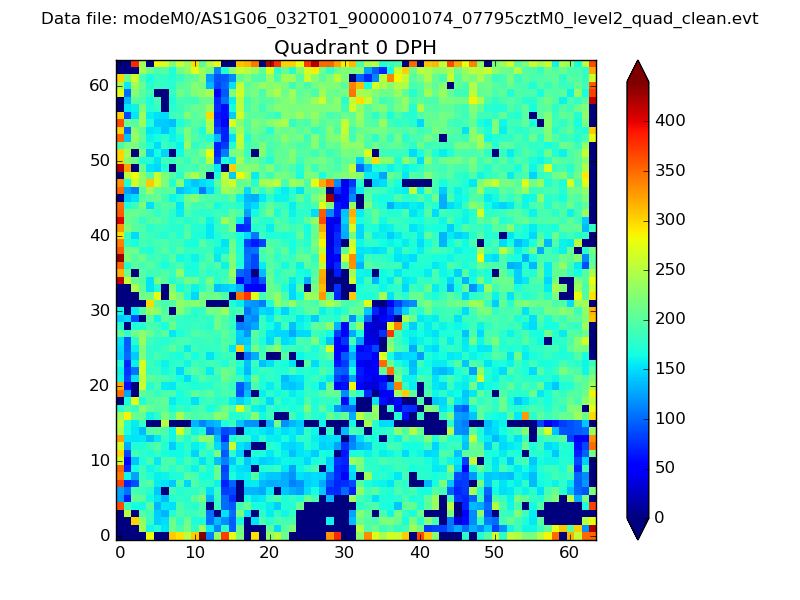 |
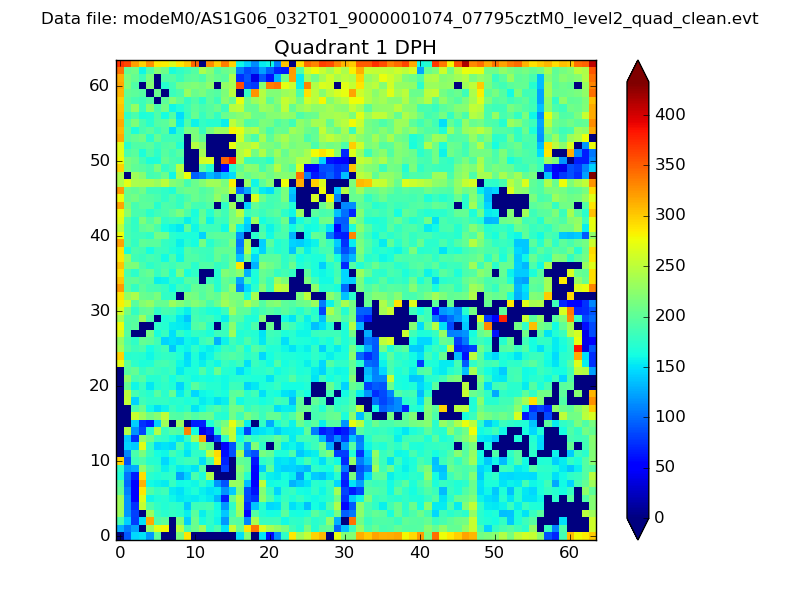 |
Quadrant B |
|---|---|---|---|
| Quadrant D | 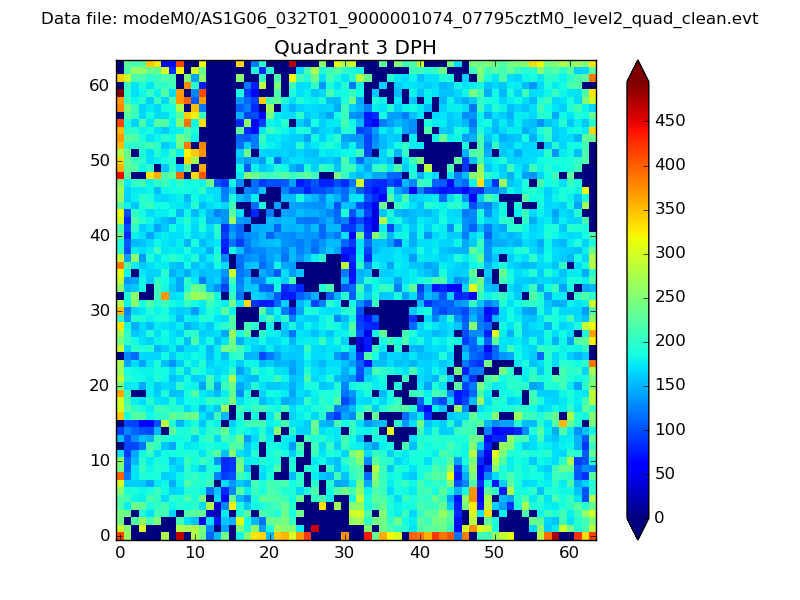 |
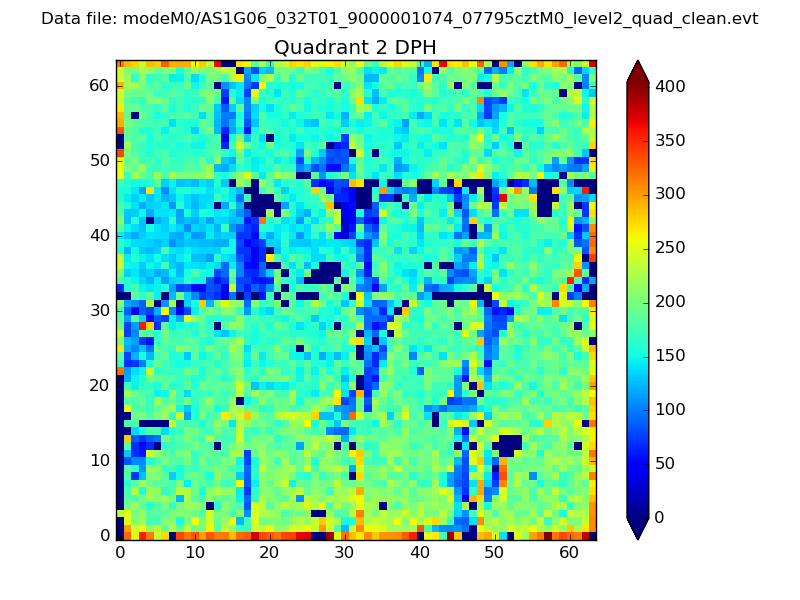 |
Quadrant C |
| Plot type | Count rate plots | Images |
|---|---|---|
| Comparison with Poisson distribution Blue bars denote a histogram of data divided into 1 sec bins. Red curve is a Poisson curve with rate = median count rate of data. |
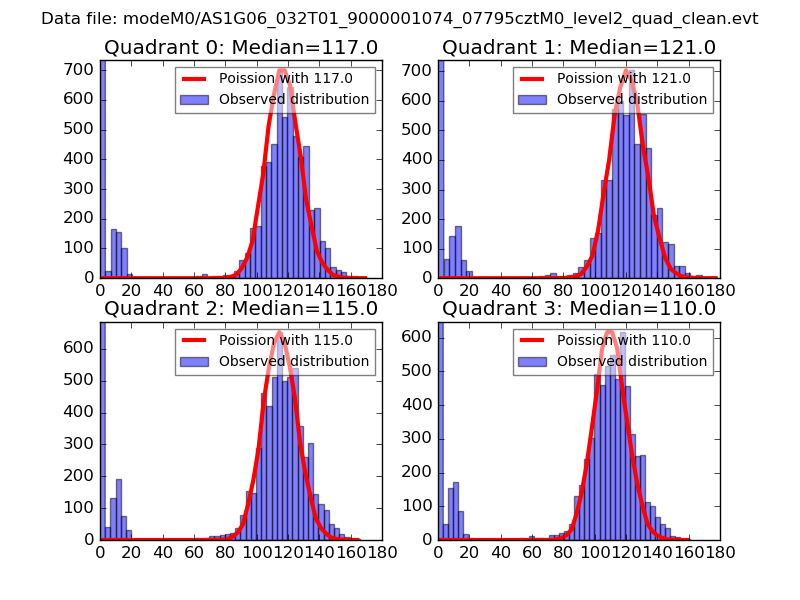 |
 |
| Quadrant-wise count rates Data is divided into 100 sec bins |
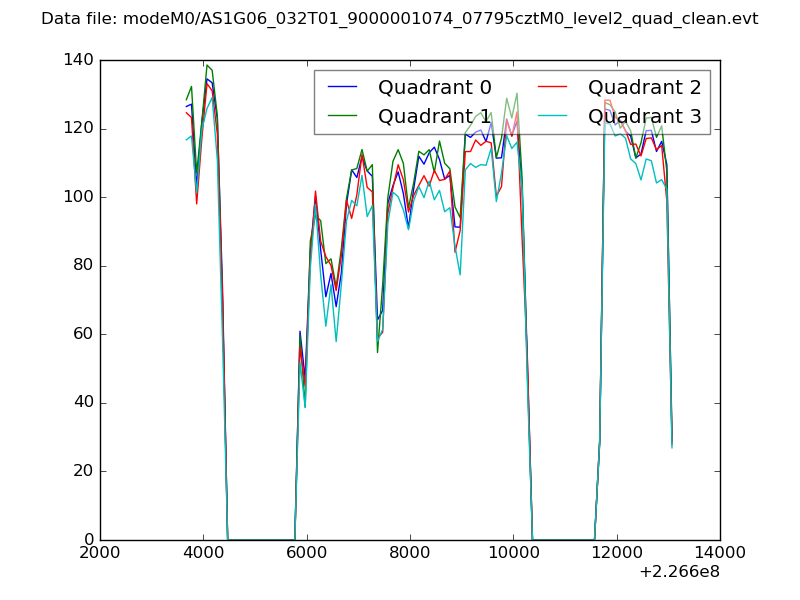 |
|
| Module-wise count rates for Quadrant A Data is divided into 100 sec bins |
 |
 |
| Module-wise count rates for Quadrant B Data is divided into 100 sec bins |
 |
 |
| Module-wise count rates for Quadrant C Data is divided into 100 sec bins |
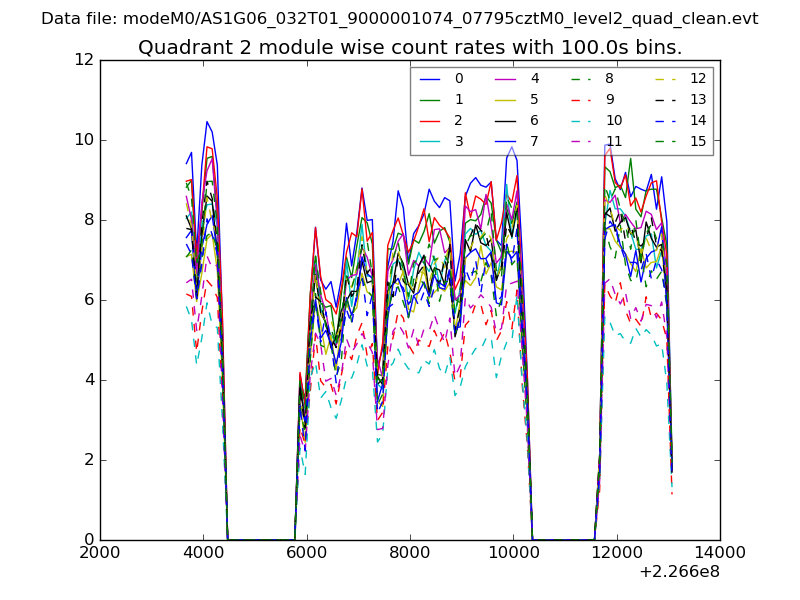 |
 |
| Module-wise count rates for Quadrant D Data is divided into 100 sec bins |
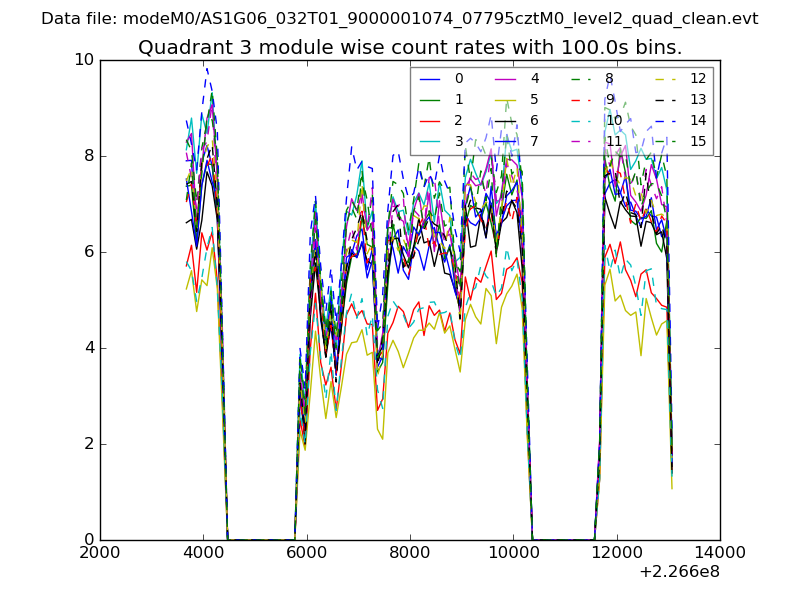 |
 |
| Parameter | Plot |
|---|---|
| CZT HV Monitor | 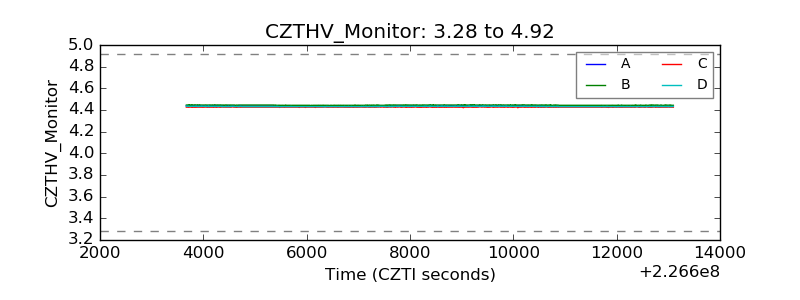 |
| D_VDD | 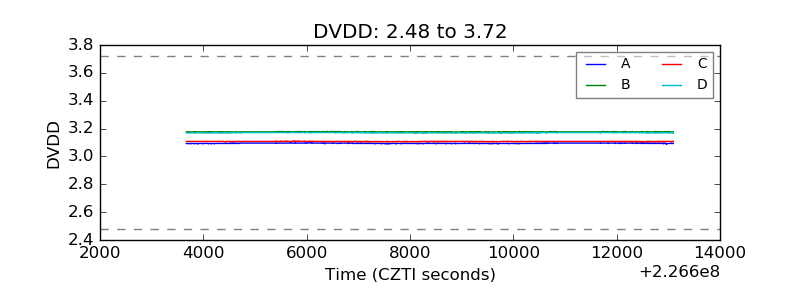 |
| Temperature 1 | 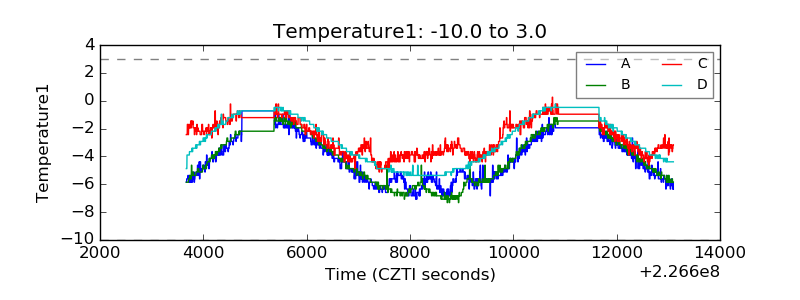 |
| Veto HV Monitor | 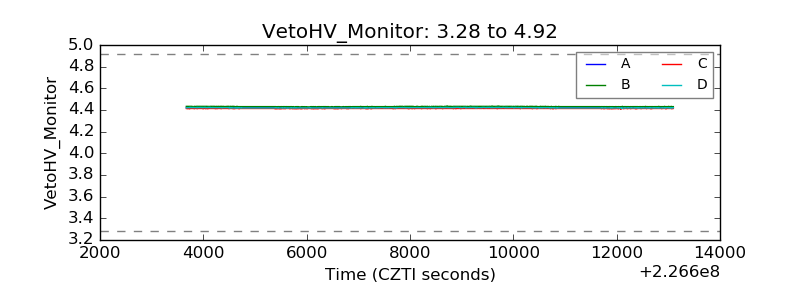 |
| Veto LLD | 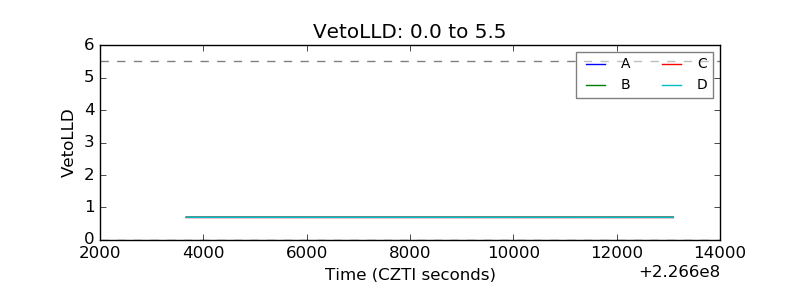 |
| Alpha Counter | 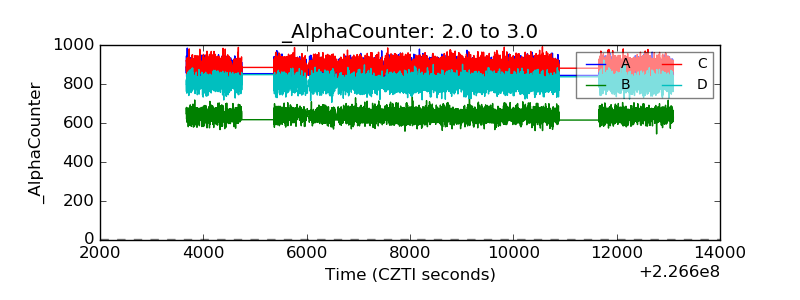 |
| _CPM_Rate | 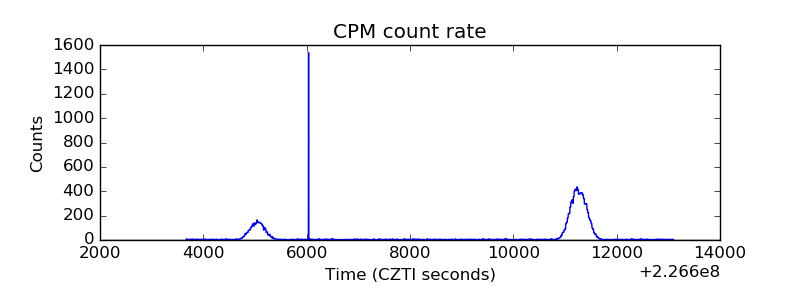 |
| CZT Counter | 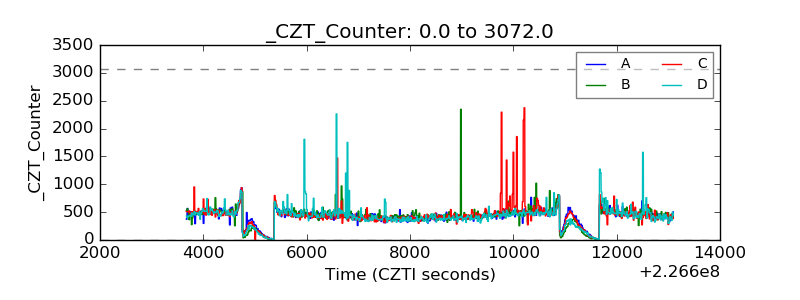 |
| +2.5 Volts monitor |  |
| +5 Volts monitor |  |
| _ROLL_ROT | 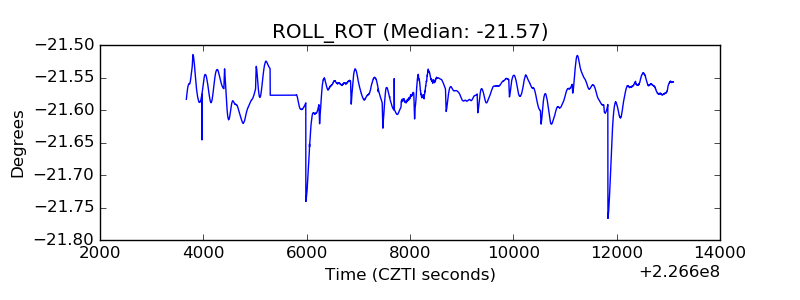 |
| _Roll_DEC | 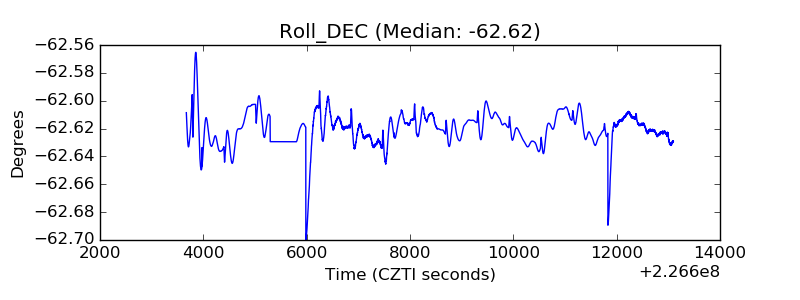 |
| _Roll_RA | 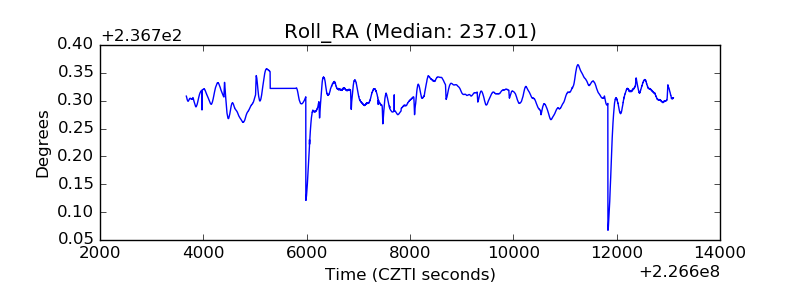 |
| Veto Counter |  |