| Param | Original file | Final file |
|---|---|---|
| Filename | modeM0/AS1G06_032T01_9000001074_07798cztM0_level2.evt | modeM0/AS1G06_032T01_9000001074_07798cztM0_level2_quad_clean.evt |
| Size (bytes) | 437,411,520 | 106,905,600 |
| Size | 417.1 MB | 102.0 MB |
| Events in quadrant A | 3,081,498 | 698,946 |
| Events in quadrant B | 3,241,739 | 721,089 |
| Events in quadrant C | 3,125,651 | 686,774 |
| Events in quadrant D | 3,332,930 | 654,113 |
| Mode M0 | |||
|---|---|---|---|
| Quadrant | BADHDUFLAG | Total packets | Discarded packets |
| A | 0 | 13837 | 3 |
| B | 0 | 14266 | 2 |
| C | 0 | 13968 | 2 |
| D | 0 | 14791 | 2 |
| Mode M9 | |||
|---|---|---|---|
| Quadrant | BADHDUFLAG | Total packets | Discarded packets |
| A | 0 | 14 | 0 |
| B | 0 | 14 | 0 |
| C | 0 | 14 | 0 |
| D | 0 | 15 | 0 |
| Mode SS | |||
|---|---|---|---|
| Quadrant | BADHDUFLAG | Total packets | Discarded packets |
| A | 0 | 138 | 0 |
| B | 0 | 138 | 0 |
| C | 0 | 138 | 0 |
| D | 0 | 138 | 0 |
| Quadrant | Total seconds | Saturated seconds | Saturation percentage |
|---|---|---|---|
| A | 6838 | 32 | 0.467973% |
| B | 6838 | 46 | 0.672711% |
| C | 6838 | 24 | 0.350980% |
| D | 6838 | 50 | 0.731208% |
Noise dominated data is calculated using 1-second bins in cleaned event files. If a bin has >2000 counts, and if more than 50% of those come from <1% of pixels, then it is considered to be noise-dominated and hence unusable.
| Quadrant | # 1 sec bins | Bins with >0 counts | Bins with >2000 counts | High rate bins dominated by noise | Noise dominated (total time) | Noise dominated (detector-on time) | Marked lightcurve |
|---|---|---|---|---|---|---|---|
| A | 7908 | 6838 | 0 | 0 | 0.00% | 0.00% | 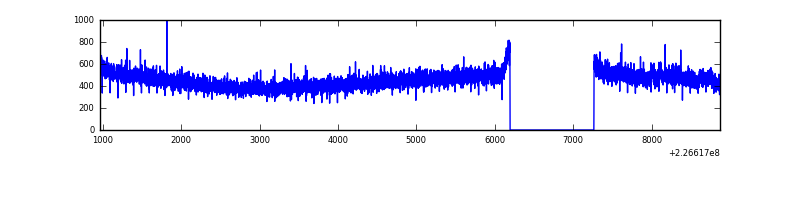 |
| B | 7908 | 6838 | 3 | 3 | 0.04% | 0.04% |  |
| C | 7908 | 6838 | 0 | 0 | 0.00% | 0.00% |  |
| D | 7908 | 6838 | 26 | 26 | 0.33% | 0.38% | 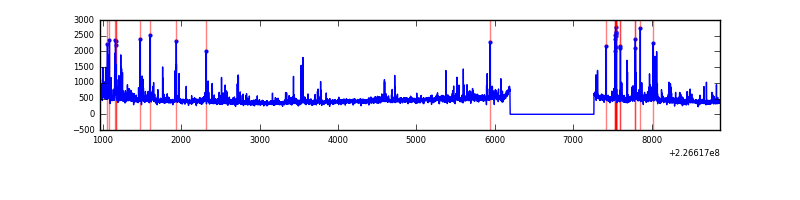 |
Top three noisy pixels from each quadrant. If the there are fewer than three noisy pixels in the level2.evt file, extra rows are filled as -1
| Pixel properties | Quadrant properties | ||||||
|---|---|---|---|---|---|---|---|
| Quadrant | DetID | PixID | Counts | Sigma | Mean | Median | Sigma |
| A | 15 | 239 | 45886 | 280.45 | 788 | 770 | 160.9 |
| A | 0 | 226 | 7450 | 41.52 | 788 | 770 | 160.9 |
| A | 12 | 194 | 6889 | 38.04 | 788 | 770 | 160.9 |
| B | 4 | 173 | 40351 | 261.31 | 804 | 786 | 151.4 |
| B | 0 | 214 | 31634 | 203.74 | 804 | 786 | 151.4 |
| B | 0 | 219 | 18603 | 117.67 | 804 | 786 | 151.4 |
| C | 9 | 243 | 82502 | 458.03 | 772 | 775 | 178.4 |
| C | 10 | 22 | 14761 | 78.38 | 772 | 775 | 178.4 |
| C | 1 | 16 | 11011 | 57.37 | 772 | 775 | 178.4 |
| D | 2 | 152 | 283580 | 1511.77 | 761 | 737 | 187.1 |
| D | 13 | 104 | 58060 | 306.39 | 761 | 737 | 187.1 |
| D | 2 | 14 | 50936 | 268.31 | 761 | 737 | 187.1 |
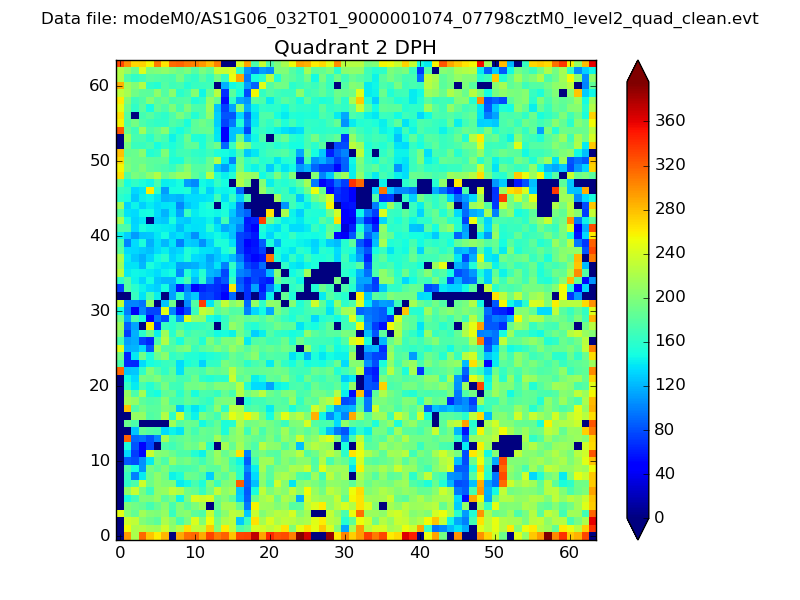
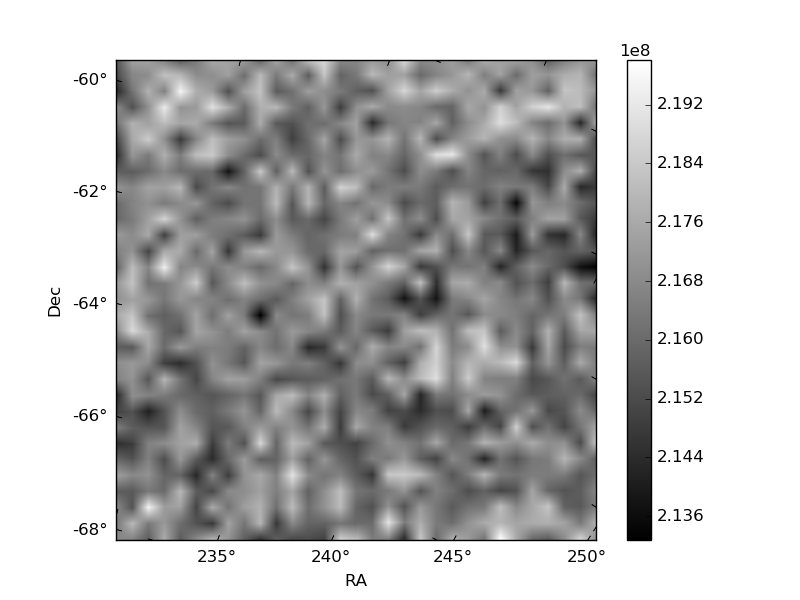
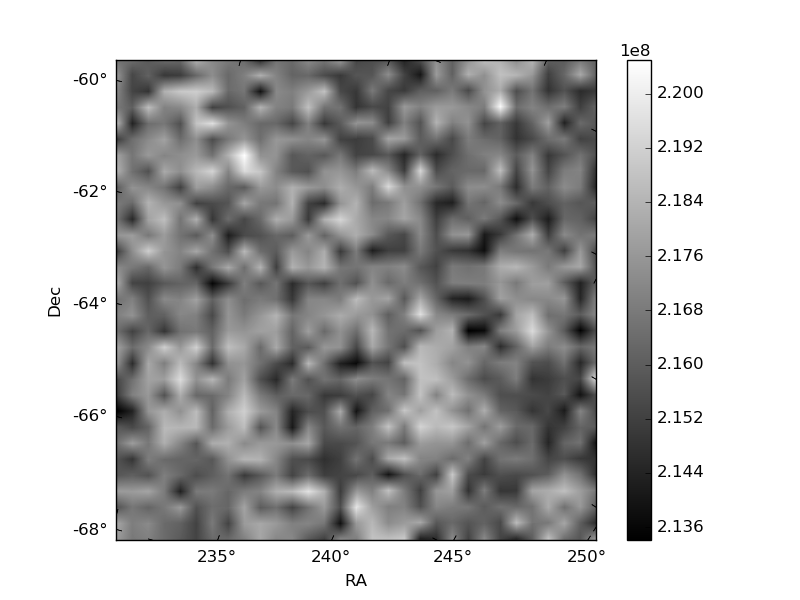
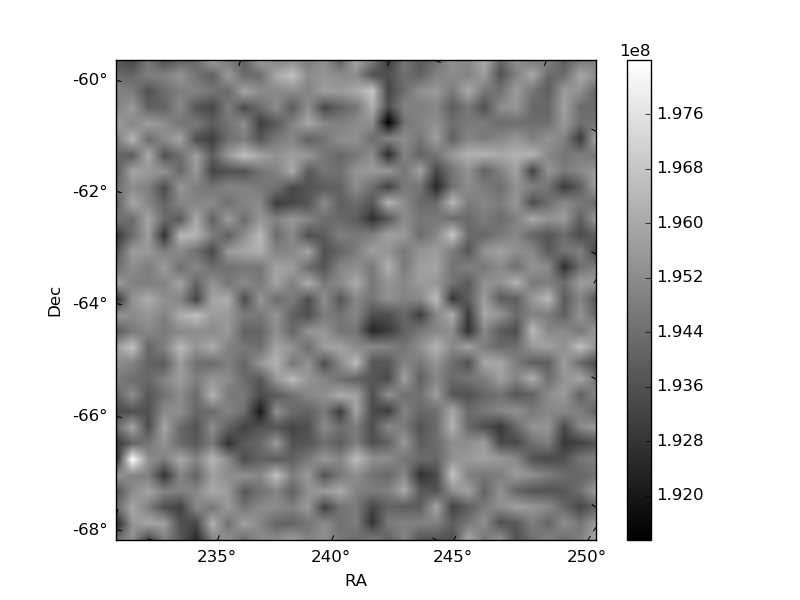
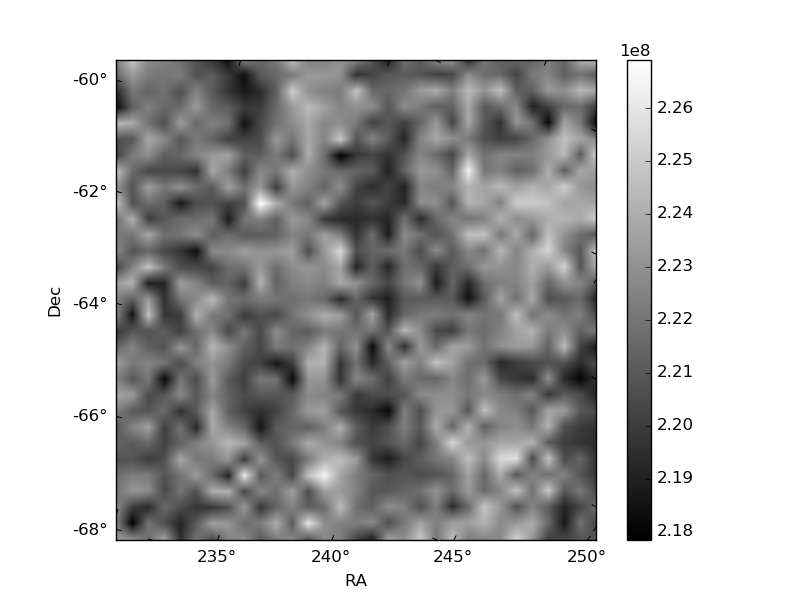
Histogram calculated using DETX and DETY for each event in the final _common_clean file
| Quadrant A | 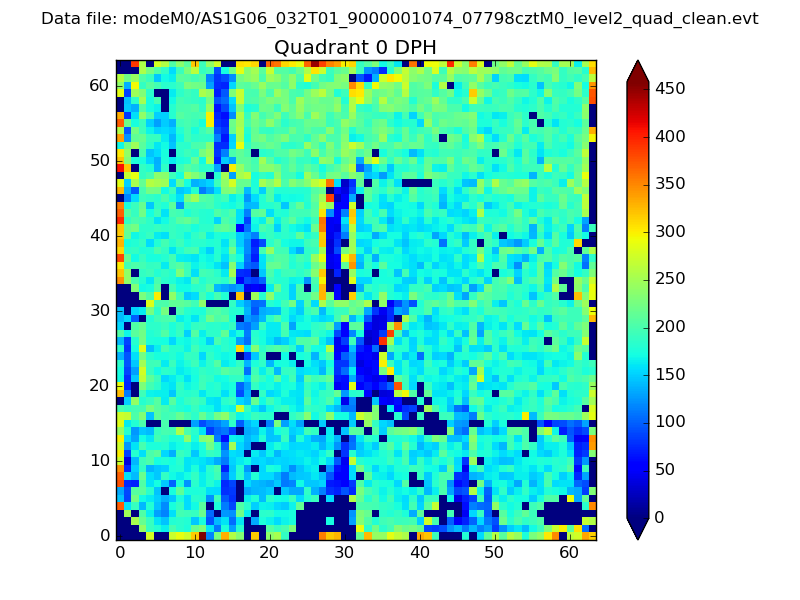 |
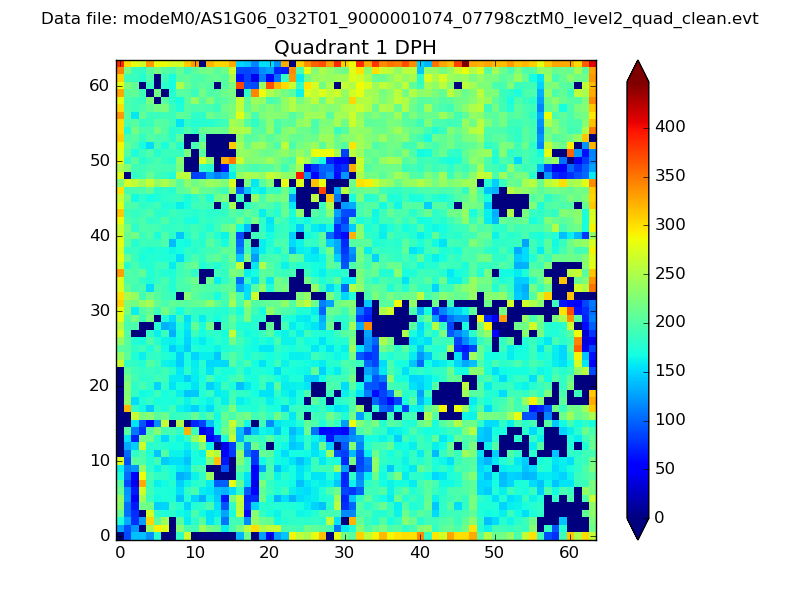 |
Quadrant B |
|---|---|---|---|
| Quadrant D | 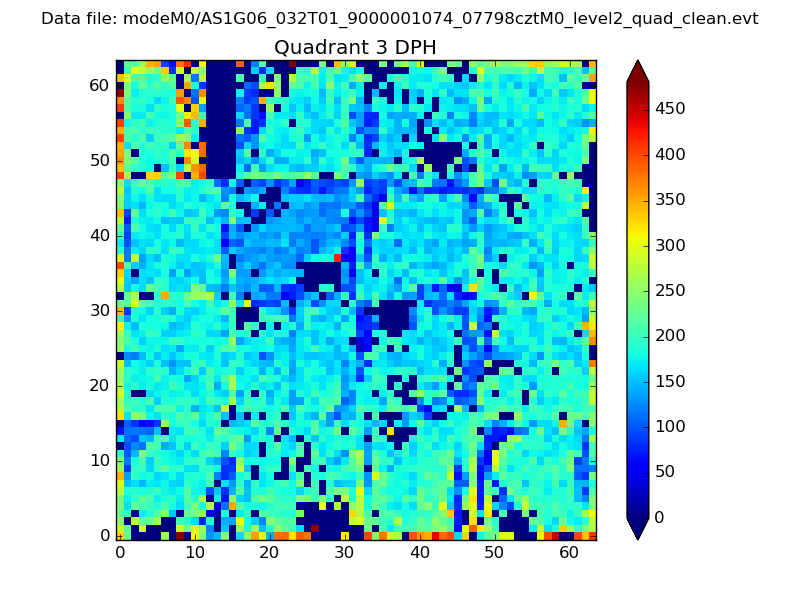 |
 |
Quadrant C |
| Plot type | Count rate plots | Images |
|---|---|---|
| Comparison with Poisson distribution Blue bars denote a histogram of data divided into 1 sec bins. Red curve is a Poisson curve with rate = median count rate of data. |
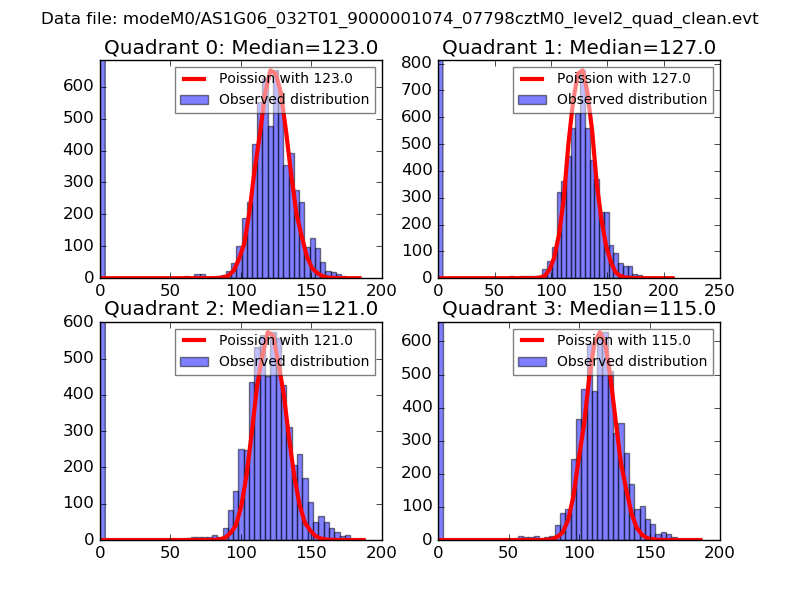 |
 |
| Quadrant-wise count rates Data is divided into 100 sec bins |
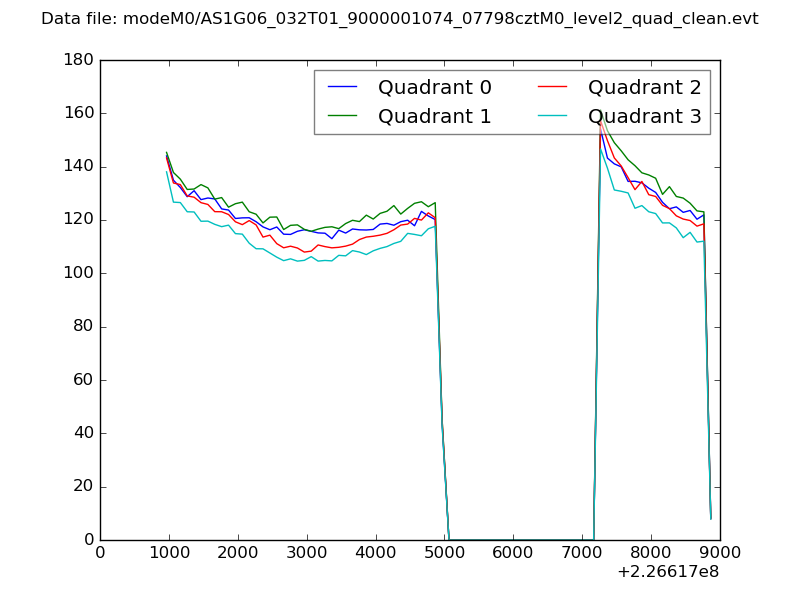 |
|
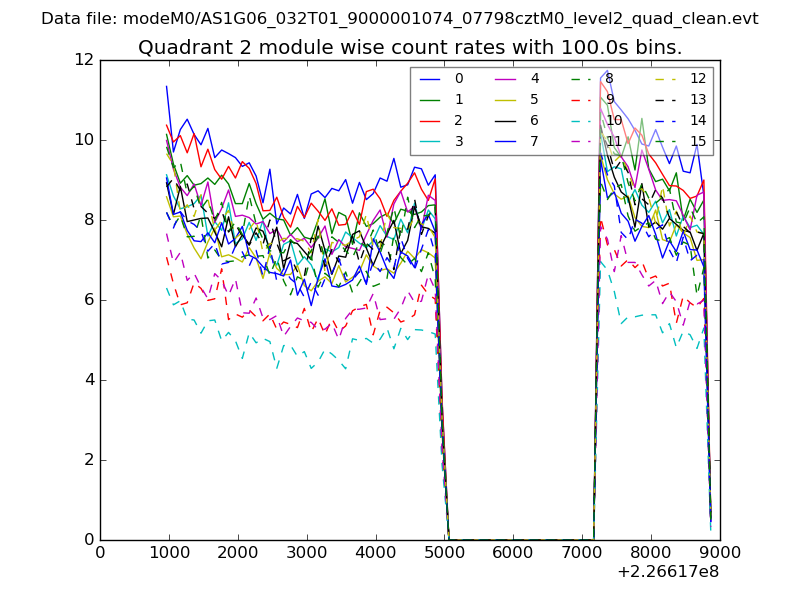
| Module-wise count rates for Quadrant A Data is divided into 100 sec bins |
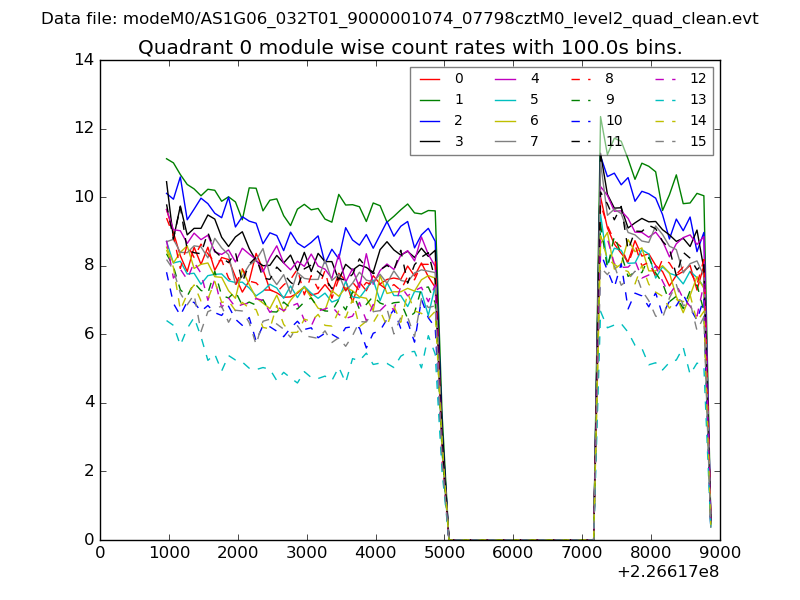 |
 |
| Module-wise count rates for Quadrant B Data is divided into 100 sec bins |
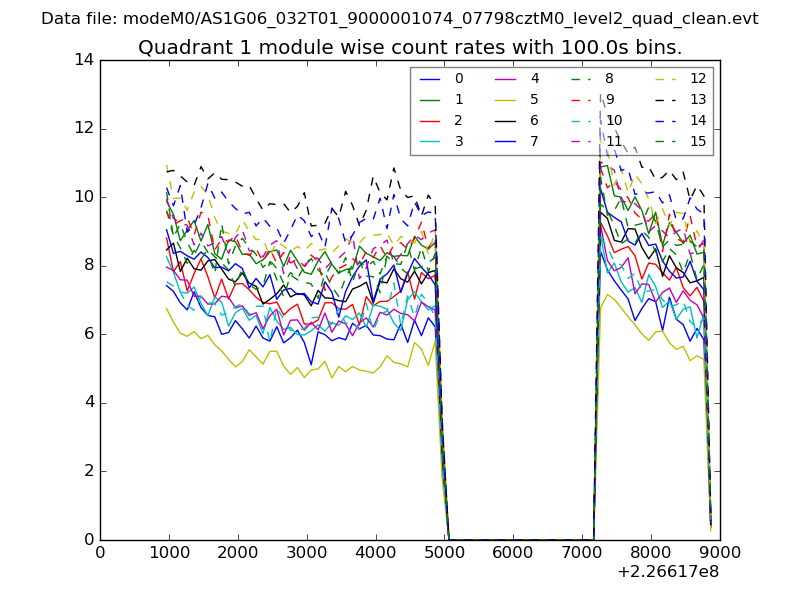 |
 |
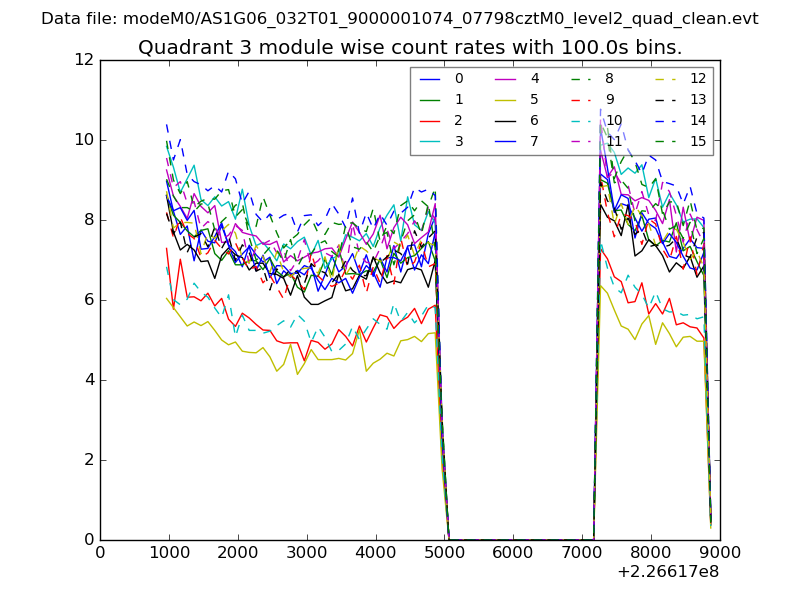
| Module-wise count rates for Quadrant C Data is divided into 100 sec bins |
 |
 |
| Module-wise count rates for Quadrant D Data is divided into 100 sec bins |
 |
 |
| Parameter | Plot |
|---|---|
| CZT HV Monitor | 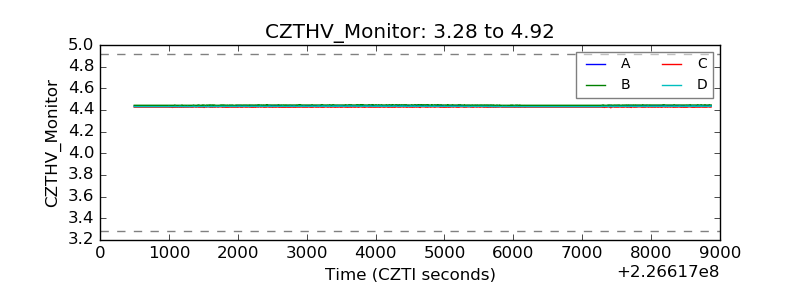 |
| D_VDD | 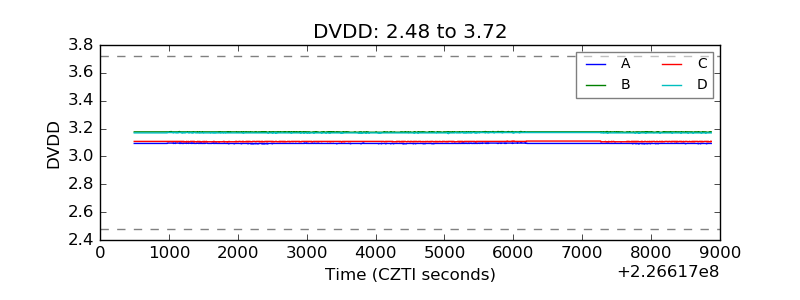 |
| Temperature 1 | 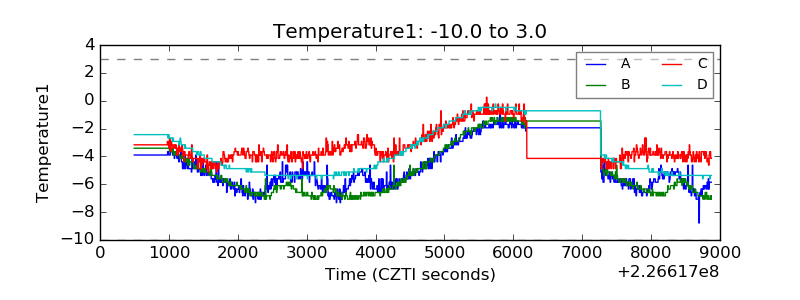 |
| Veto HV Monitor | 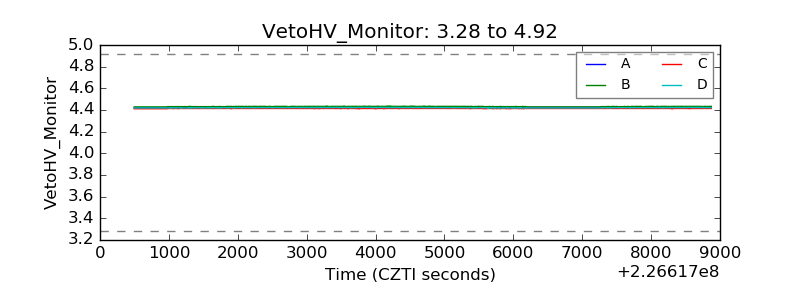 |
| Veto LLD | 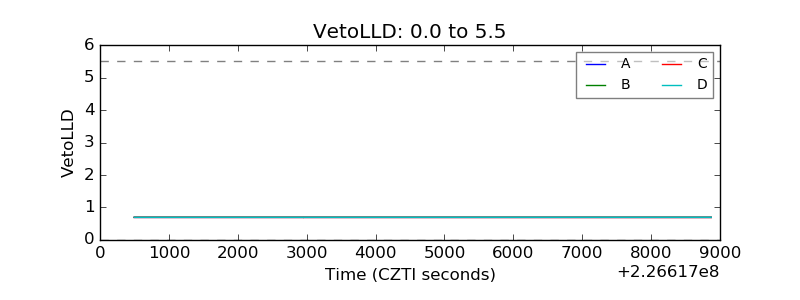 |
| Alpha Counter | 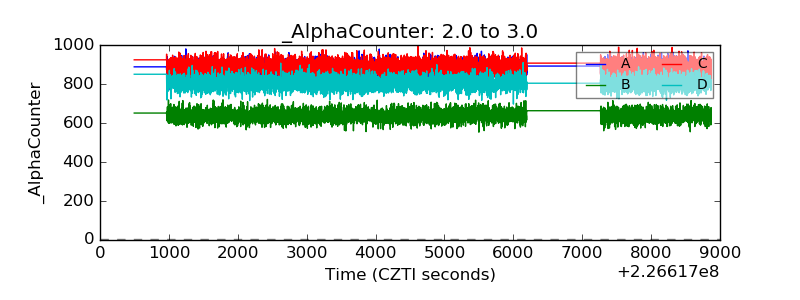 |
| _CPM_Rate | 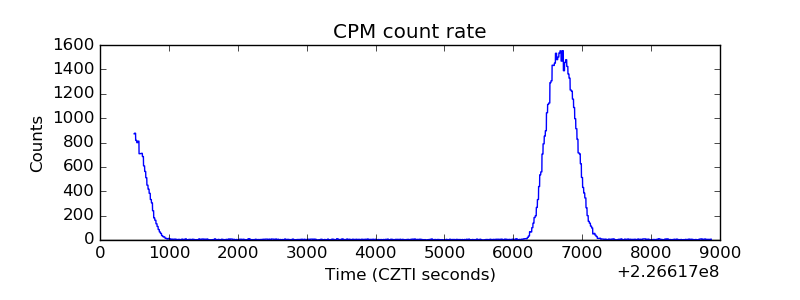 |
| CZT Counter |  |
| +2.5 Volts monitor | 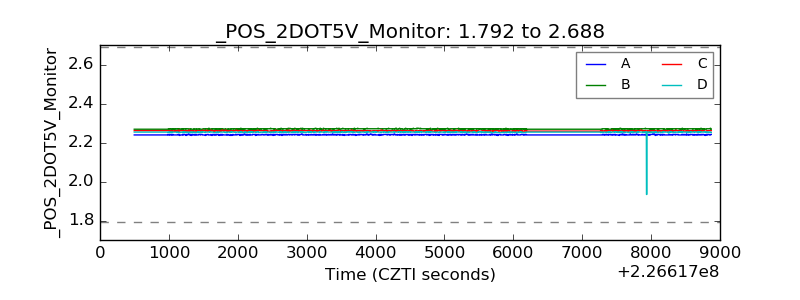 |
| +5 Volts monitor |  |
| _ROLL_ROT | 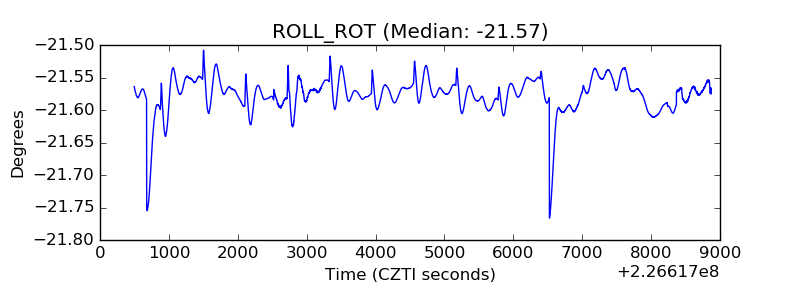 |
| _Roll_DEC | 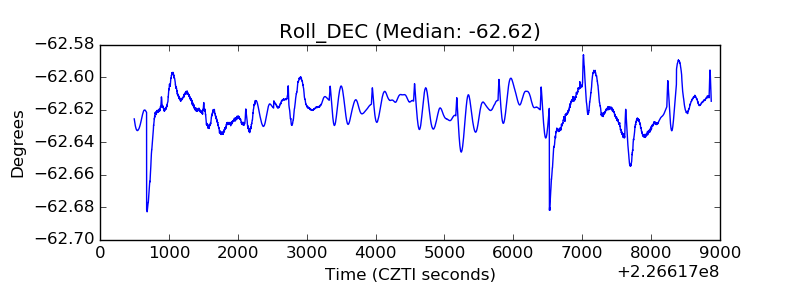 |
| _Roll_RA | 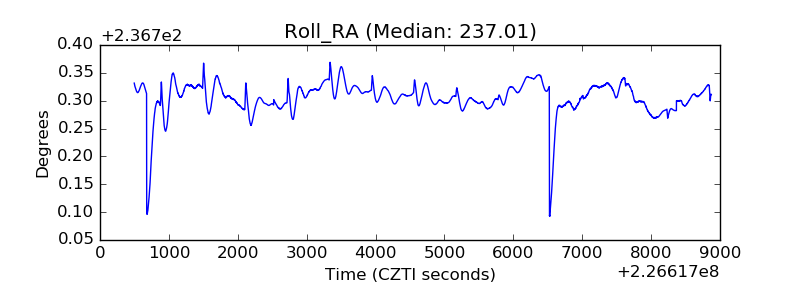 |
| Veto Counter | 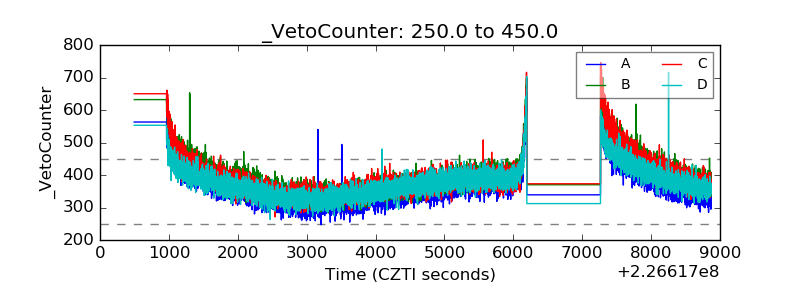 |