| Param | Original file | Final file |
|---|---|---|
| Filename | modeM0/AS1G06_032T01_9000001074_07799cztM0_level2.evt | modeM0/AS1G06_032T01_9000001074_07799cztM0_level2_quad_clean.evt |
| Size (bytes) | 435,384,000 | 103,026,240 |
| Size | 415.2 MB | 98.3 MB |
| Events in quadrant A | 3,048,243 | 669,189 |
| Events in quadrant B | 3,168,010 | 697,323 |
| Events in quadrant C | 3,217,897 | 663,990 |
| Events in quadrant D | 3,302,482 | 629,195 |
| Mode M0 | |||
|---|---|---|---|
| Quadrant | BADHDUFLAG | Total packets | Discarded packets |
| A | 0 | 13450 | 3 |
| B | 0 | 13776 | 2 |
| C | 0 | 13910 | 2 |
| D | 0 | 14381 | 2 |
| Mode M9 | |||
|---|---|---|---|
| Quadrant | BADHDUFLAG | Total packets | Discarded packets |
| A | 0 | 19 | 0 |
| B | 0 | 19 | 0 |
| C | 0 | 19 | 0 |
| D | 0 | 20 | 0 |
| Mode SS | |||
|---|---|---|---|
| Quadrant | BADHDUFLAG | Total packets | Discarded packets |
| A | 0 | 134 | 0 |
| B | 0 | 134 | 0 |
| C | 0 | 134 | 0 |
| D | 0 | 134 | 0 |
| Quadrant | Total seconds | Saturated seconds | Saturation percentage |
|---|---|---|---|
| A | 6605 | 14 | 0.211961% |
| B | 6605 | 25 | 0.378501% |
| C | 6605 | 26 | 0.393641% |
| D | 6605 | 41 | 0.620742% |
Noise dominated data is calculated using 1-second bins in cleaned event files. If a bin has >2000 counts, and if more than 50% of those come from <1% of pixels, then it is considered to be noise-dominated and hence unusable.
| Quadrant | # 1 sec bins | Bins with >0 counts | Bins with >2000 counts | High rate bins dominated by noise | Noise dominated (total time) | Noise dominated (detector-on time) | Marked lightcurve |
|---|---|---|---|---|---|---|---|
| A | 7790 | 6606 | 5 | 5 | 0.06% | 0.08% | 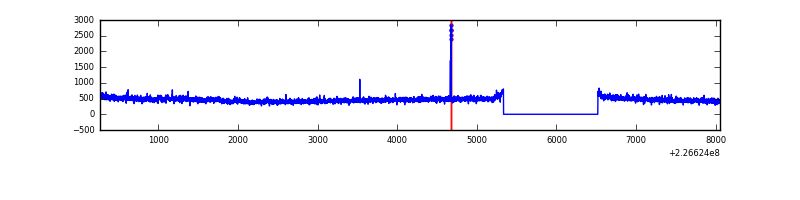 |
| B | 7790 | 6605 | 1 | 1 | 0.01% | 0.02% | 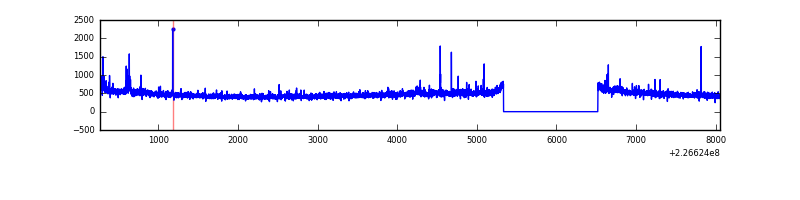 |
| C | 7790 | 6606 | 17 | 17 | 0.22% | 0.26% | 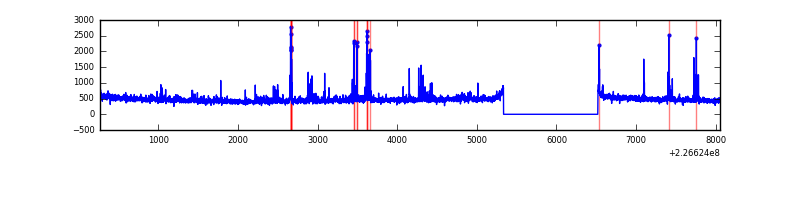 |
| D | 7790 | 6605 | 31 | 31 | 0.40% | 0.47% | 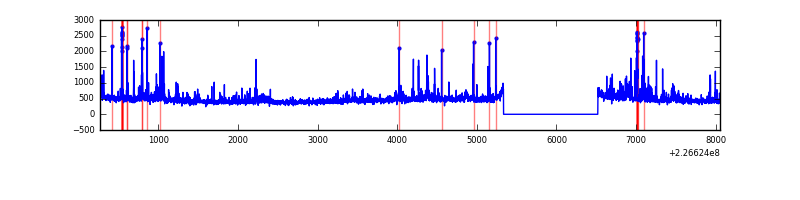 |
Top three noisy pixels from each quadrant. If the there are fewer than three noisy pixels in the level2.evt file, extra rows are filled as -1
| Pixel properties | Quadrant properties | ||||||
|---|---|---|---|---|---|---|---|
| Quadrant | DetID | PixID | Counts | Sigma | Mean | Median | Sigma |
| A | 15 | 239 | 63677 | 400.64 | 771 | 755 | 157.1 |
| A | 8 | 255 | 15916 | 96.53 | 771 | 755 | 157.1 |
| A | 0 | 226 | 7166 | 40.82 | 771 | 755 | 157.1 |
| B | 4 | 173 | 30491 | 202.64 | 789 | 773 | 146.7 |
| B | 0 | 214 | 25763 | 170.4 | 789 | 773 | 146.7 |
| B | 12 | 111 | 14503 | 93.62 | 789 | 773 | 146.7 |
| C | 4 | 254 | 138775 | 784.79 | 763 | 768 | 175.9 |
| C | 9 | 243 | 88954 | 501.48 | 763 | 768 | 175.9 |
| C | 1 | 16 | 10622 | 56.04 | 763 | 768 | 175.9 |
| D | 2 | 152 | 353155 | 1939.37 | 749 | 727 | 181.7 |
| D | 13 | 137 | 37292 | 201.21 | 749 | 727 | 181.7 |
| D | 12 | 221 | 31850 | 171.27 | 749 | 727 | 181.7 |
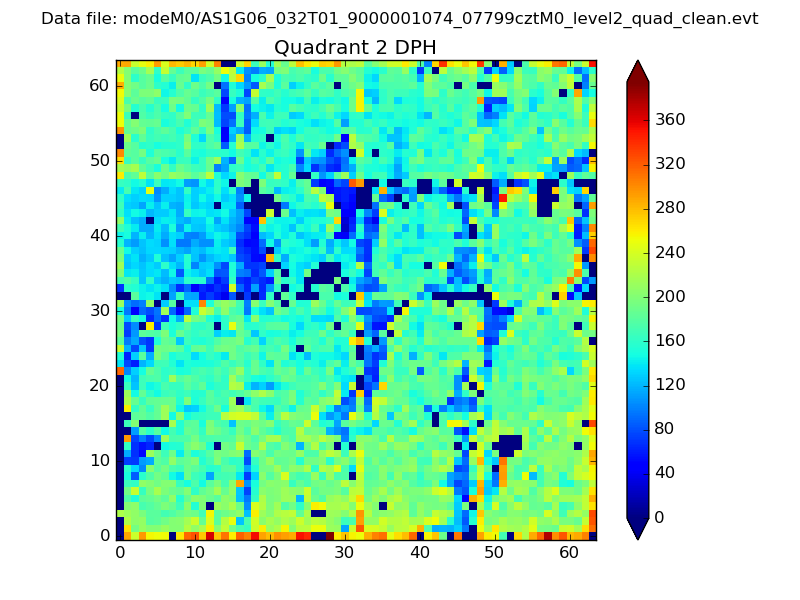
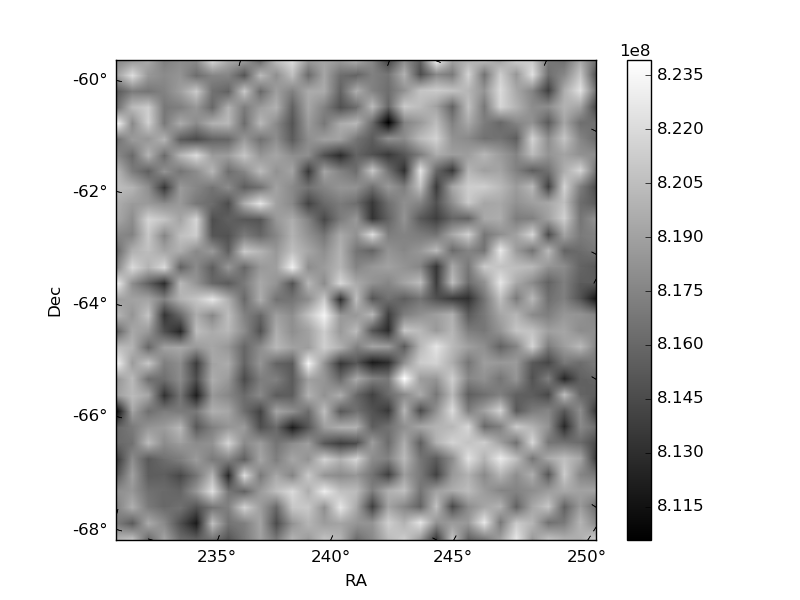
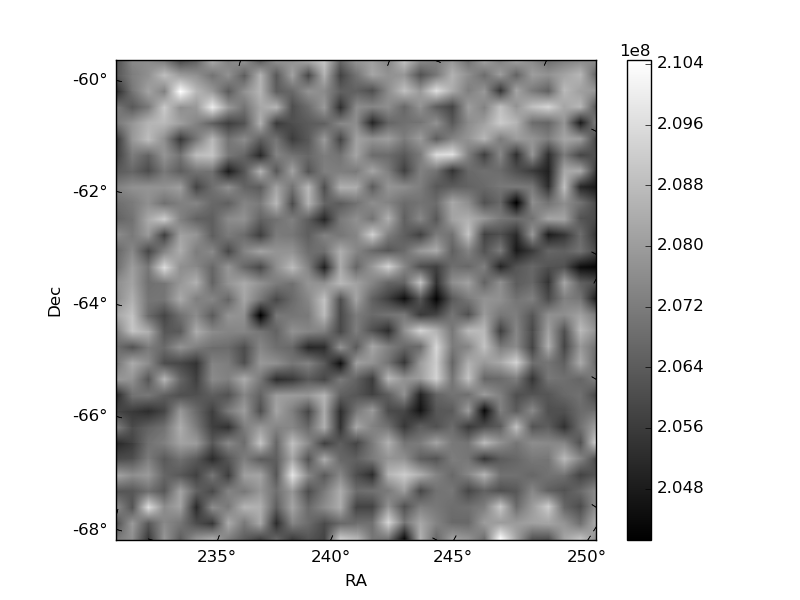
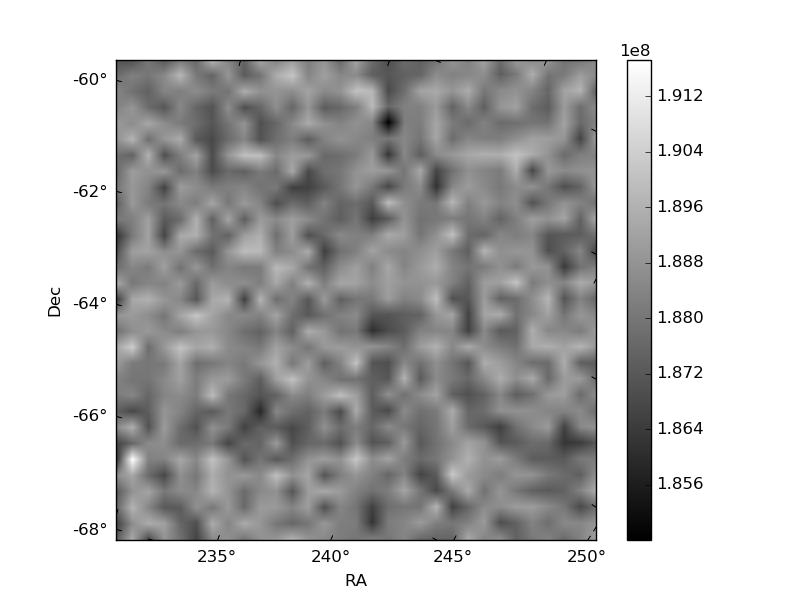
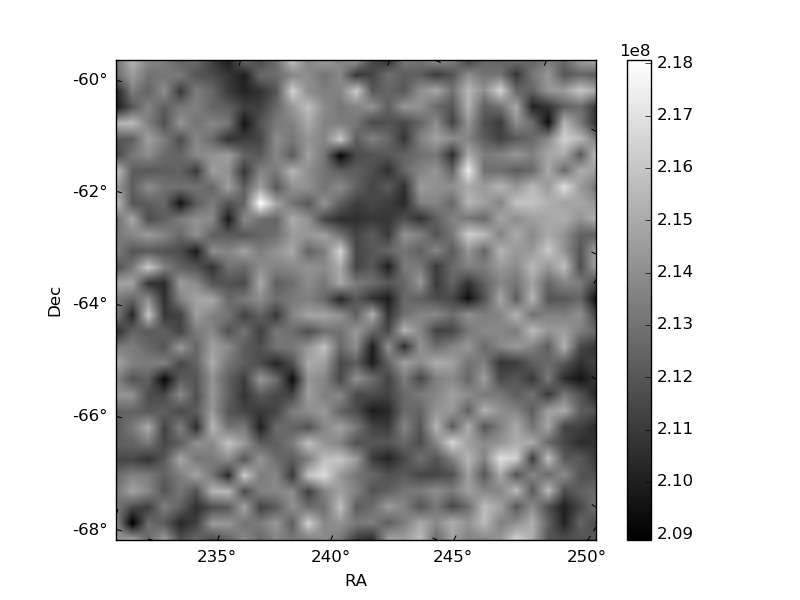
Histogram calculated using DETX and DETY for each event in the final _common_clean file
| Quadrant A | 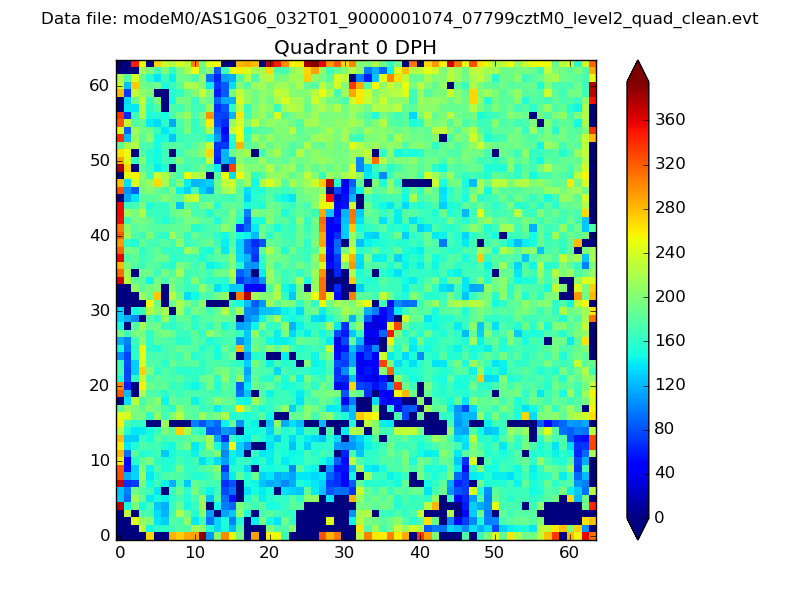 |
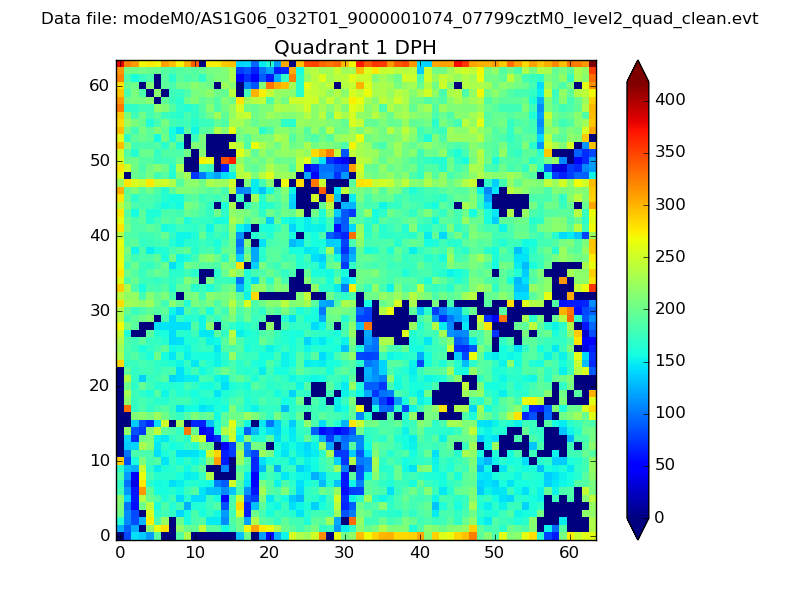 |
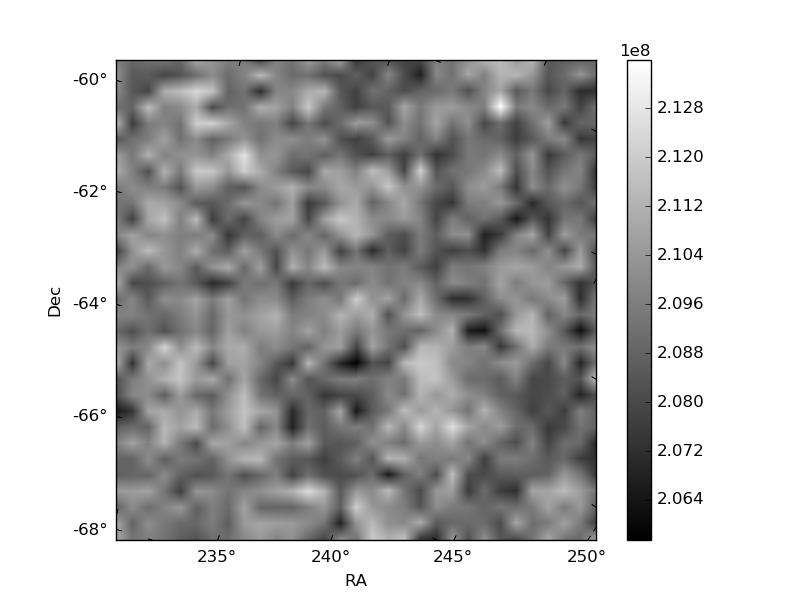
Quadrant B |
|---|---|---|---|
| Quadrant D | 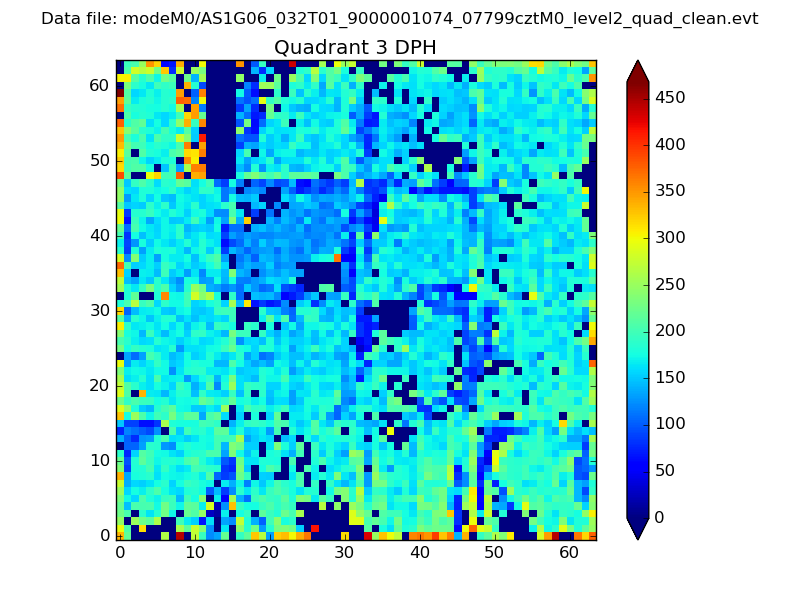 |
 |
Quadrant C |
| Plot type | Count rate plots | Images |
|---|---|---|
| Comparison with Poisson distribution Blue bars denote a histogram of data divided into 1 sec bins. Red curve is a Poisson curve with rate = median count rate of data. |
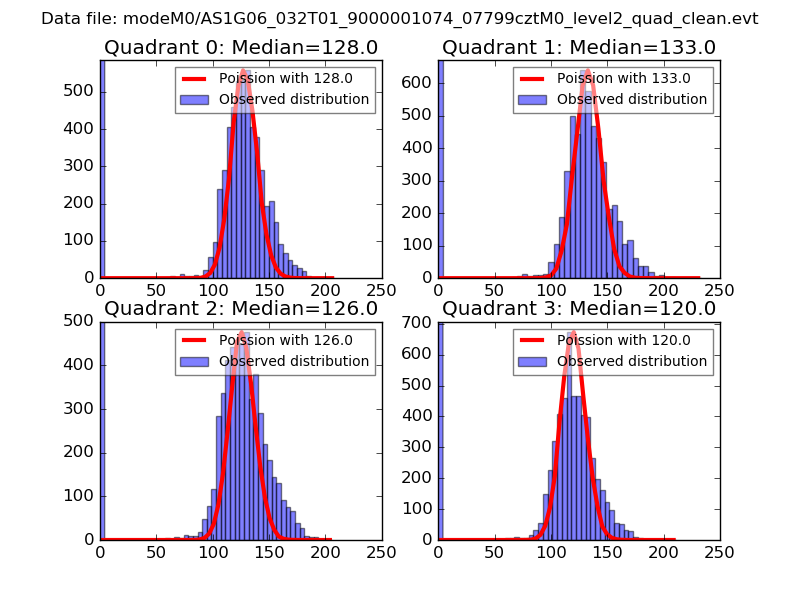 |
 |
| Quadrant-wise count rates Data is divided into 100 sec bins |
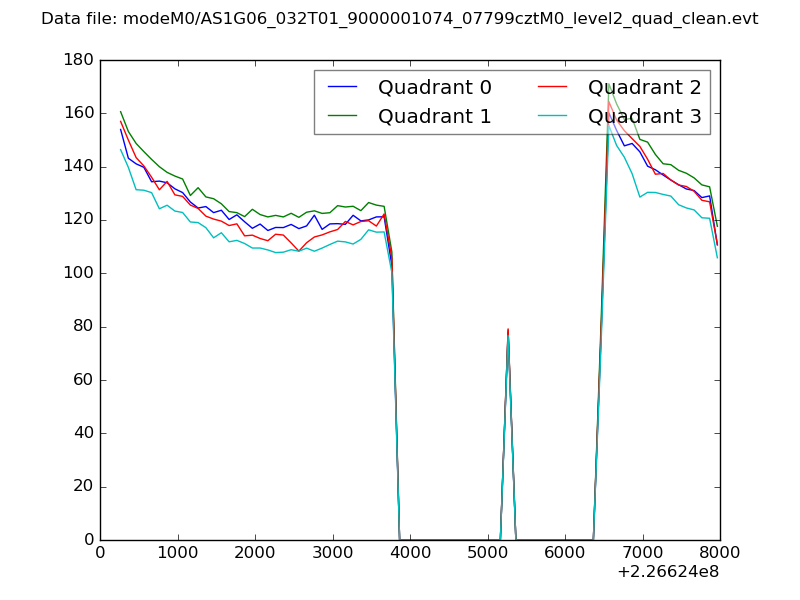 |
|
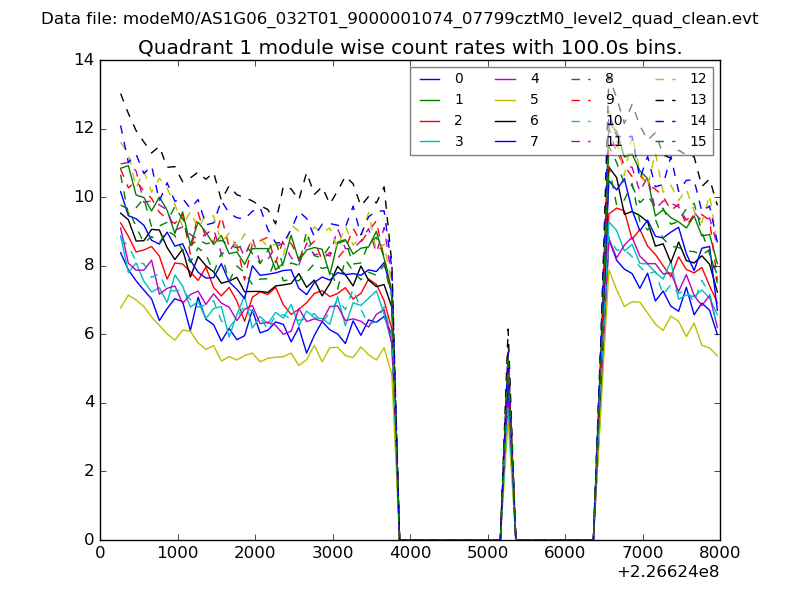
| Module-wise count rates for Quadrant A Data is divided into 100 sec bins |
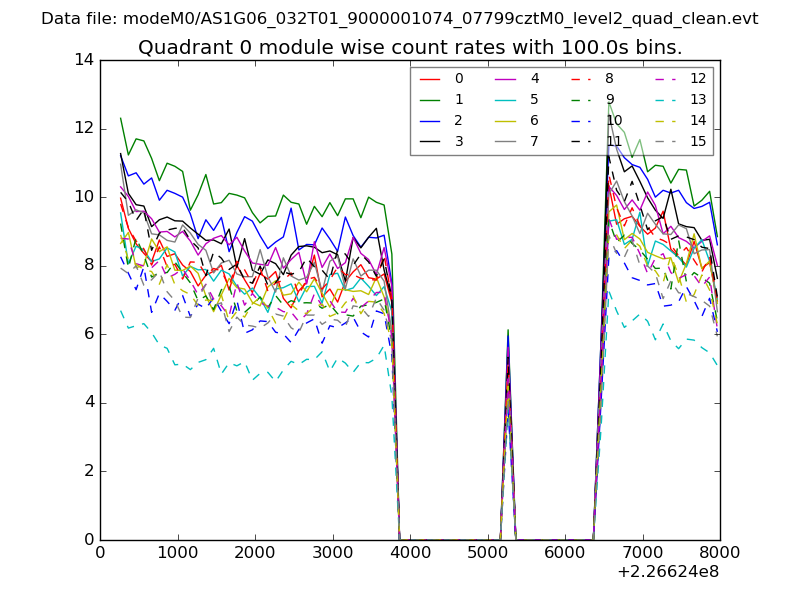 |
 |
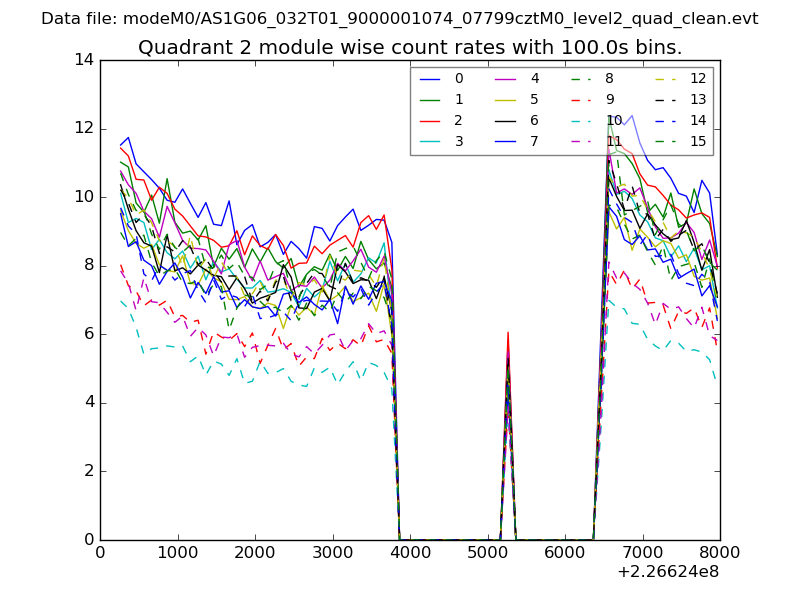
| Module-wise count rates for Quadrant B Data is divided into 100 sec bins |
 |
 |
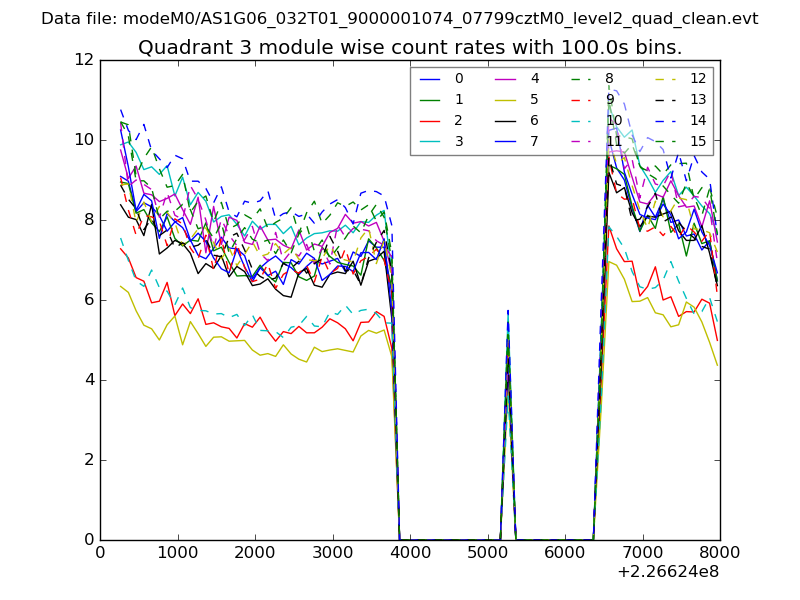
| Module-wise count rates for Quadrant C Data is divided into 100 sec bins |
 |
 |
| Module-wise count rates for Quadrant D Data is divided into 100 sec bins |
 |
 |
| Parameter | Plot |
|---|---|
| CZT HV Monitor | 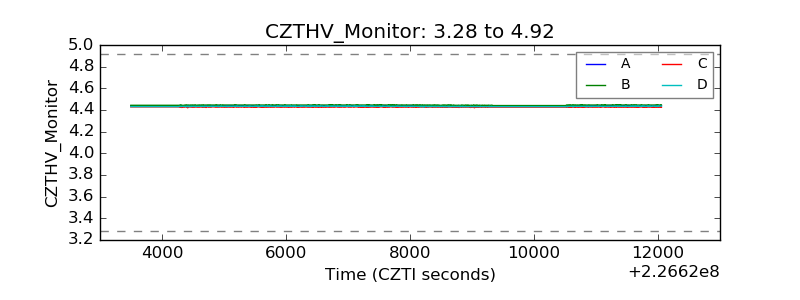 |
| D_VDD | 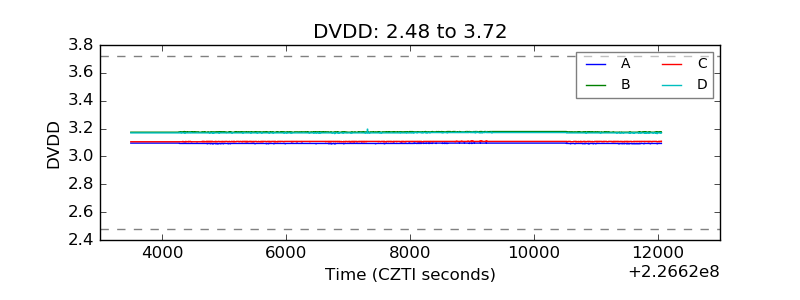 |
| Temperature 1 | 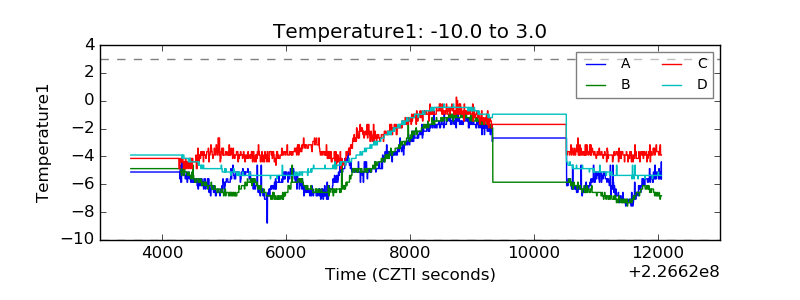 |
| Veto HV Monitor | 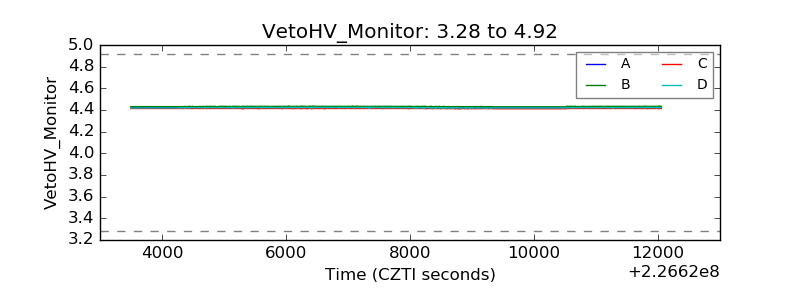 |
| Veto LLD | 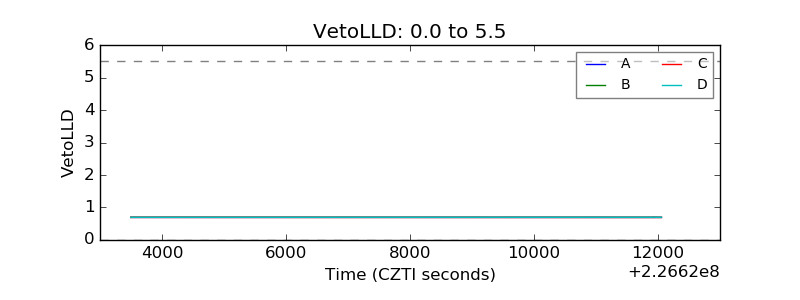 |
| Alpha Counter | 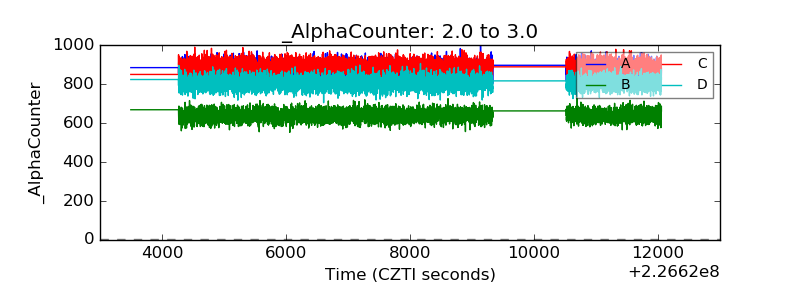 |
| _CPM_Rate |  |
| CZT Counter |  |
| +2.5 Volts monitor | 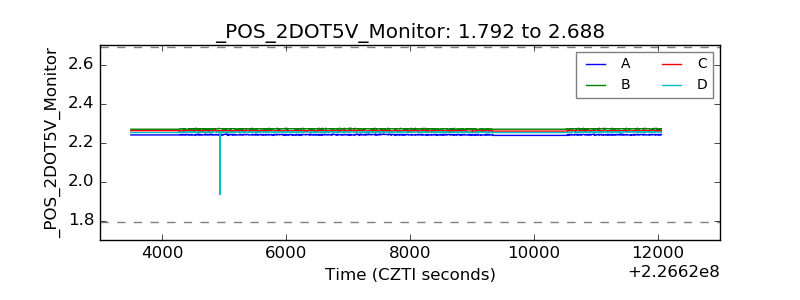 |
| +5 Volts monitor |  |
| _ROLL_ROT | 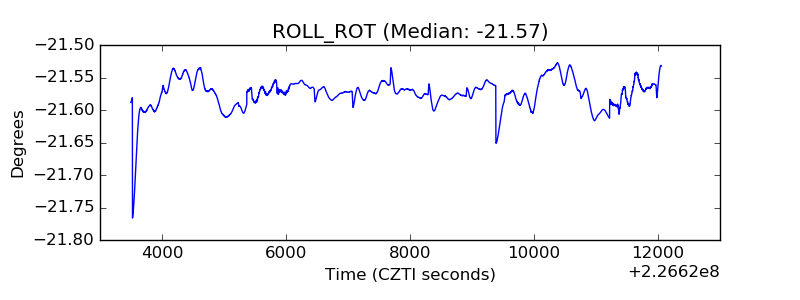 |
| _Roll_DEC | 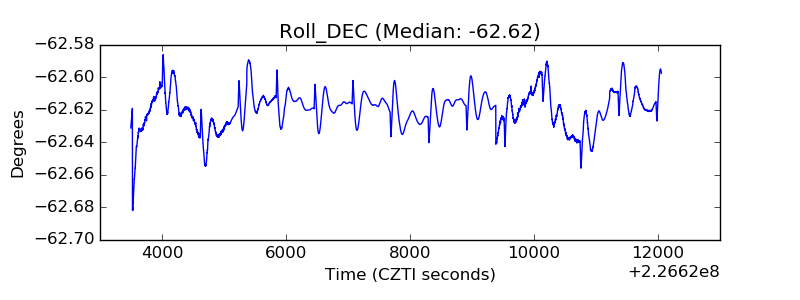 |
| _Roll_RA | 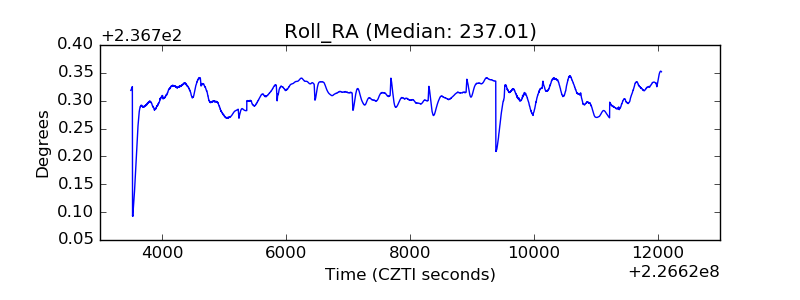 |
| Veto Counter | 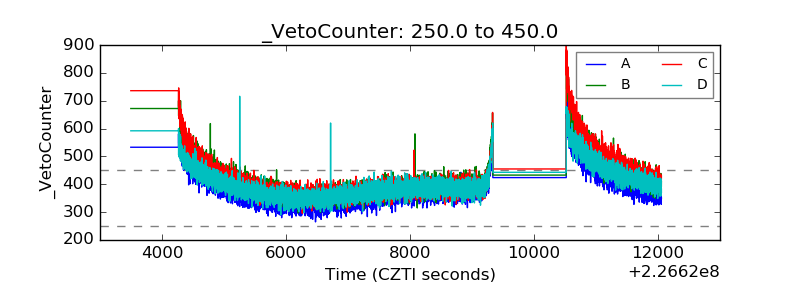 |