| Param | Original file | Final file |
|---|---|---|
| Filename | modeM0/AS1G06_032T01_9000001074_07800cztM0_level2.evt | modeM0/AS1G06_032T01_9000001074_07800cztM0_level2_quad_clean.evt |
| Size (bytes) | 436,216,320 | 105,180,480 |
| Size | 416.0 MB | 100.3 MB |
| Events in quadrant A | 2,979,263 | 684,773 |
| Events in quadrant B | 3,159,081 | 717,124 |
| Events in quadrant C | 3,385,402 | 686,828 |
| Events in quadrant D | 3,246,003 | 644,264 |
| Mode M0 | |||
|---|---|---|---|
| Quadrant | BADHDUFLAG | Total packets | Discarded packets |
| A | 0 | 13192 | 3 |
| B | 0 | 13539 | 2 |
| C | 0 | 14262 | 2 |
| D | 0 | 14126 | 2 |
| Mode M9 | |||
|---|---|---|---|
| Quadrant | BADHDUFLAG | Total packets | Discarded packets |
| A | 0 | 23 | 0 |
| B | 0 | 23 | 0 |
| C | 0 | 23 | 0 |
| D | 0 | 23 | 0 |
| Mode SS | |||
|---|---|---|---|
| Quadrant | BADHDUFLAG | Total packets | Discarded packets |
| A | 0 | 130 | 0 |
| B | 0 | 130 | 0 |
| C | 0 | 130 | 0 |
| D | 0 | 130 | 0 |
| Quadrant | Total seconds | Saturated seconds | Saturation percentage |
|---|---|---|---|
| A | 6486 | 7 | 0.107925% |
| B | 6486 | 18 | 0.277521% |
| C | 6486 | 48 | 0.740056% |
| D | 6486 | 74 | 1.140919% |
Noise dominated data is calculated using 1-second bins in cleaned event files. If a bin has >2000 counts, and if more than 50% of those come from <1% of pixels, then it is considered to be noise-dominated and hence unusable.
| Quadrant | # 1 sec bins | Bins with >0 counts | Bins with >2000 counts | High rate bins dominated by noise | Noise dominated (total time) | Noise dominated (detector-on time) | Marked lightcurve |
|---|---|---|---|---|---|---|---|
| A | 7761 | 6487 | 0 | 0 | 0.00% | 0.00% | 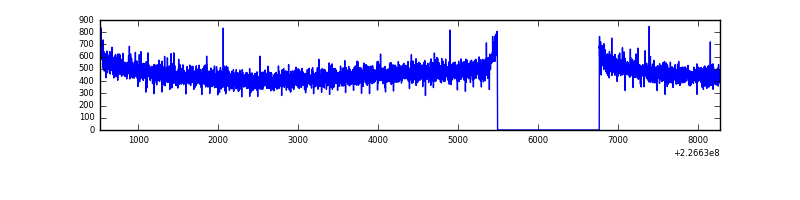 |
| B | 7761 | 6487 | 0 | 0 | 0.00% | 0.00% | 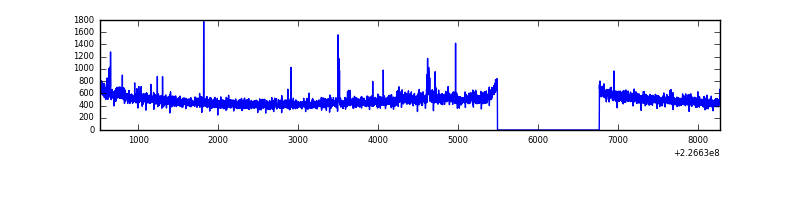 |
| C | 7761 | 6487 | 37 | 37 | 0.48% | 0.57% |  |
| D | 7761 | 6487 | 62 | 62 | 0.80% | 0.96% | 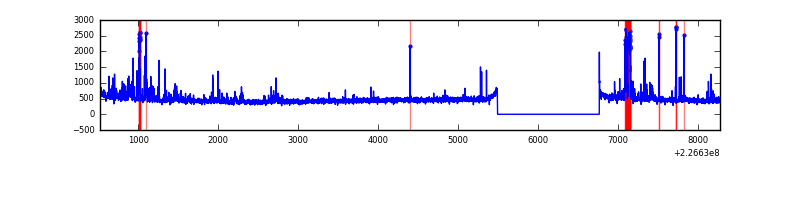 |
Top three noisy pixels from each quadrant. If the there are fewer than three noisy pixels in the level2.evt file, extra rows are filled as -1
| Pixel properties | Quadrant properties | ||||||
|---|---|---|---|---|---|---|---|
| Quadrant | DetID | PixID | Counts | Sigma | Mean | Median | Sigma |
| A | 0 | 226 | 7089 | 40.45 | 772 | 755 | 156.6 |
| A | 12 | 194 | 6794 | 38.57 | 772 | 755 | 156.6 |
| A | 13 | 14 | 4545 | 24.2 | 772 | 755 | 156.6 |
| B | 0 | 214 | 22644 | 147.91 | 793 | 775 | 147.9 |
| B | 4 | 81 | 22444 | 146.55 | 793 | 775 | 147.9 |
| B | 0 | 219 | 18461 | 119.62 | 793 | 775 | 147.9 |
| C | 4 | 254 | 352926 | 1977.75 | 771 | 776 | 178.1 |
| C | 1 | 16 | 13557 | 71.78 | 771 | 776 | 178.1 |
| C | 9 | 243 | 6462 | 31.93 | 771 | 776 | 178.1 |
| D | 2 | 152 | 238679 | 1305.34 | 756 | 732 | 182.3 |
| D | 2 | 14 | 130727 | 713.13 | 756 | 732 | 182.3 |
| D | 13 | 104 | 21060 | 111.52 | 756 | 732 | 182.3 |
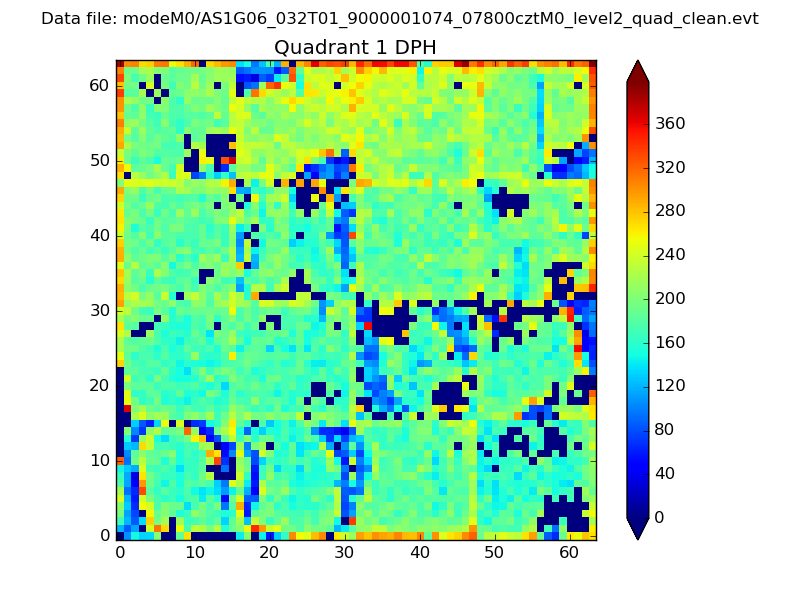
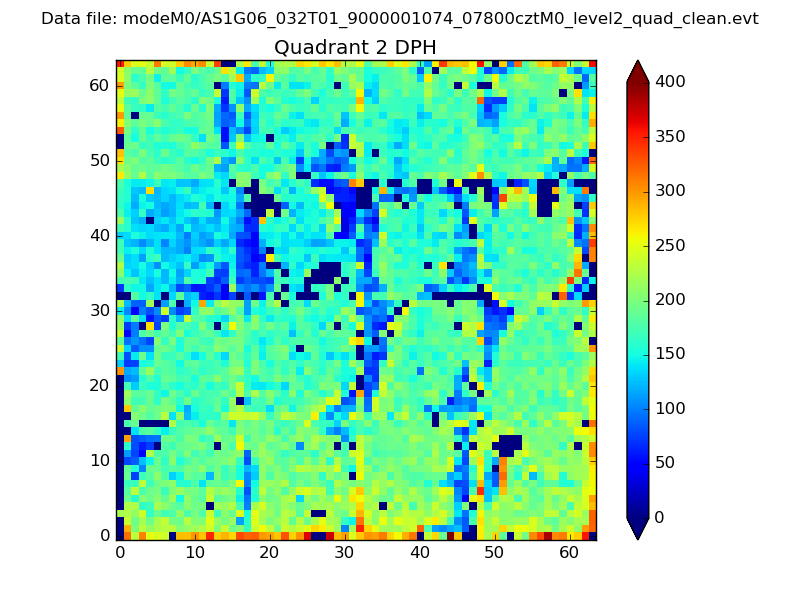
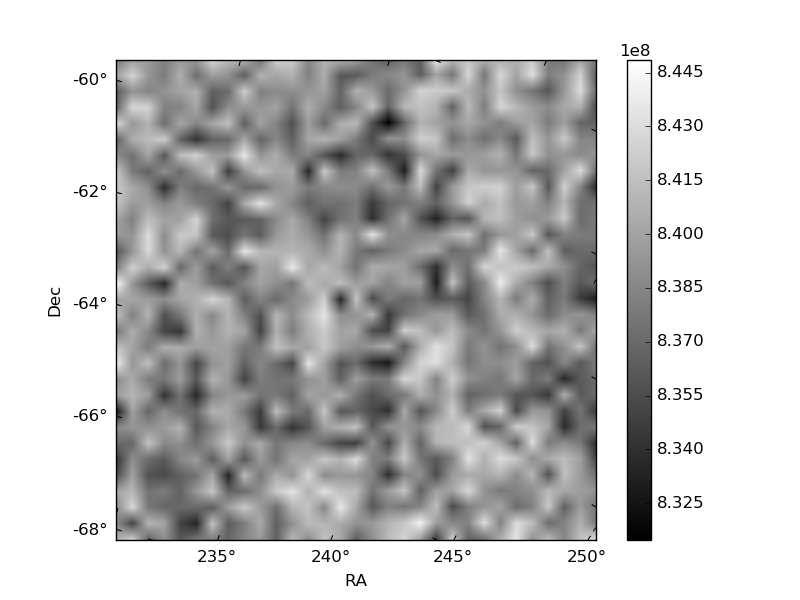
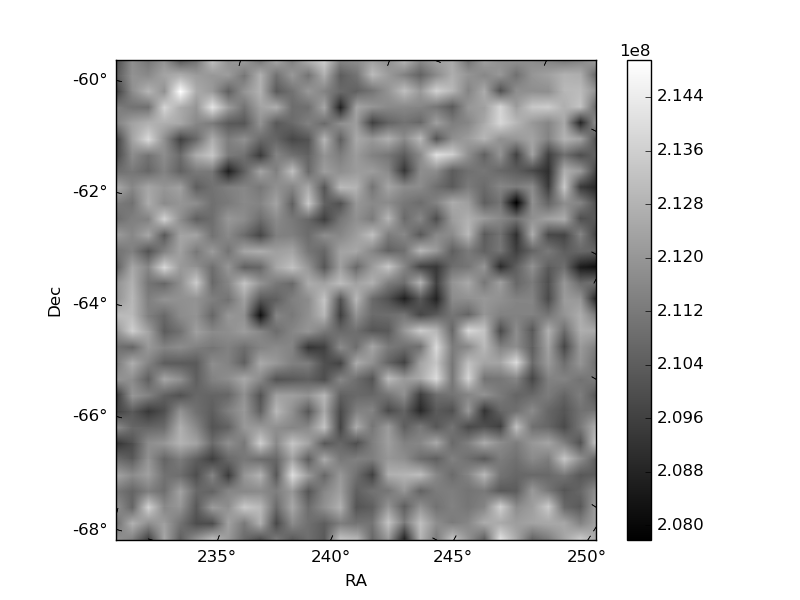
Histogram calculated using DETX and DETY for each event in the final _common_clean file
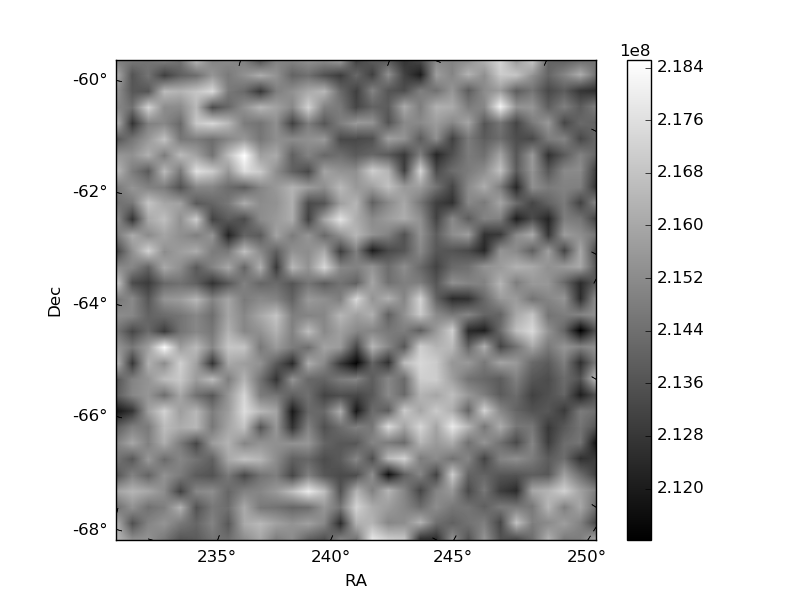
| Quadrant A | 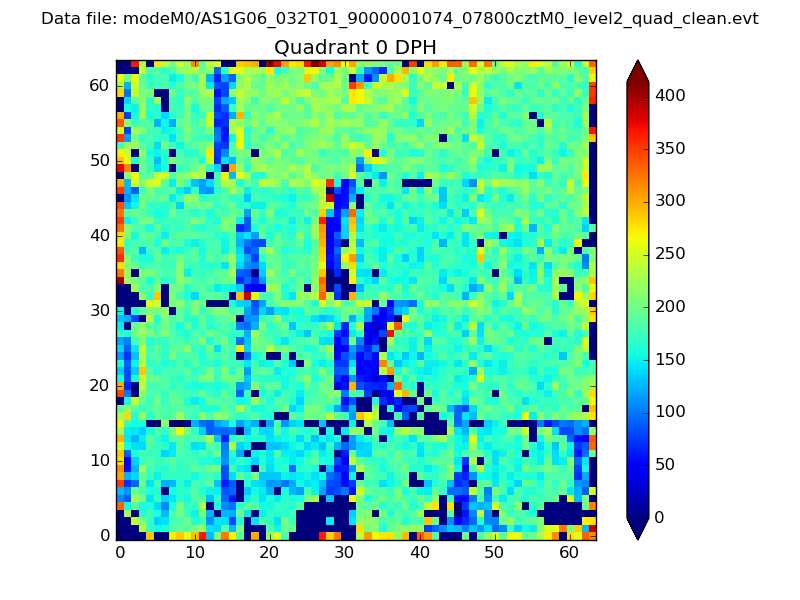 |
 |
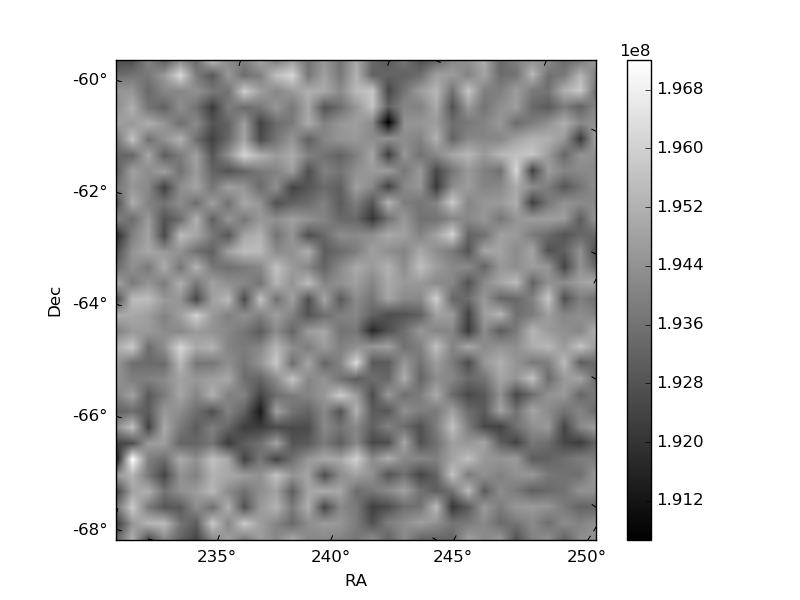
Quadrant B |
|---|---|---|---|
| Quadrant D | 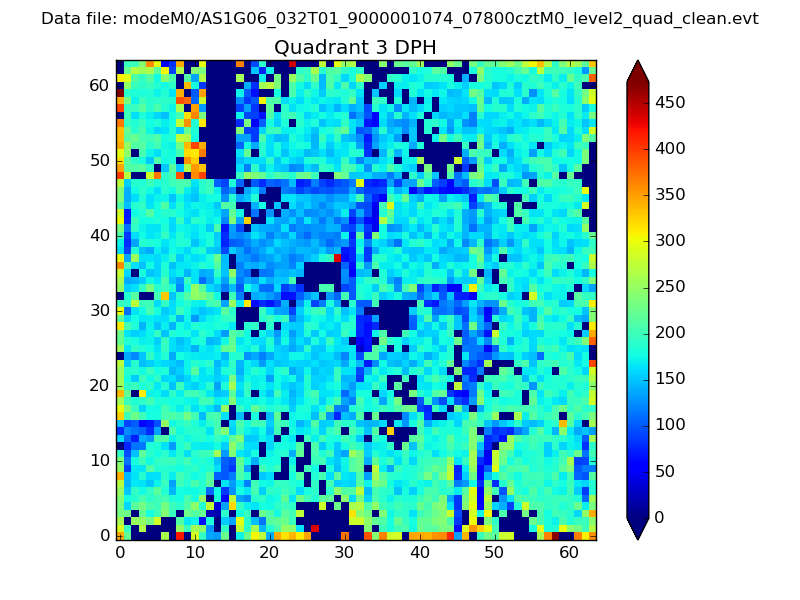 |
 |
Quadrant C |
| Plot type | Count rate plots | Images |
|---|---|---|
| Comparison with Poisson distribution Blue bars denote a histogram of data divided into 1 sec bins. Red curve is a Poisson curve with rate = median count rate of data. |
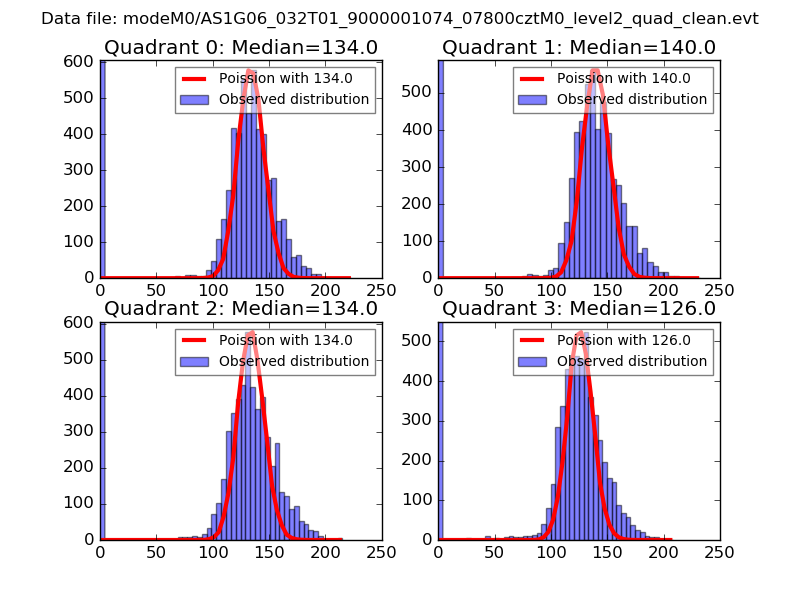 |
 |
| Quadrant-wise count rates Data is divided into 100 sec bins |
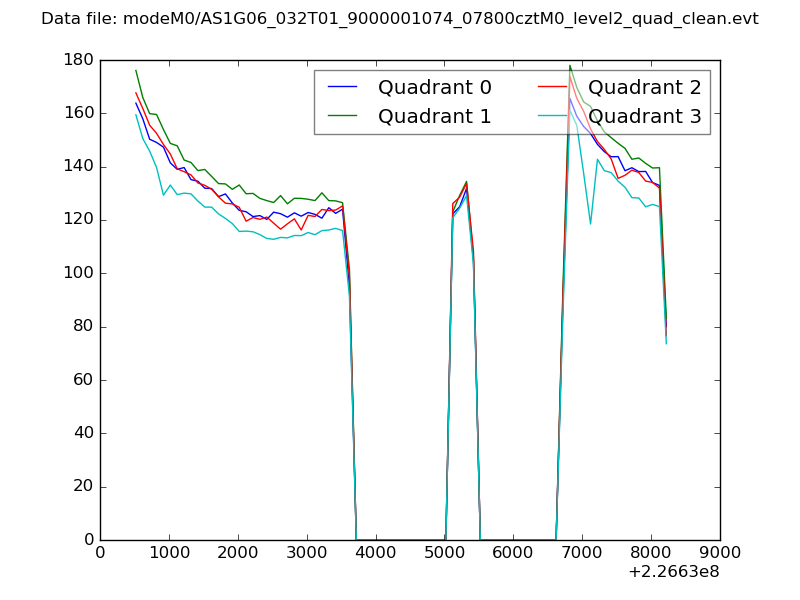 |
|
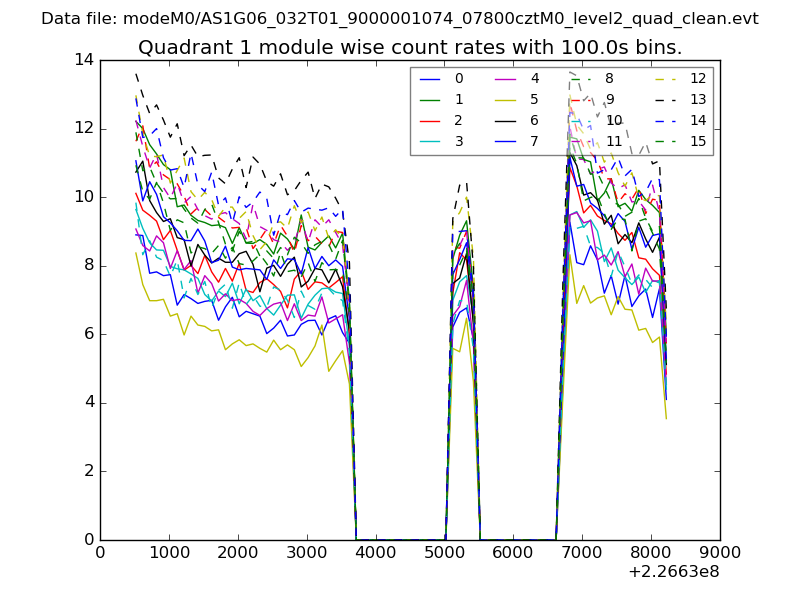
| Module-wise count rates for Quadrant A Data is divided into 100 sec bins |
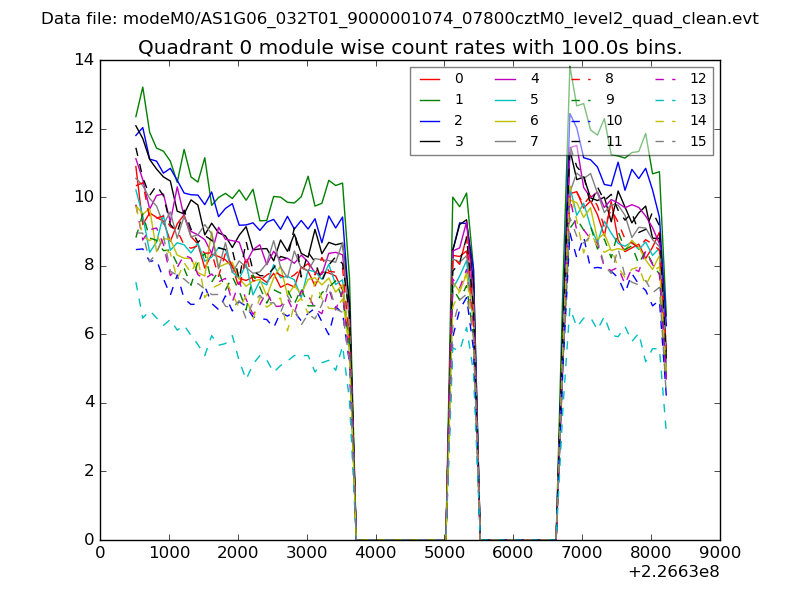 |
 |
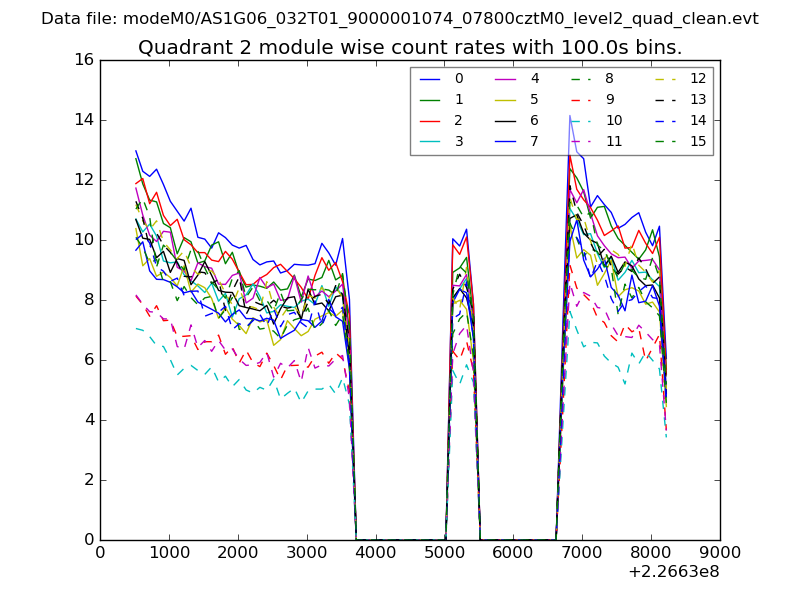
| Module-wise count rates for Quadrant B Data is divided into 100 sec bins |
 |
 |
| Module-wise count rates for Quadrant C Data is divided into 100 sec bins |
 |
 |
| Module-wise count rates for Quadrant D Data is divided into 100 sec bins |
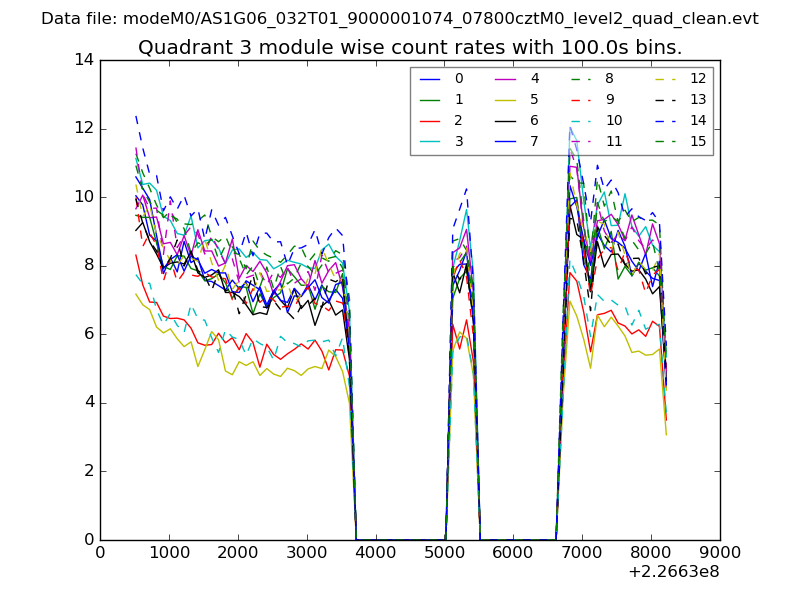 |
 |
| Parameter | Plot |
|---|---|
| CZT HV Monitor | 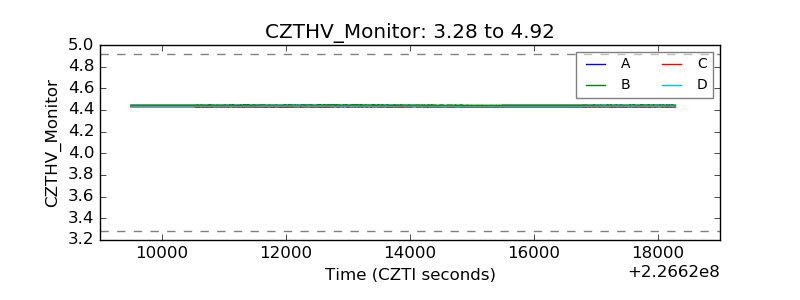 |
| D_VDD | 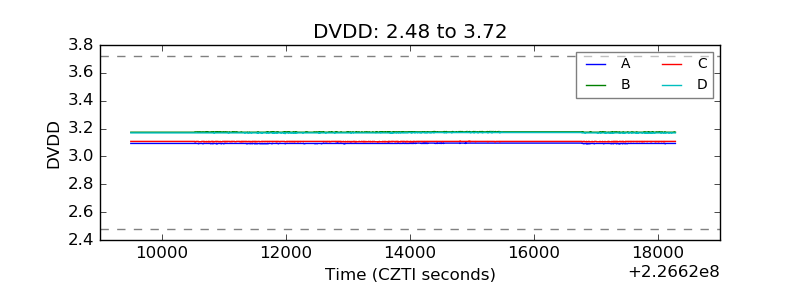 |
| Temperature 1 | 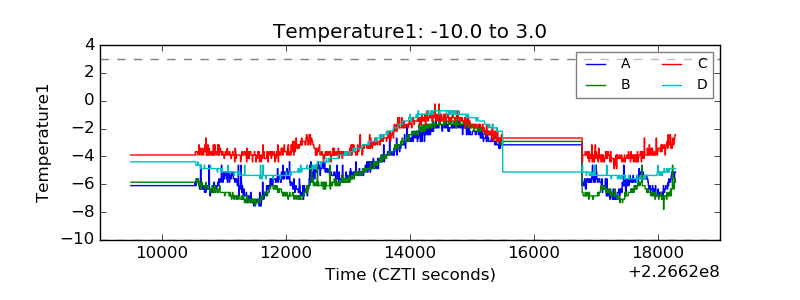 |
| Veto HV Monitor | 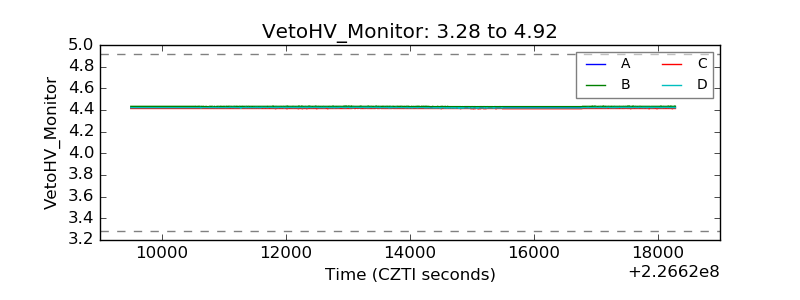 |
| Veto LLD | 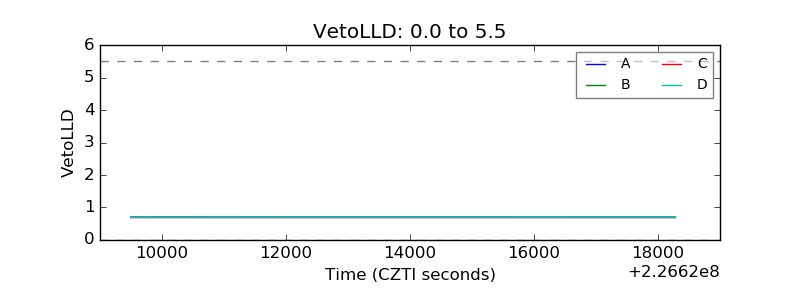 |
| Alpha Counter | 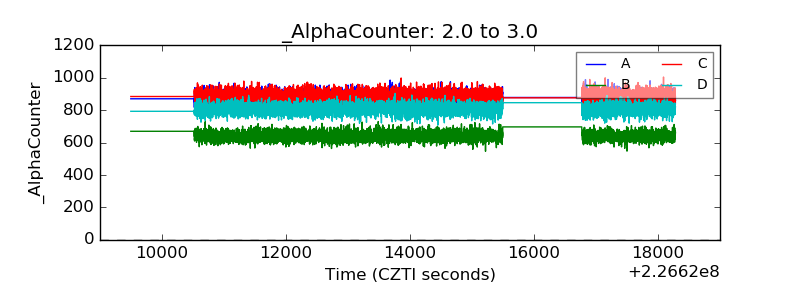 |
| _CPM_Rate | 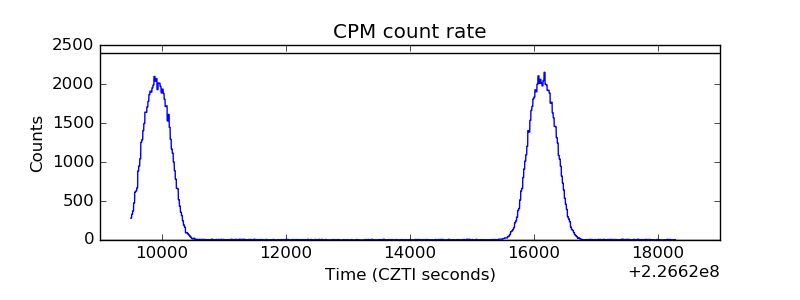 |
| CZT Counter | 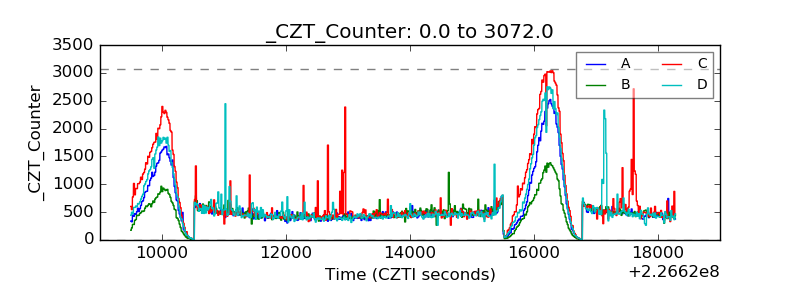 |
| +2.5 Volts monitor |  |
| +5 Volts monitor |  |
| _ROLL_ROT | 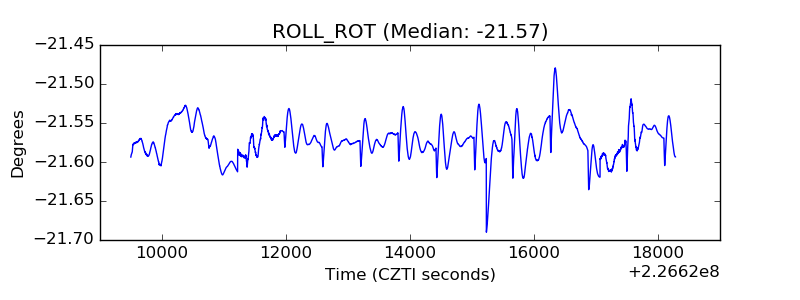 |
| _Roll_DEC | 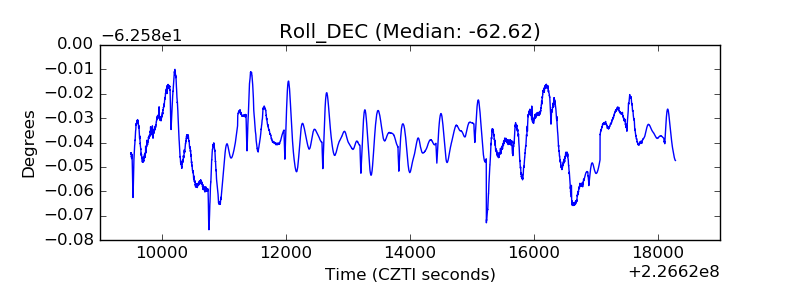 |
| _Roll_RA | 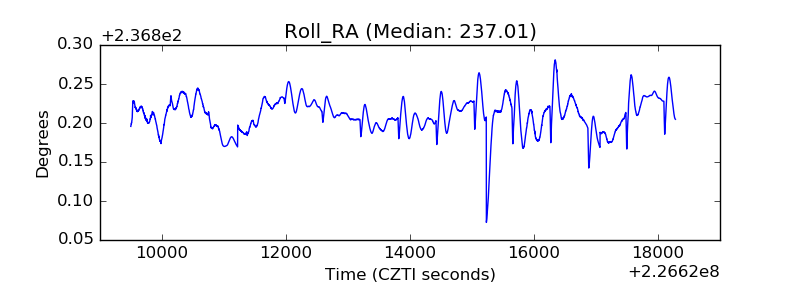 |
| Veto Counter | 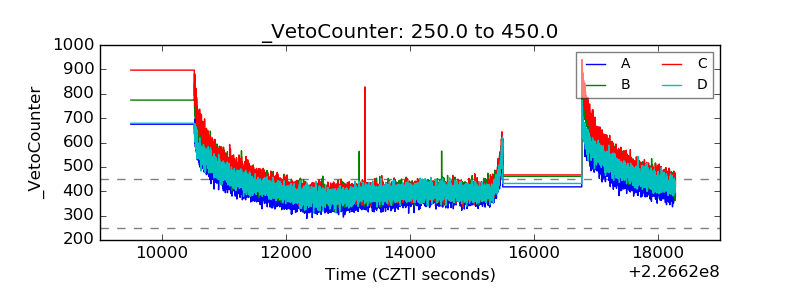 |