| Param | Original file | Final file |
|---|---|---|
| Filename | modeM0/AS1G06_032T01_9000001074_07801cztM0_level2.evt | modeM0/AS1G06_032T01_9000001074_07801cztM0_level2_quad_clean.evt |
| Size (bytes) | 437,993,280 | 105,966,720 |
| Size | 417.7 MB | 101.1 MB |
| Events in quadrant A | 3,008,670 | 687,741 |
| Events in quadrant B | 3,184,352 | 721,415 |
| Events in quadrant C | 3,383,971 | 697,348 |
| Events in quadrant D | 3,251,273 | 655,040 |
| Mode M0 | |||
|---|---|---|---|
| Quadrant | BADHDUFLAG | Total packets | Discarded packets |
| A | 0 | 13157 | 3 |
| B | 0 | 13444 | 2 |
| C | 0 | 14162 | 2 |
| D | 0 | 13990 | 2 |
| Mode M9 | |||
|---|---|---|---|
| Quadrant | BADHDUFLAG | Total packets | Discarded packets |
| A | 0 | 12 | 0 |
| B | 0 | 12 | 0 |
| C | 0 | 12 | 0 |
| D | 0 | 13 | 0 |
| Mode SS | |||
|---|---|---|---|
| Quadrant | BADHDUFLAG | Total packets | Discarded packets |
| A | 0 | 132 | 0 |
| B | 0 | 132 | 0 |
| C | 0 | 132 | 0 |
| D | 0 | 132 | 0 |
| Quadrant | Total seconds | Saturated seconds | Saturation percentage |
|---|---|---|---|
| A | 6412 | 45 | 0.701809% |
| B | 6412 | 61 | 0.951341% |
| C | 6412 | 74 | 1.154086% |
| D | 6412 | 88 | 1.372427% |
Noise dominated data is calculated using 1-second bins in cleaned event files. If a bin has >2000 counts, and if more than 50% of those come from <1% of pixels, then it is considered to be noise-dominated and hence unusable.
| Quadrant | # 1 sec bins | Bins with >0 counts | Bins with >2000 counts | High rate bins dominated by noise | Noise dominated (total time) | Noise dominated (detector-on time) | Marked lightcurve |
|---|---|---|---|---|---|---|---|
| A | 7662 | 6412 | 1 | 1 | 0.01% | 0.02% | 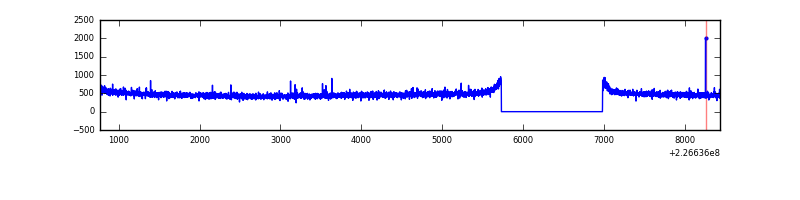 |
| B | 7662 | 6412 | 3 | 3 | 0.04% | 0.05% | 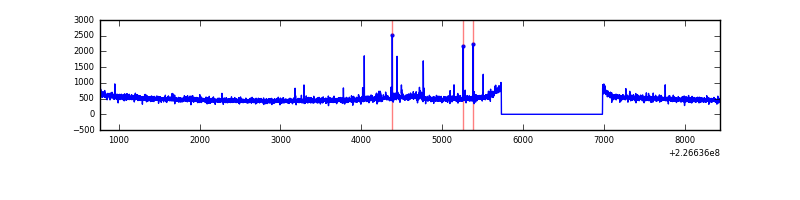 |
| C | 7662 | 6412 | 27 | 27 | 0.35% | 0.42% | 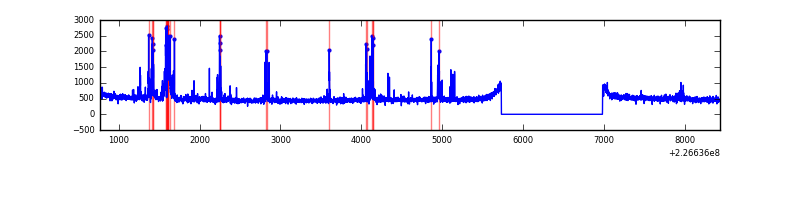 |
| D | 7662 | 6412 | 56 | 56 | 0.73% | 0.87% | 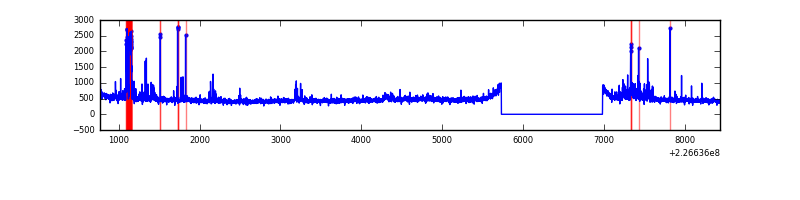 |
Top three noisy pixels from each quadrant. If the there are fewer than three noisy pixels in the level2.evt file, extra rows are filled as -1
| Pixel properties | Quadrant properties | ||||||
|---|---|---|---|---|---|---|---|
| Quadrant | DetID | PixID | Counts | Sigma | Mean | Median | Sigma |
| A | 0 | 226 | 7335 | 41.91 | 779 | 762 | 156.8 |
| A | 12 | 194 | 6886 | 39.05 | 779 | 762 | 156.8 |
| A | 13 | 248 | 5362 | 29.33 | 779 | 762 | 156.8 |
| B | 0 | 219 | 38311 | 254.5 | 797 | 778 | 147.5 |
| B | 0 | 214 | 17689 | 114.67 | 797 | 778 | 147.5 |
| B | 12 | 111 | 14398 | 92.35 | 797 | 778 | 147.5 |
| C | 4 | 254 | 297740 | 1657.35 | 784 | 789 | 179.2 |
| C | 1 | 16 | 13827 | 72.77 | 784 | 789 | 179.2 |
| C | 10 | 22 | 6866 | 33.92 | 784 | 789 | 179.2 |
| D | 2 | 152 | 181045 | 967.32 | 770 | 748 | 186.4 |
| D | 2 | 14 | 147227 | 785.88 | 770 | 748 | 186.4 |
| D | 2 | 234 | 17205 | 88.29 | 770 | 748 | 186.4 |
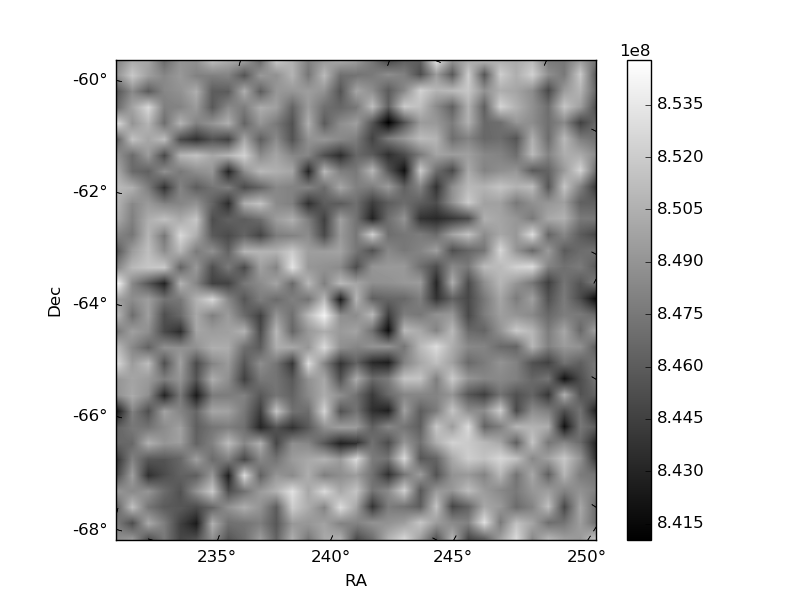
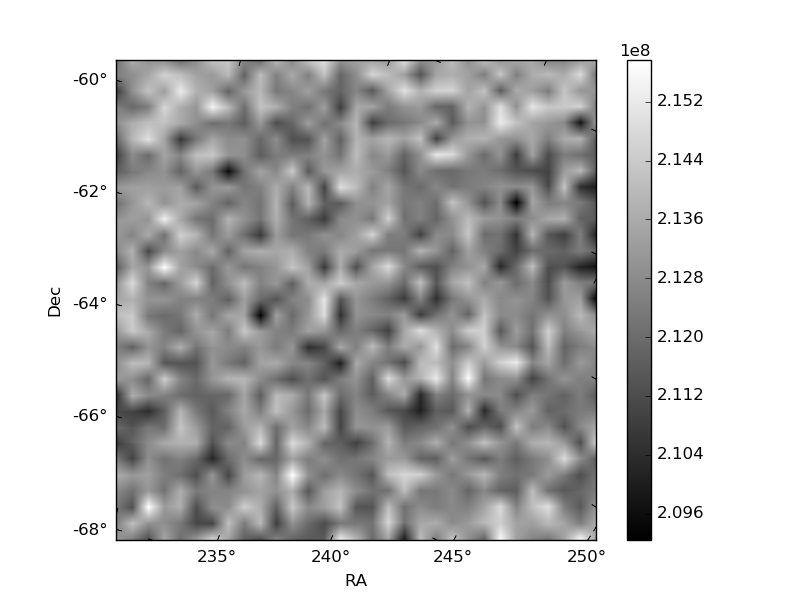
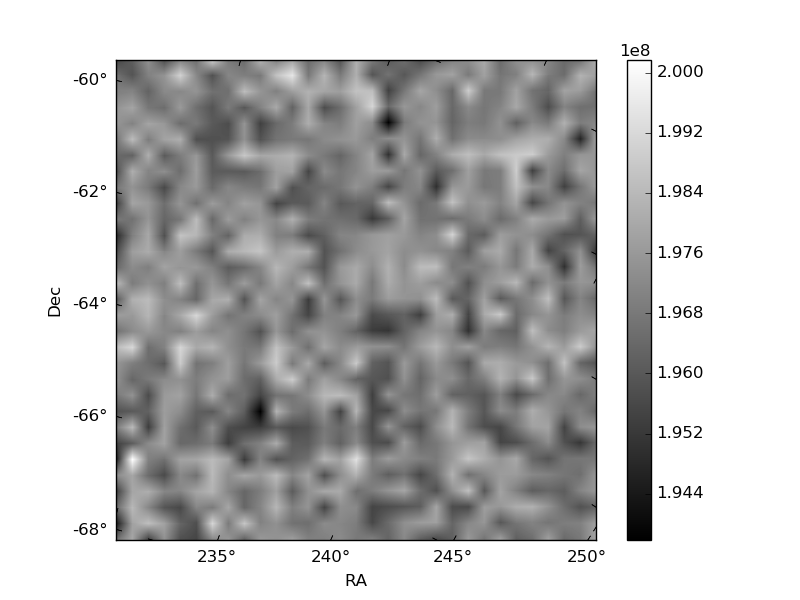
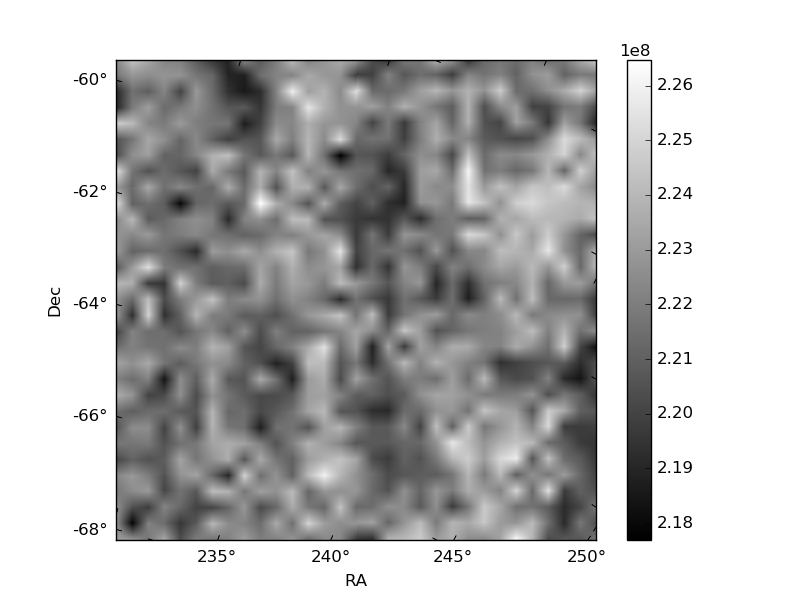
Histogram calculated using DETX and DETY for each event in the final _common_clean file
| Quadrant A | 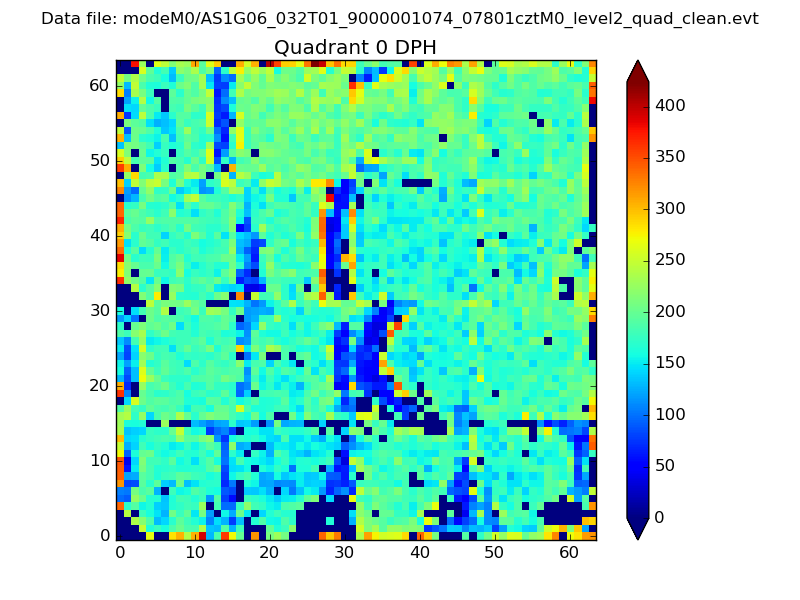 |
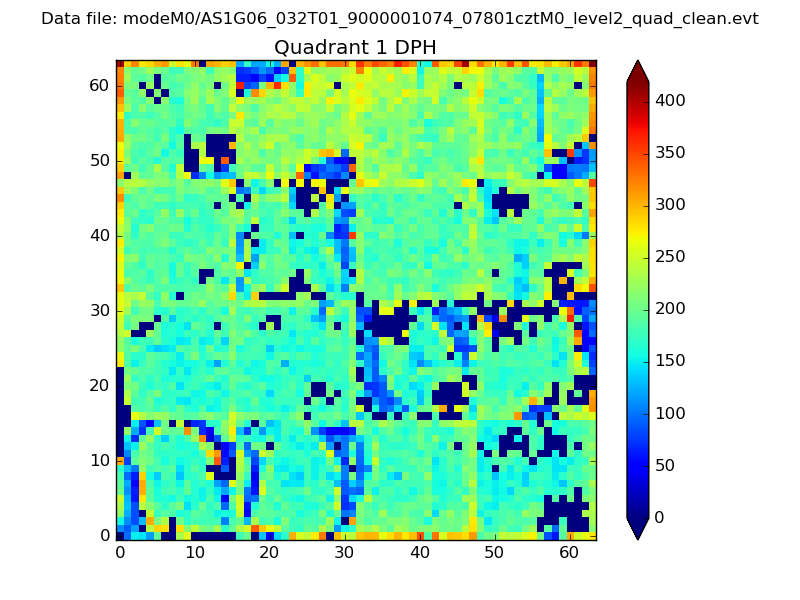 |
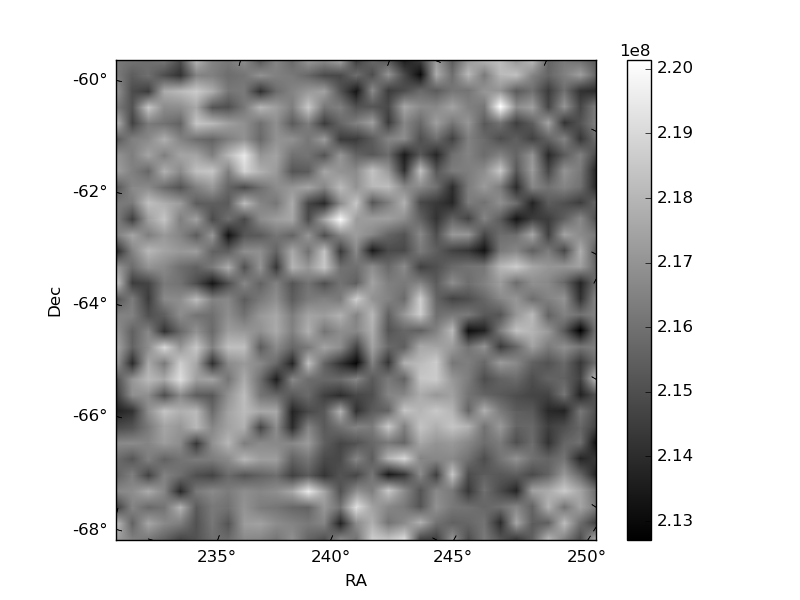
Quadrant B |
|---|---|---|---|
| Quadrant D | 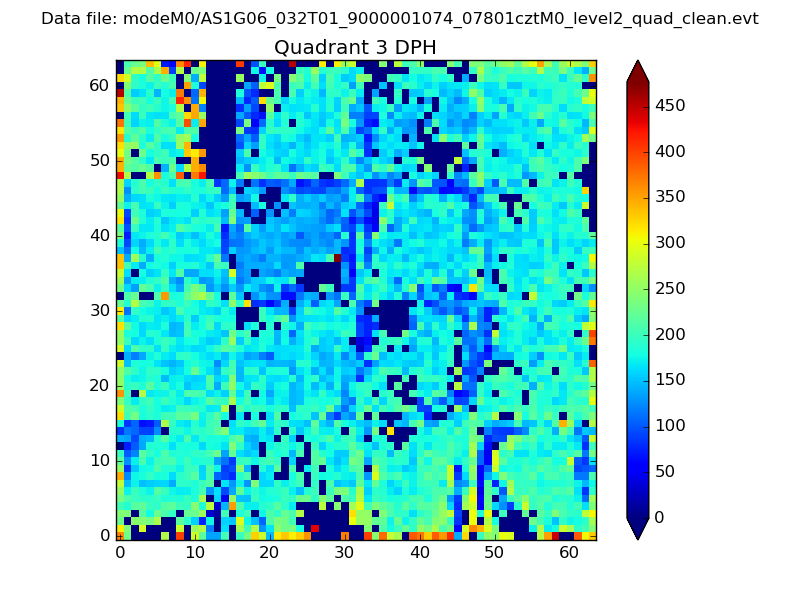 |
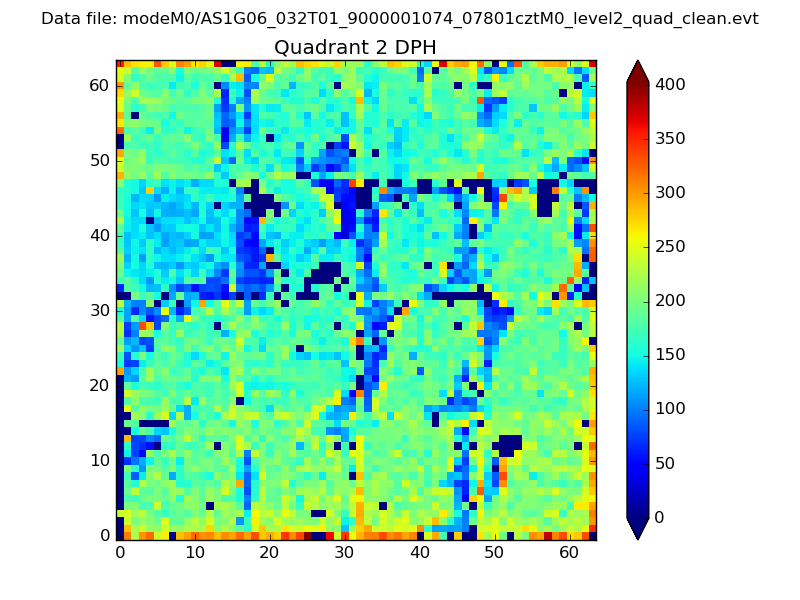 |
Quadrant C |
| Plot type | Count rate plots | Images |
|---|---|---|
| Comparison with Poisson distribution Blue bars denote a histogram of data divided into 1 sec bins. Red curve is a Poisson curve with rate = median count rate of data. |
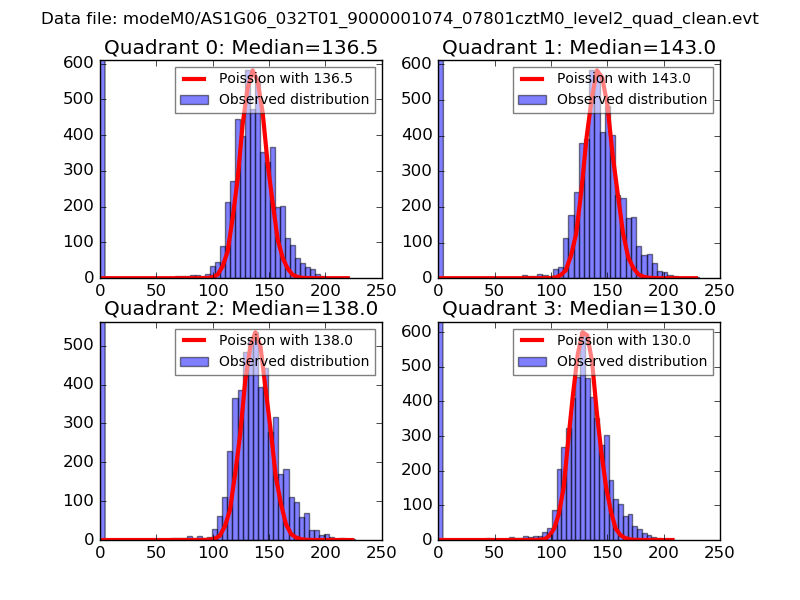 |
 |
| Quadrant-wise count rates Data is divided into 100 sec bins |
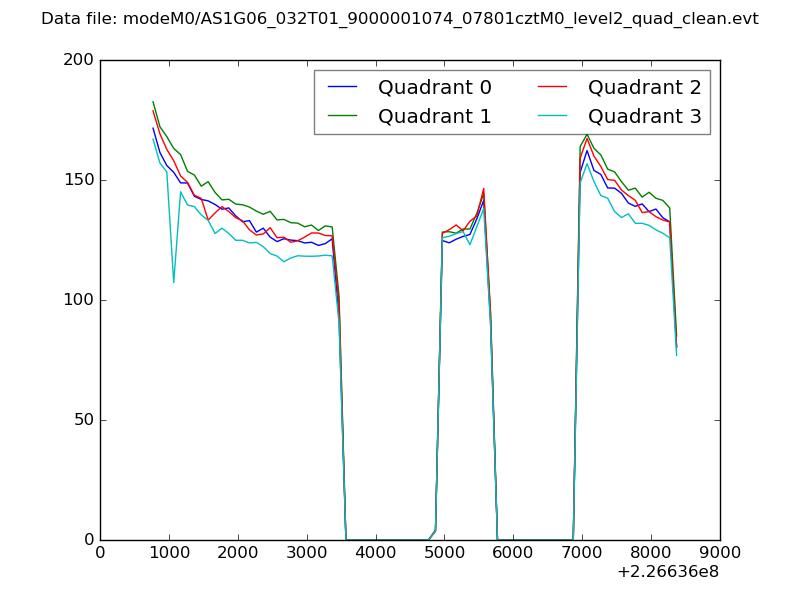 |
|
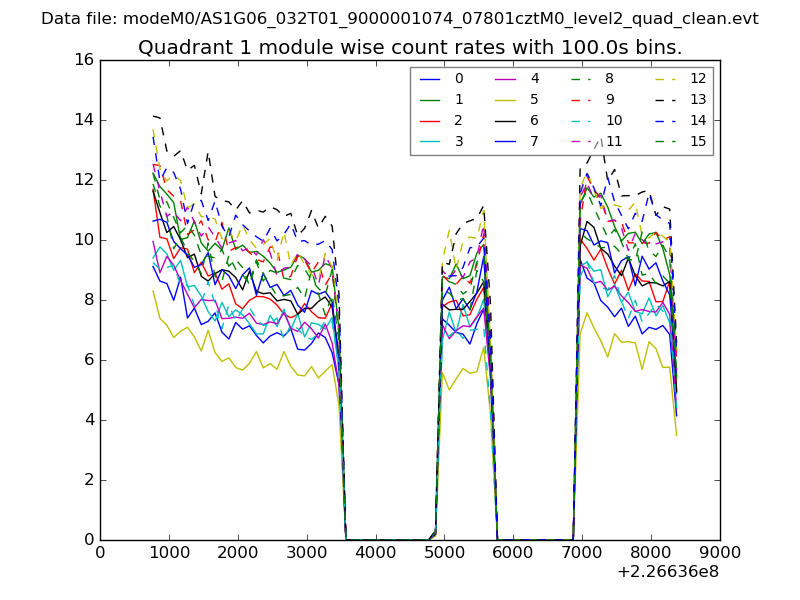
| Module-wise count rates for Quadrant A Data is divided into 100 sec bins |
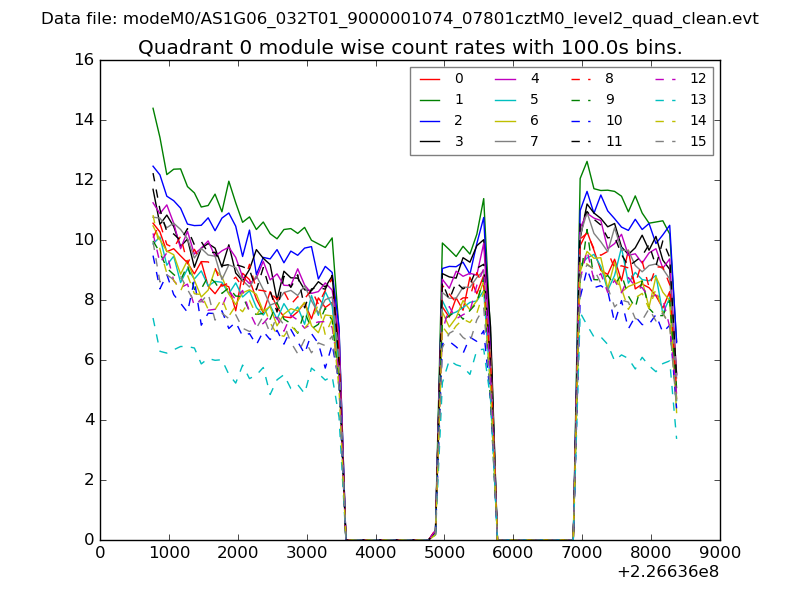 |
 |
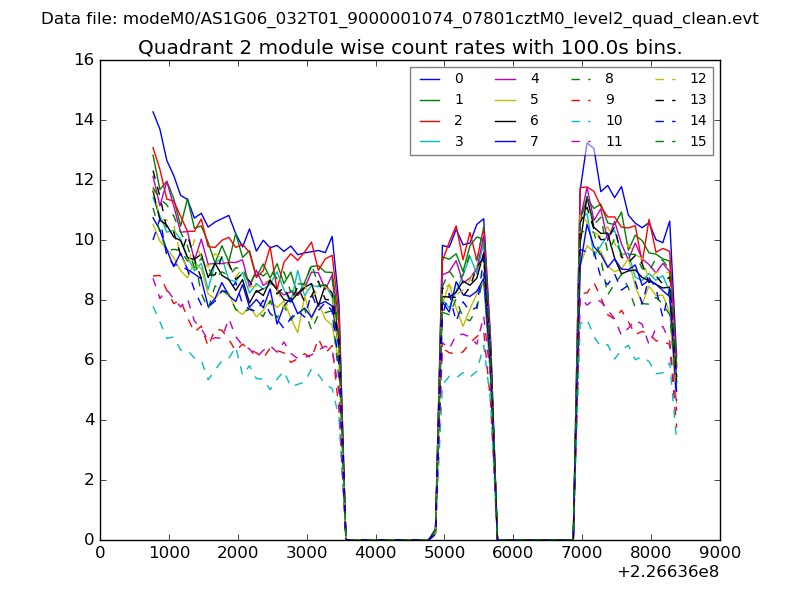
| Module-wise count rates for Quadrant B Data is divided into 100 sec bins |
 |
 |
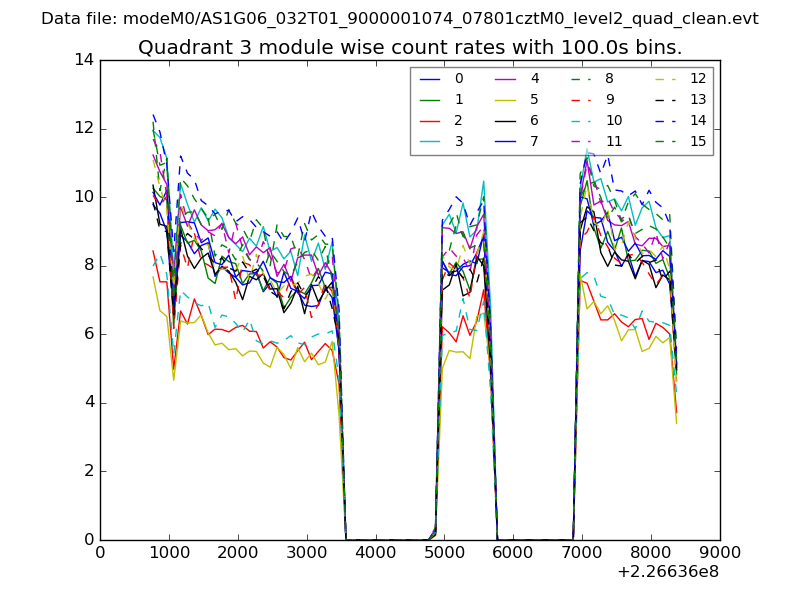
| Module-wise count rates for Quadrant C Data is divided into 100 sec bins |
 |
 |
| Module-wise count rates for Quadrant D Data is divided into 100 sec bins |
 |
 |
| Parameter | Plot |
|---|---|
| CZT HV Monitor | 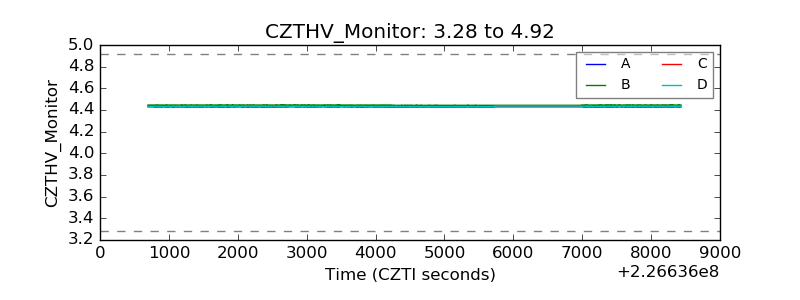 |
| D_VDD | 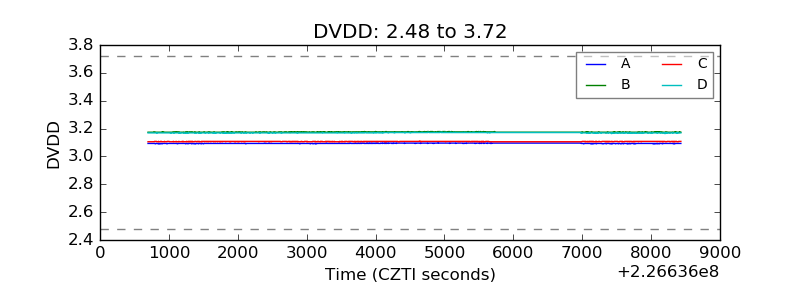 |
| Temperature 1 | 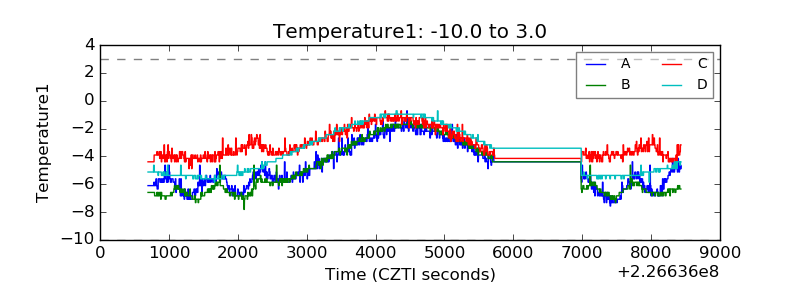 |
| Veto HV Monitor | 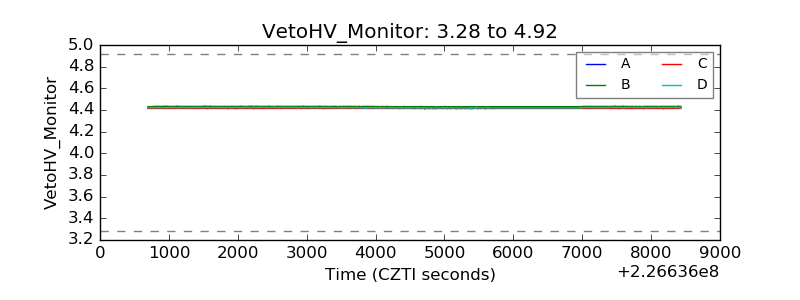 |
| Veto LLD | 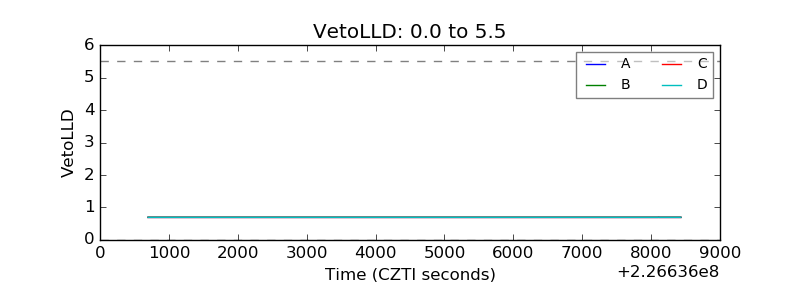 |
| Alpha Counter | 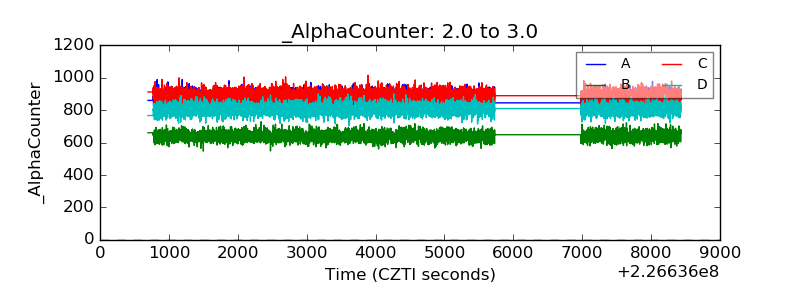 |
| _CPM_Rate | 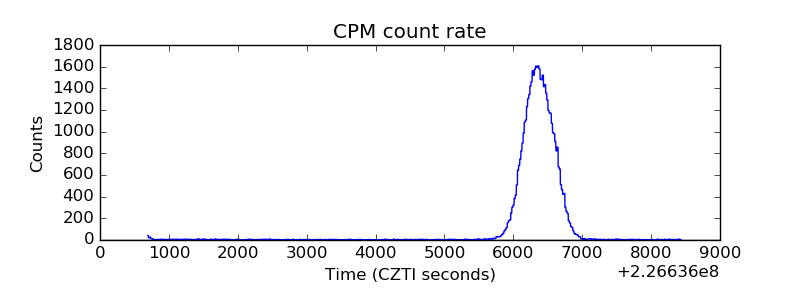 |
| CZT Counter | 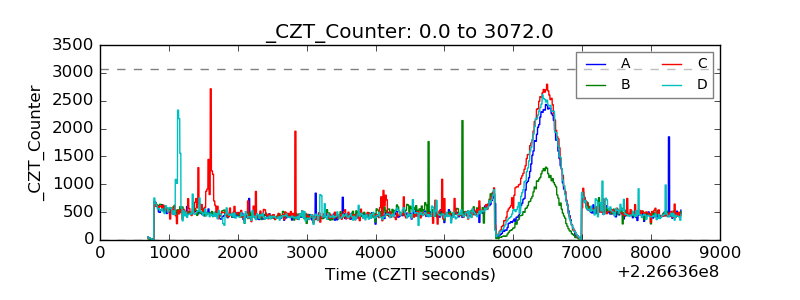 |
| +2.5 Volts monitor | 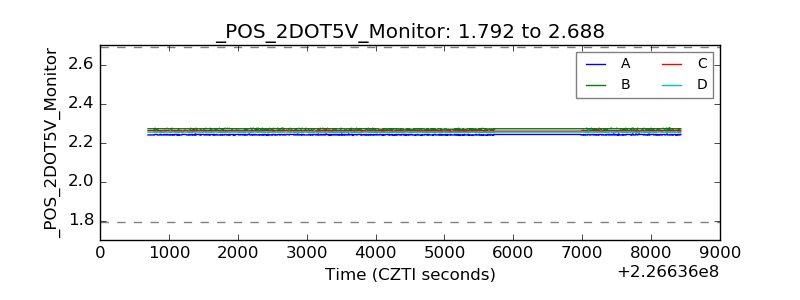 |
| +5 Volts monitor | 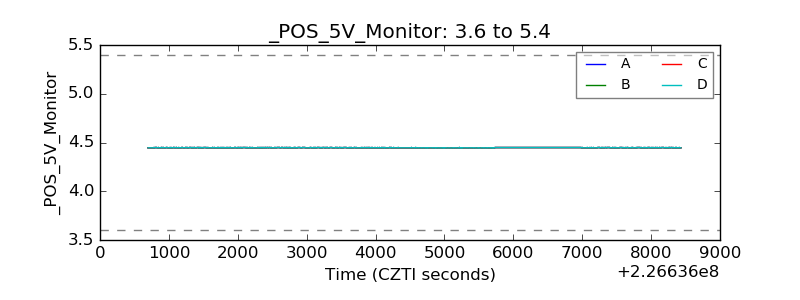 |
| _ROLL_ROT | 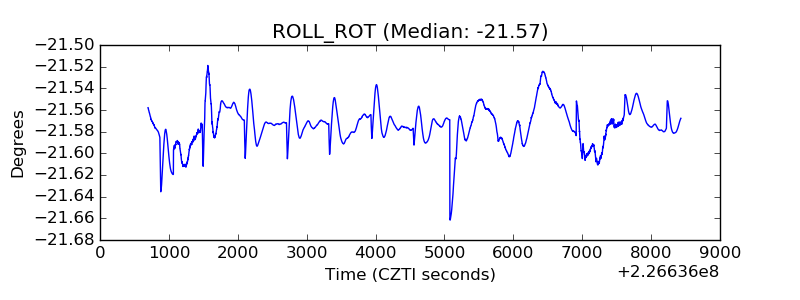 |
| _Roll_DEC | 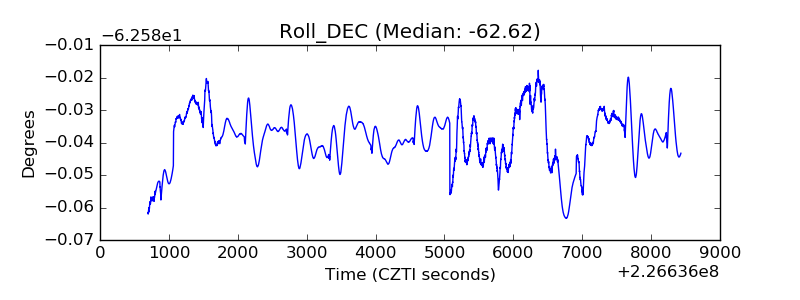 |
| _Roll_RA | 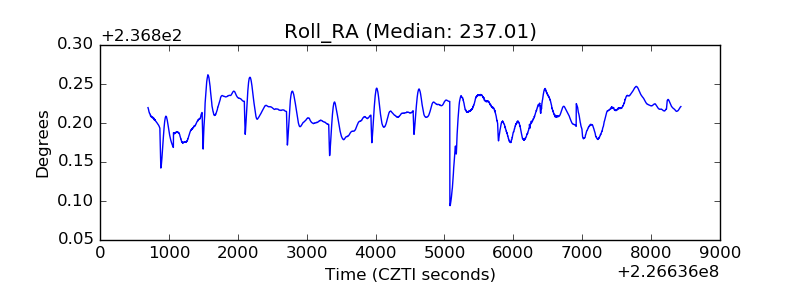 |
| Veto Counter | 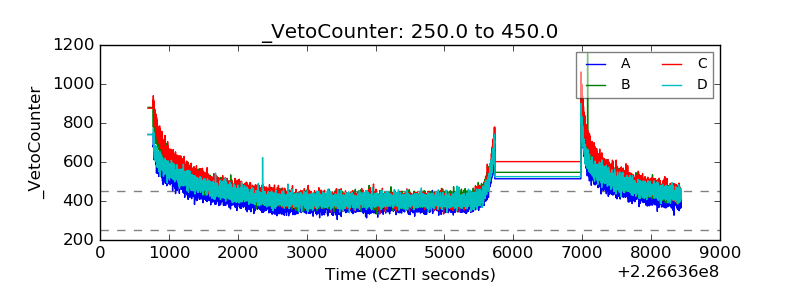 |