| Param | Original file | Final file |
|---|---|---|
| Filename | modeM0/AS1G06_032T01_9000001074_07802cztM0_level2.evt | modeM0/AS1G06_032T01_9000001074_07802cztM0_level2_quad_clean.evt |
| Size (bytes) | 446,042,880 | 104,238,720 |
| Size | 425.4 MB | 99.4 MB |
| Events in quadrant A | 3,006,917 | 678,829 |
| Events in quadrant B | 3,215,024 | 706,122 |
| Events in quadrant C | 3,757,768 | 674,597 |
| Events in quadrant D | 3,092,417 | 649,596 |
| Mode M0 | |||
|---|---|---|---|
| Quadrant | BADHDUFLAG | Total packets | Discarded packets |
| A | 0 | 13184 | 3 |
| B | 0 | 13630 | 2 |
| C | 0 | 15372 | 2 |
| D | 0 | 13648 | 2 |
| Mode M9 | |||
|---|---|---|---|
| Quadrant | BADHDUFLAG | Total packets | Discarded packets |
| A | 0 | 17 | 0 |
| B | 0 | 17 | 0 |
| C | 0 | 17 | 0 |
| D | 0 | 18 | 0 |
| Mode SS | |||
|---|---|---|---|
| Quadrant | BADHDUFLAG | Total packets | Discarded packets |
| A | 0 | 132 | 0 |
| B | 0 | 132 | 0 |
| C | 0 | 132 | 0 |
| D | 0 | 132 | 0 |
| Quadrant | Total seconds | Saturated seconds | Saturation percentage |
|---|---|---|---|
| A | 6412 | 64 | 0.998129% |
| B | 6412 | 92 | 1.434810% |
| C | 6412 | 265 | 4.132876% |
| D | 6412 | 57 | 0.888958% |
Noise dominated data is calculated using 1-second bins in cleaned event files. If a bin has >2000 counts, and if more than 50% of those come from <1% of pixels, then it is considered to be noise-dominated and hence unusable.
| Quadrant | # 1 sec bins | Bins with >0 counts | Bins with >2000 counts | High rate bins dominated by noise | Noise dominated (total time) | Noise dominated (detector-on time) | Marked lightcurve |
|---|---|---|---|---|---|---|---|
| A | 7637 | 6413 | 1 | 1 | 0.01% | 0.02% | 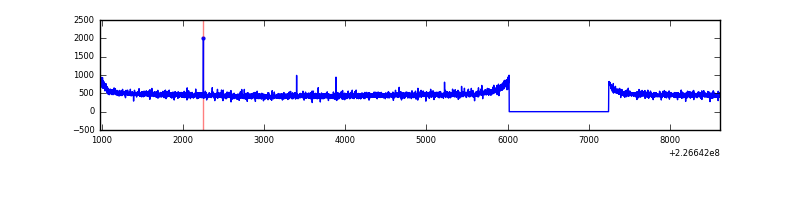 |
| B | 7637 | 6413 | 24 | 24 | 0.31% | 0.37% | 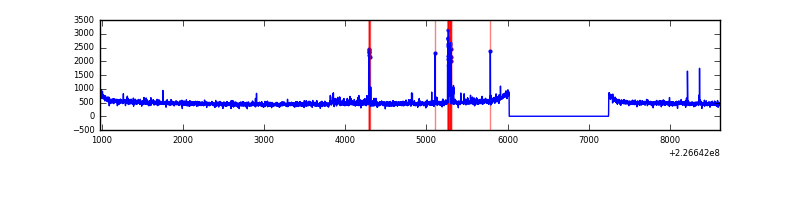 |
| C | 7637 | 6412 | 129 | 129 | 1.69% | 2.01% | 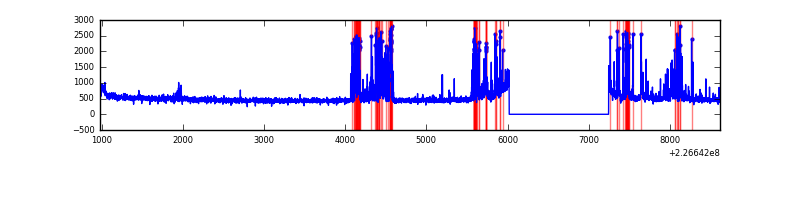 |
| D | 7637 | 6412 | 10 | 10 | 0.13% | 0.16% | 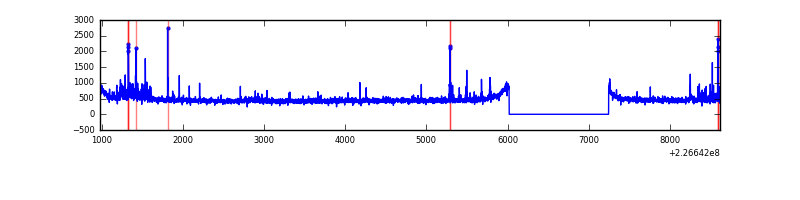 |
Top three noisy pixels from each quadrant. If the there are fewer than three noisy pixels in the level2.evt file, extra rows are filled as -1
| Pixel properties | Quadrant properties | ||||||
|---|---|---|---|---|---|---|---|
| Quadrant | DetID | PixID | Counts | Sigma | Mean | Median | Sigma |
| A | 0 | 226 | 7344 | 42.11 | 779 | 763 | 156.3 |
| A | 12 | 194 | 6814 | 38.72 | 779 | 763 | 156.3 |
| A | 13 | 248 | 5640 | 31.2 | 779 | 763 | 156.3 |
| B | 5 | 6 | 71774 | 483.66 | 788 | 772 | 146.8 |
| B | 4 | 239 | 33247 | 221.22 | 788 | 772 | 146.8 |
| B | 0 | 214 | 28256 | 187.22 | 788 | 772 | 146.8 |
| C | 4 | 254 | 735433 | 4188.49 | 766 | 770 | 175.4 |
| C | 1 | 16 | 12179 | 65.05 | 766 | 770 | 175.4 |
| C | 12 | 4 | 10331 | 54.51 | 766 | 770 | 175.4 |
| D | 2 | 152 | 109501 | 588.26 | 770 | 749 | 184.9 |
| D | 2 | 14 | 62911 | 336.25 | 770 | 749 | 184.9 |
| D | 2 | 234 | 17728 | 91.84 | 770 | 749 | 184.9 |
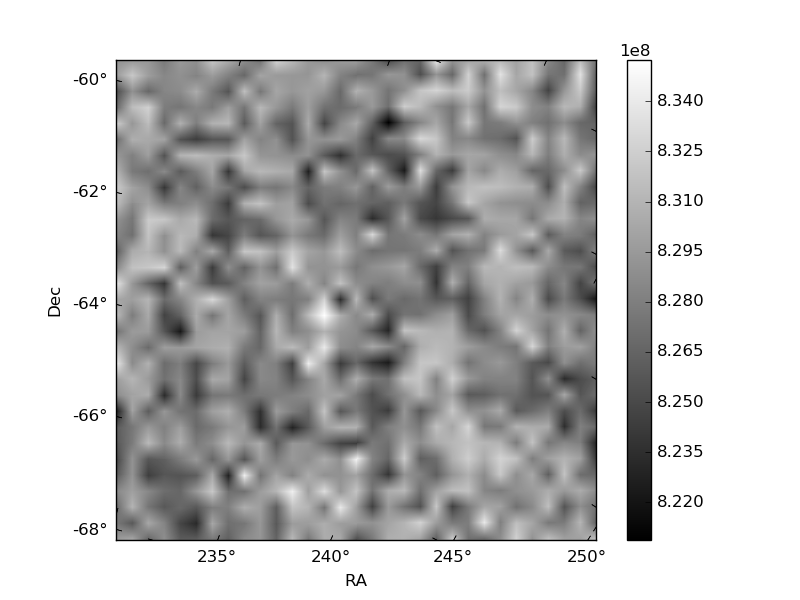
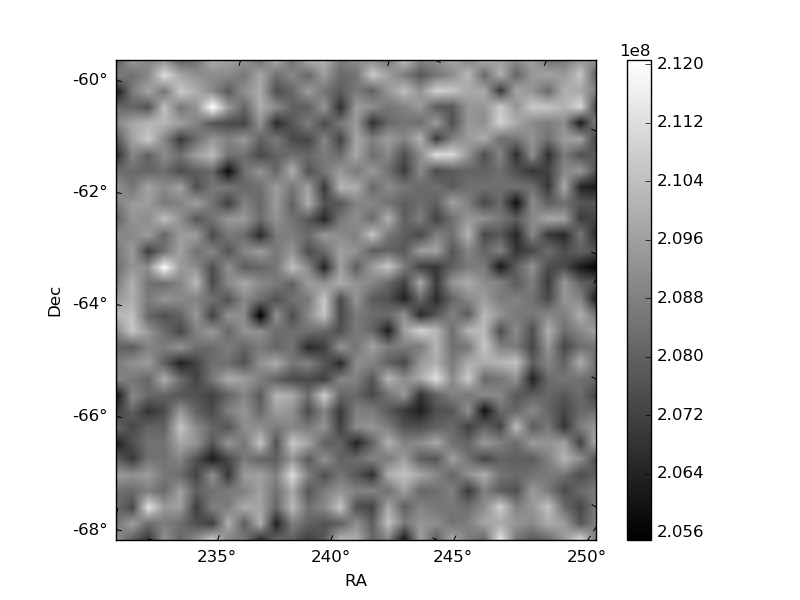
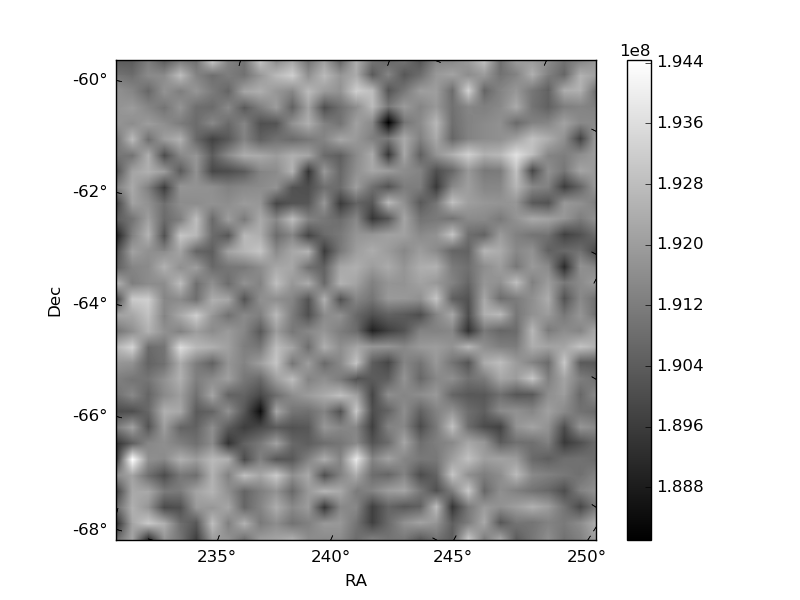
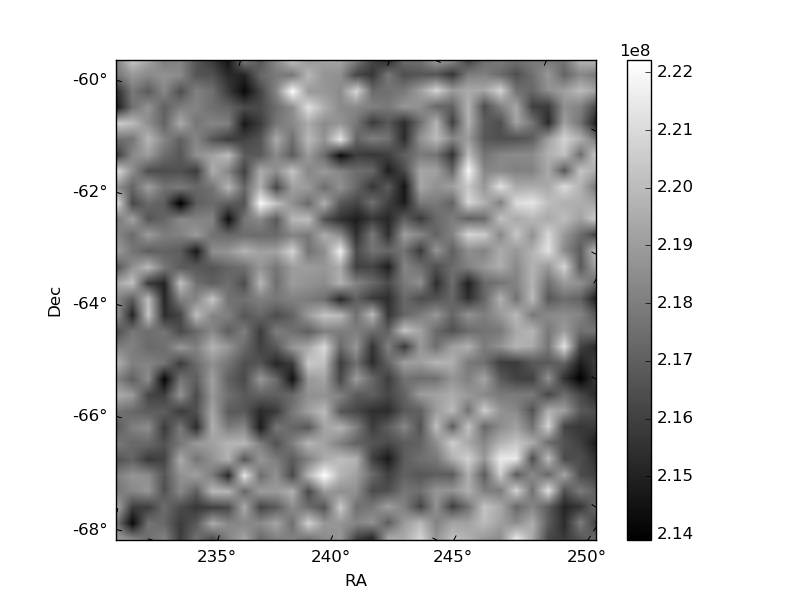
Histogram calculated using DETX and DETY for each event in the final _common_clean file
| Quadrant A | 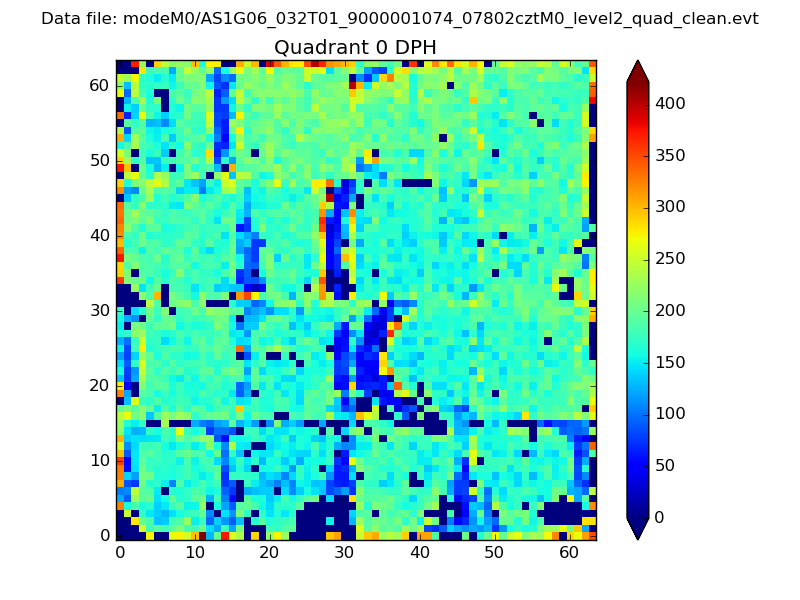 |
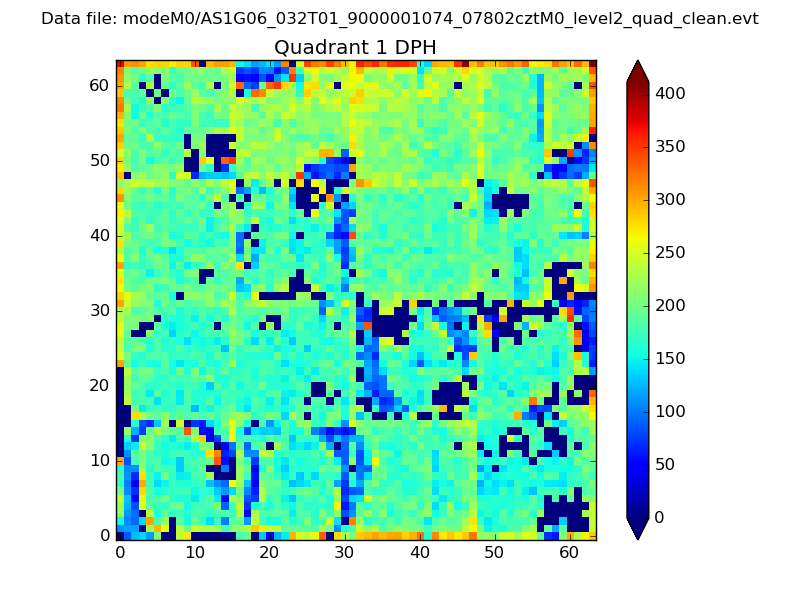 |
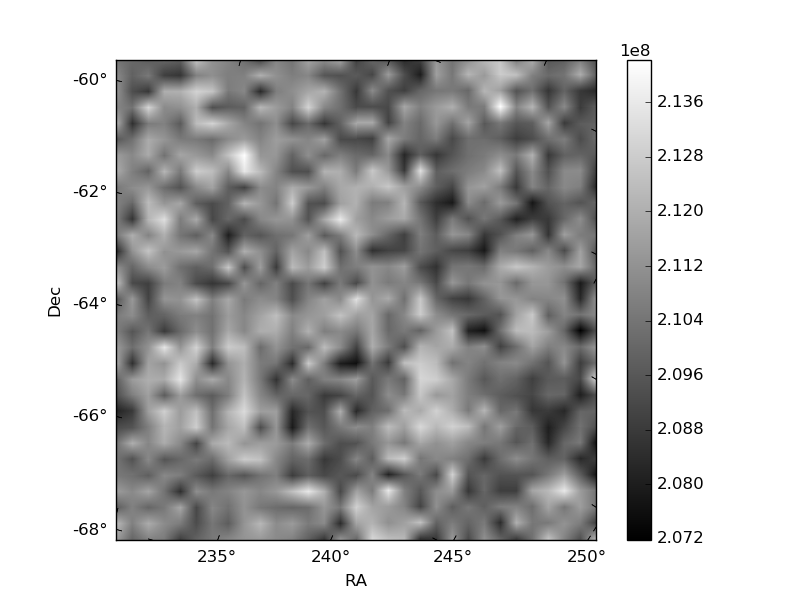
Quadrant B |
|---|---|---|---|
| Quadrant D | 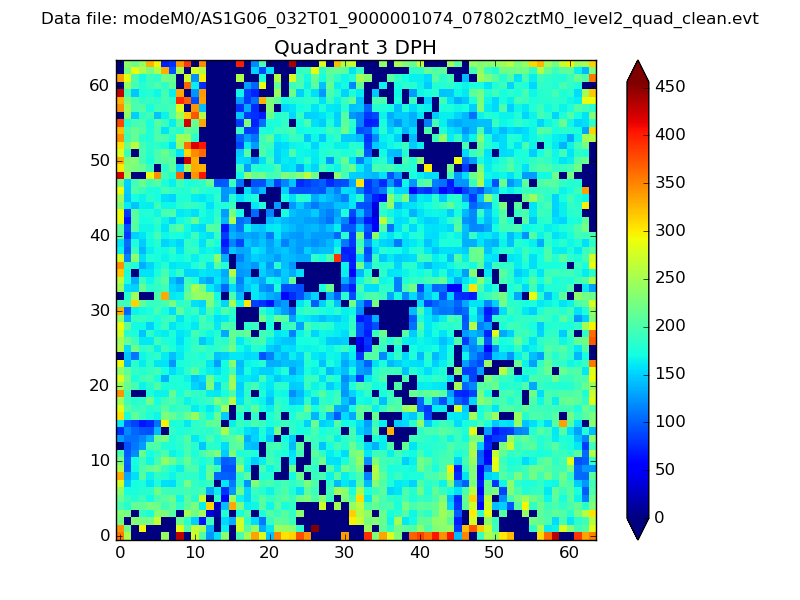 |
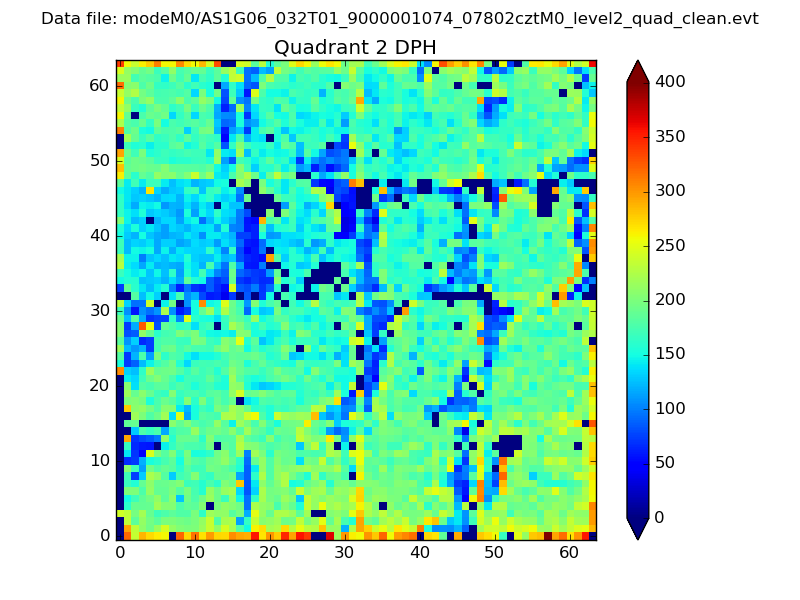 |
Quadrant C |
| Plot type | Count rate plots | Images |
|---|---|---|
| Comparison with Poisson distribution Blue bars denote a histogram of data divided into 1 sec bins. Red curve is a Poisson curve with rate = median count rate of data. |
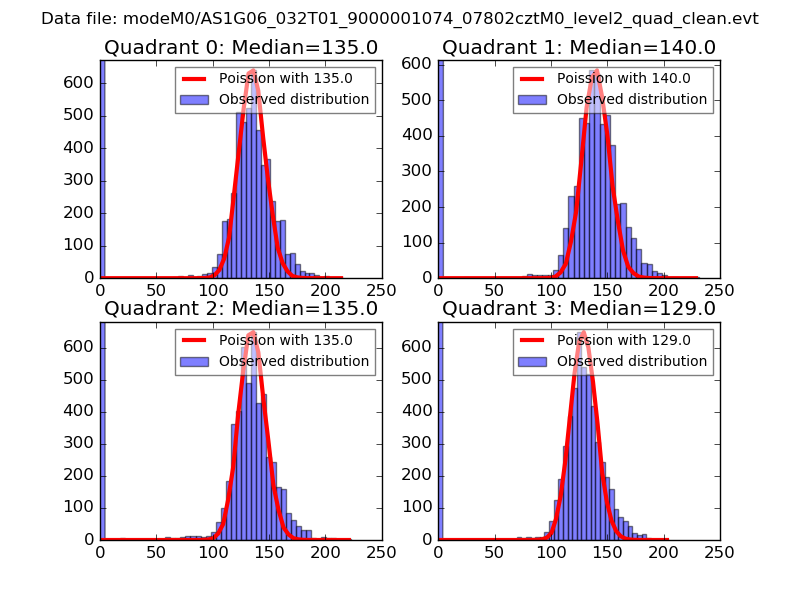 |
 |
| Quadrant-wise count rates Data is divided into 100 sec bins |
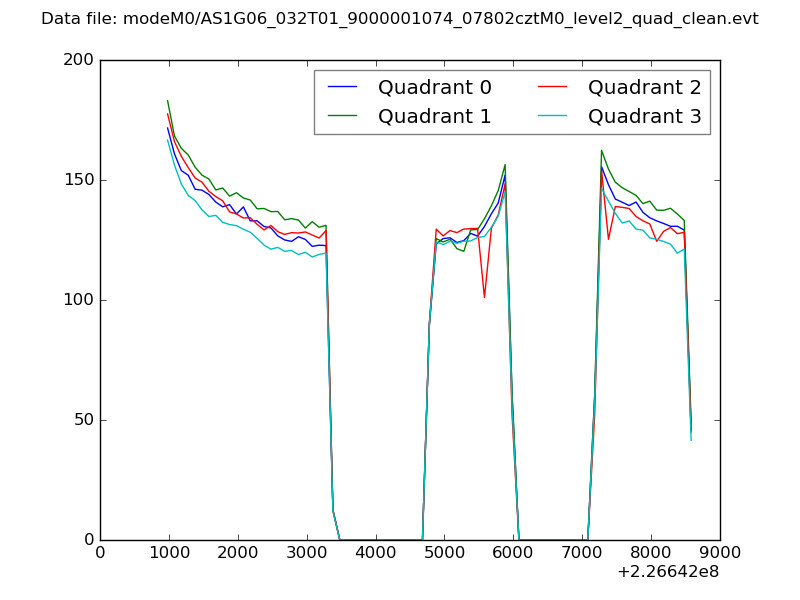 |
|
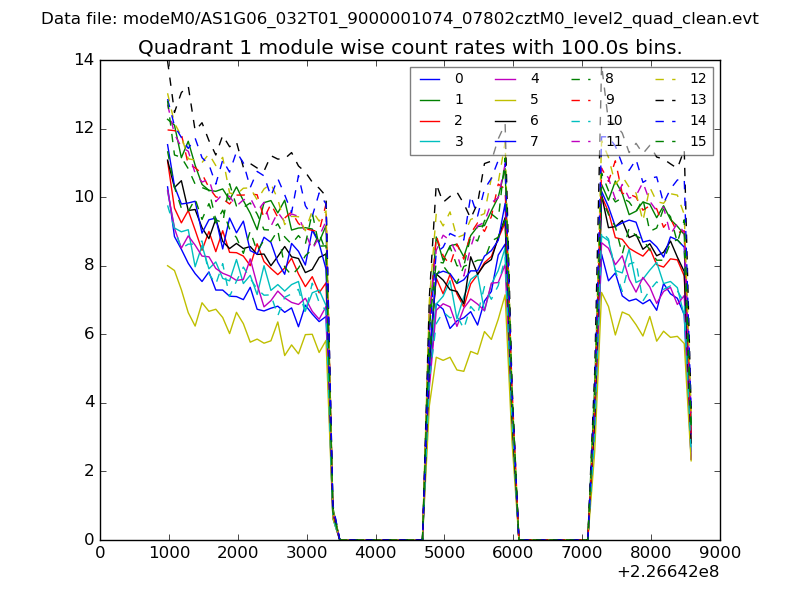
| Module-wise count rates for Quadrant A Data is divided into 100 sec bins |
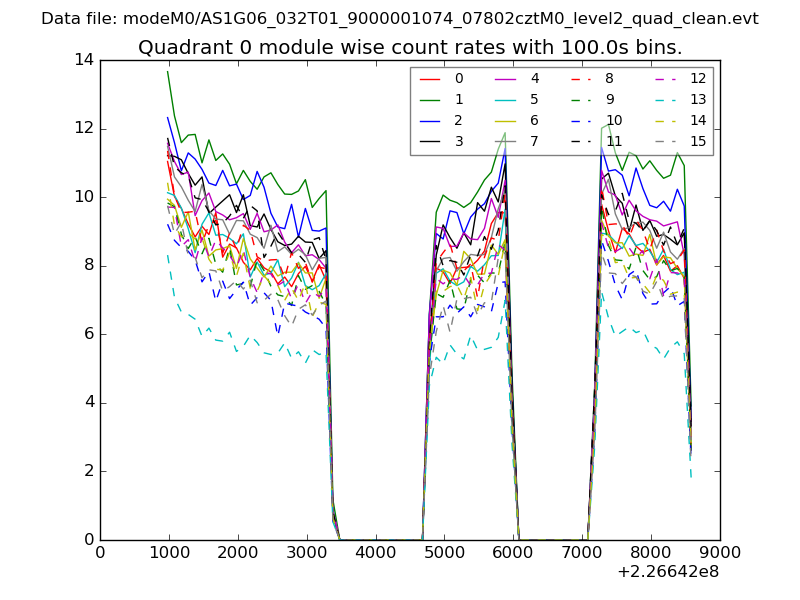 |
 |
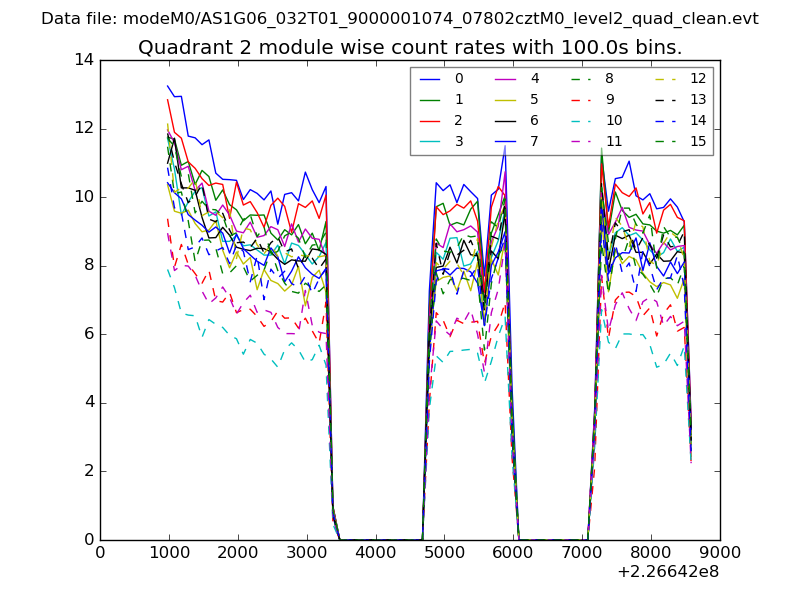
| Module-wise count rates for Quadrant B Data is divided into 100 sec bins |
 |
 |
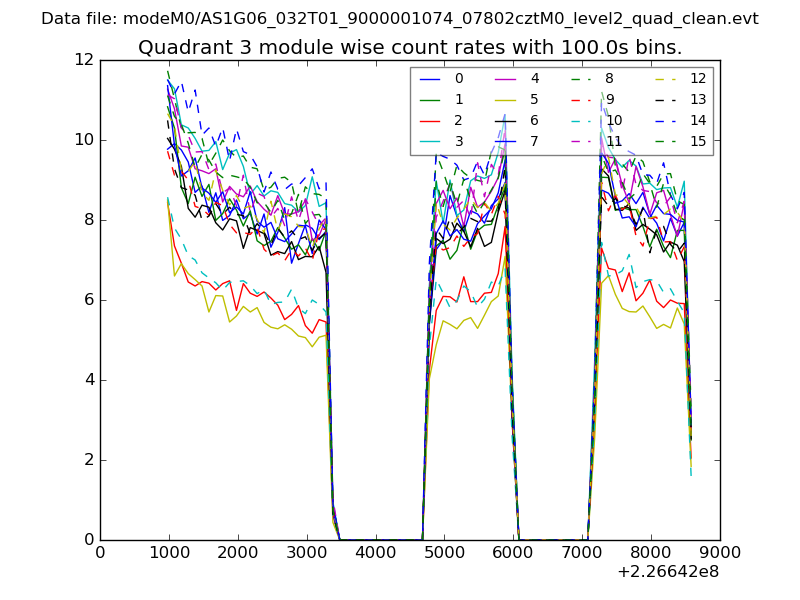
| Module-wise count rates for Quadrant C Data is divided into 100 sec bins |
 |
 |
| Module-wise count rates for Quadrant D Data is divided into 100 sec bins |
 |
 |
| Parameter | Plot |
|---|---|
| CZT HV Monitor | 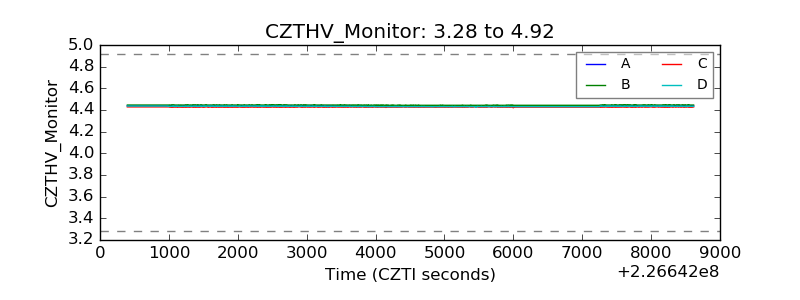 |
| D_VDD | 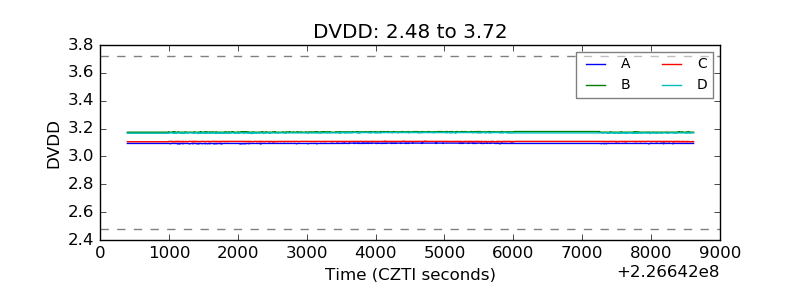 |
| Temperature 1 | 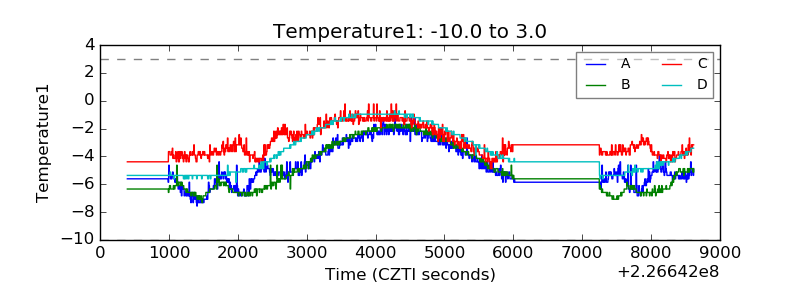 |
| Veto HV Monitor | 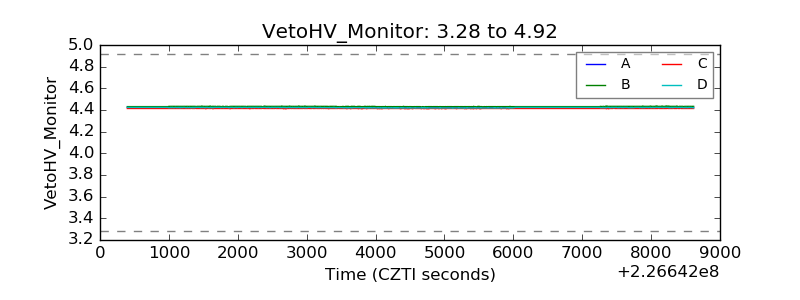 |
| Veto LLD | 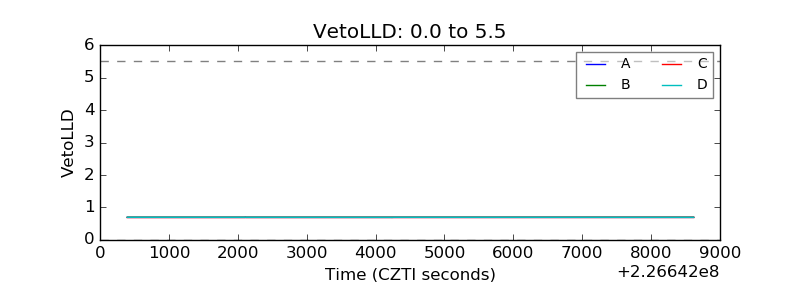 |
| Alpha Counter | 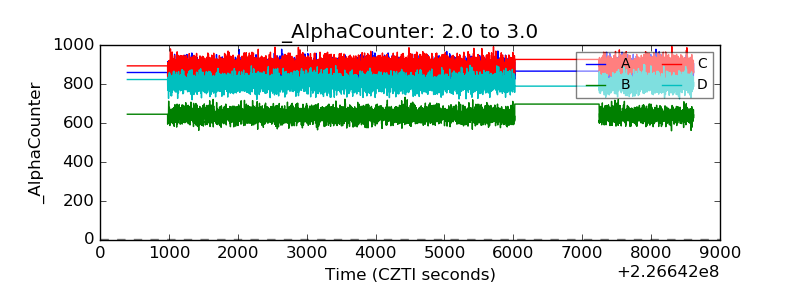 |
| _CPM_Rate | 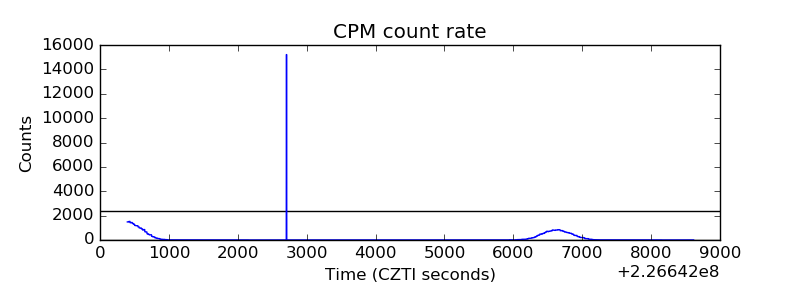 |
| CZT Counter | 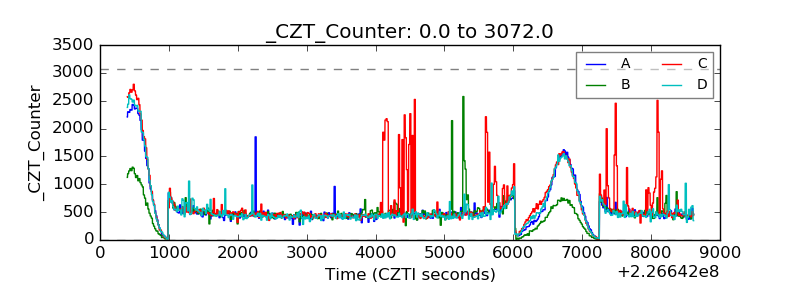 |
| +2.5 Volts monitor |  |
| +5 Volts monitor |  |
| _ROLL_ROT | 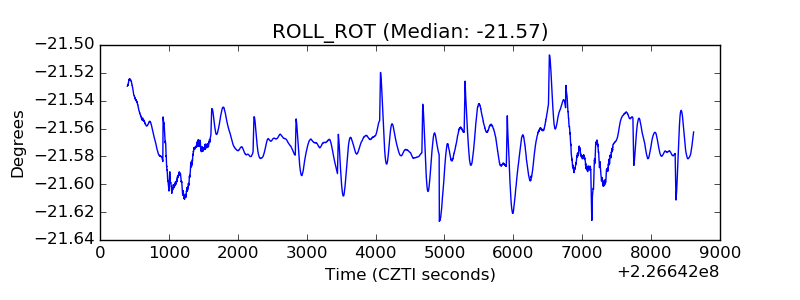 |
| _Roll_DEC |  |
| _Roll_RA | 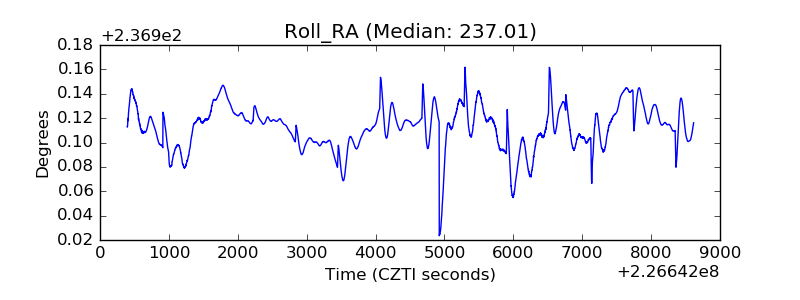 |
| Veto Counter | 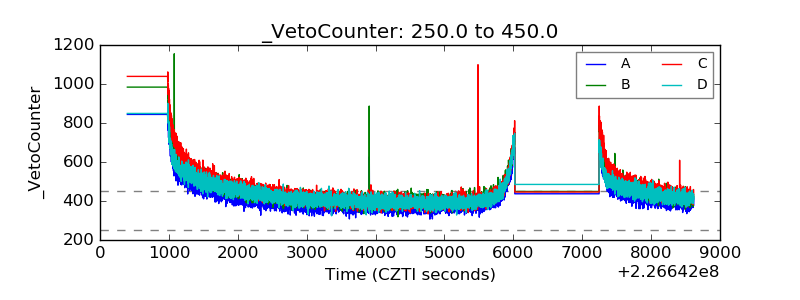 |