| Param | Original file | Final file |
|---|---|---|
| Filename | modeM0/AS1G06_032T01_9000001074_07806cztM0_level2.evt | modeM0/AS1G06_032T01_9000001074_07806cztM0_level2_quad_clean.evt |
| Size (bytes) | 503,939,520 | 94,717,440 |
| Size | 480.6 MB | 90.3 MB |
| Events in quadrant A | 3,495,714 | 588,212 |
| Events in quadrant B | 3,888,941 | 601,084 |
| Events in quadrant C | 3,453,811 | 587,900 |
| Events in quadrant D | 3,902,791 | 558,151 |
| Mode M0 | |||
|---|---|---|---|
| Quadrant | BADHDUFLAG | Total packets | Discarded packets |
| A | 0 | 15874 | 3 |
| B | 0 | 16562 | 2 |
| C | 0 | 15883 | 2 |
| D | 0 | 17025 | 2 |
| Mode M9 | |||
|---|---|---|---|
| Quadrant | BADHDUFLAG | Total packets | Discarded packets |
| A | 0 | 1 | 0 |
| B | 0 | 1 | 0 |
| C | 0 | 1 | 0 |
| D | 0 | 1 | 0 |
| Mode SS | |||
|---|---|---|---|
| Quadrant | BADHDUFLAG | Total packets | Discarded packets |
| A | 0 | 154 | 0 |
| B | 0 | 154 | 0 |
| C | 0 | 154 | 0 |
| D | 0 | 154 | 0 |
| Quadrant | Total seconds | Saturated seconds | Saturation percentage |
|---|---|---|---|
| A | 7662 | 240 | 3.132341% |
| B | 7662 | 265 | 3.458627% |
| C | 7662 | 163 | 2.127382% |
| D | 7662 | 214 | 2.793004% |
Noise dominated data is calculated using 1-second bins in cleaned event files. If a bin has >2000 counts, and if more than 50% of those come from <1% of pixels, then it is considered to be noise-dominated and hence unusable.
| Quadrant | # 1 sec bins | Bins with >0 counts | Bins with >2000 counts | High rate bins dominated by noise | Noise dominated (total time) | Noise dominated (detector-on time) | Marked lightcurve |
|---|---|---|---|---|---|---|---|
| A | 7762 | 7662 | 2 | 2 | 0.03% | 0.03% |  |
| B | 7762 | 7662 | 7 | 7 | 0.09% | 0.09% |  |
| C | 7762 | 7662 | 0 | 0 | 0.00% | 0.00% | 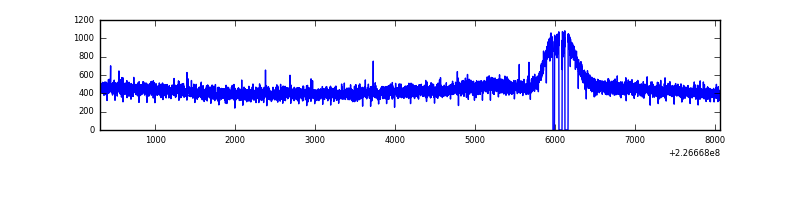 |
| D | 7762 | 7662 | 26 | 26 | 0.33% | 0.34% | 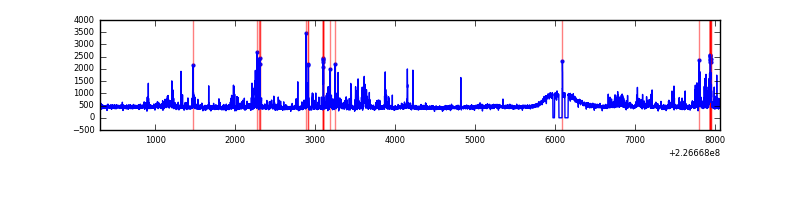 |
Top three noisy pixels from each quadrant. If the there are fewer than three noisy pixels in the level2.evt file, extra rows are filled as -1
| Pixel properties | Quadrant properties | ||||||
|---|---|---|---|---|---|---|---|
| Quadrant | DetID | PixID | Counts | Sigma | Mean | Median | Sigma |
| A | 3 | 1 | 12426 | 62.79 | 899 | 877 | 183.9 |
| A | 15 | 174 | 12320 | 62.22 | 899 | 877 | 183.9 |
| A | 0 | 226 | 8432 | 41.08 | 899 | 877 | 183.9 |
| B | 11 | 51 | 161456 | 927.61 | 904 | 882 | 173.1 |
| B | 4 | 239 | 54202 | 308.02 | 904 | 882 | 173.1 |
| B | 0 | 214 | 44776 | 253.57 | 904 | 882 | 173.1 |
| C | 13 | 61 | 6938 | 29.55 | 880 | 882 | 205.0 |
| C | 8 | 128 | 5725 | 23.63 | 880 | 882 | 205.0 |
| C | 1 | 16 | 5412 | 22.1 | 880 | 882 | 205.0 |
| D | 2 | 152 | 308802 | 1430.21 | 882 | 851 | 215.3 |
| D | 7 | 55 | 104183 | 479.9 | 882 | 851 | 215.3 |
| D | 13 | 104 | 56221 | 257.15 | 882 | 851 | 215.3 |
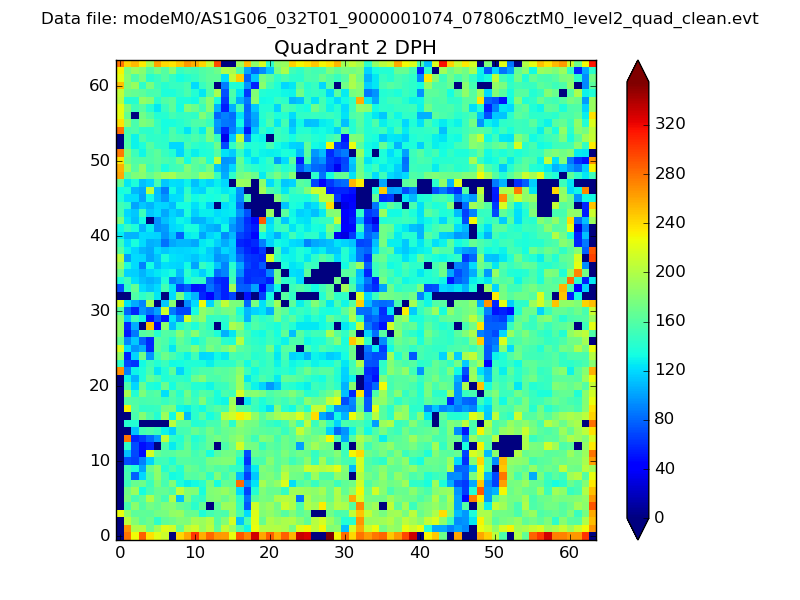
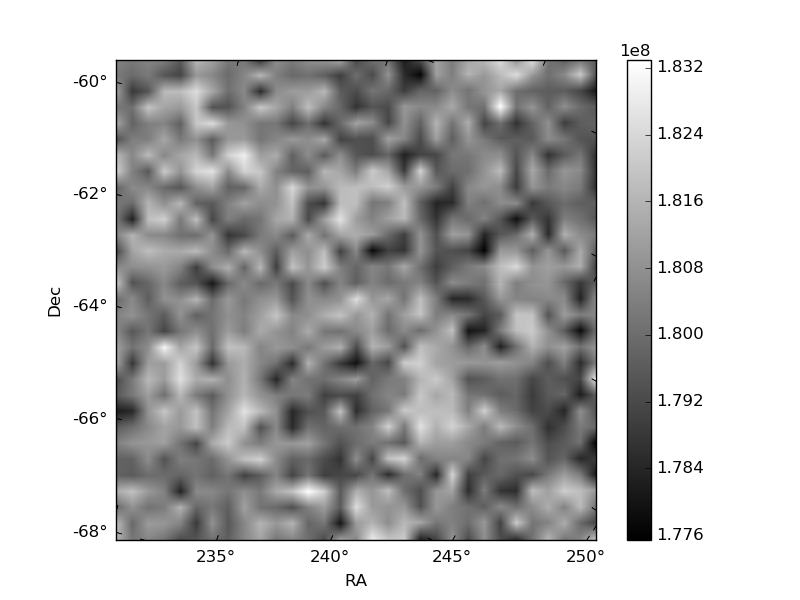
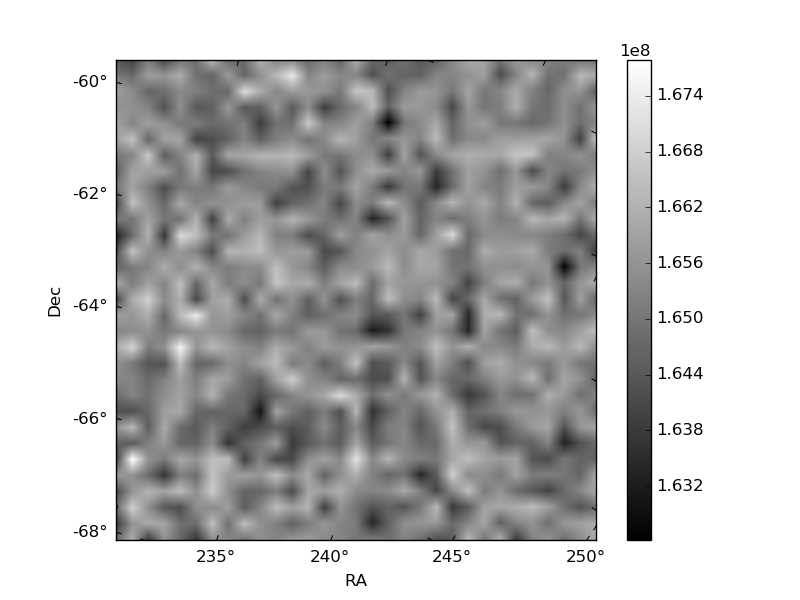
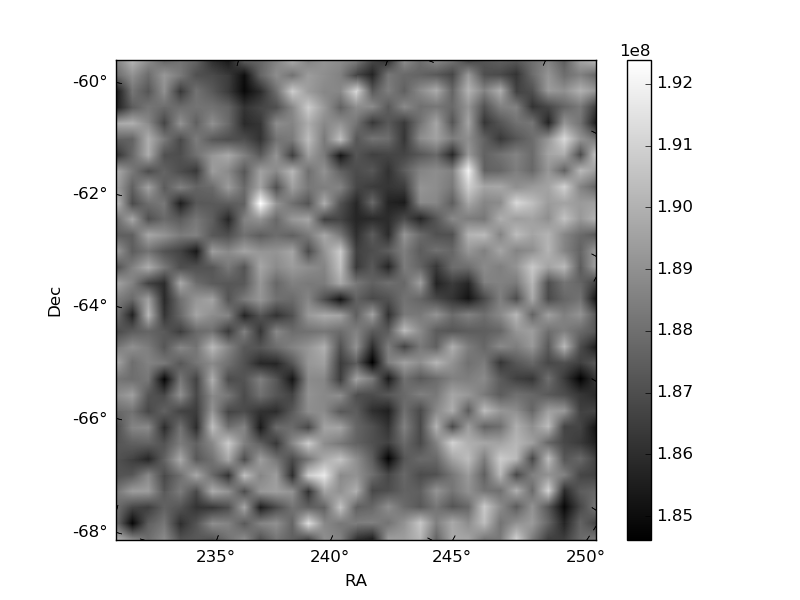
Histogram calculated using DETX and DETY for each event in the final _common_clean file
| Quadrant A | 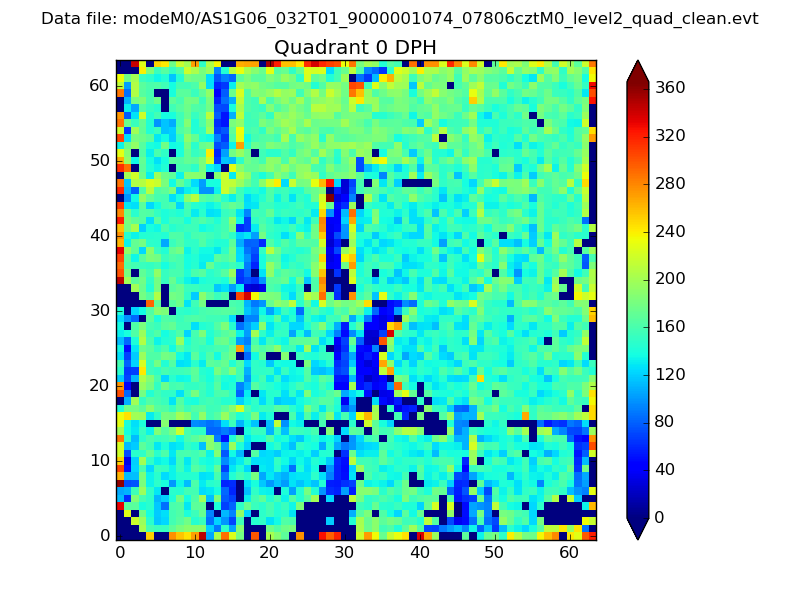 |
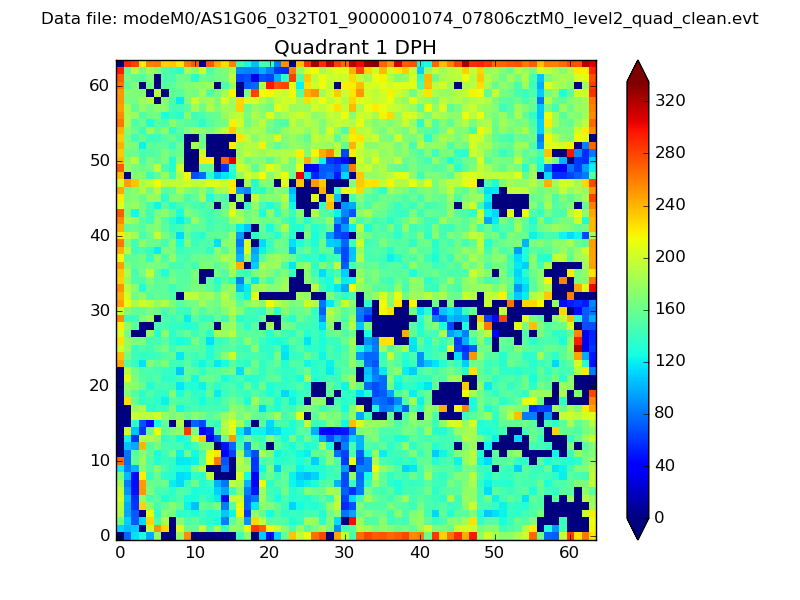 |
Quadrant B |
|---|---|---|---|
| Quadrant D | 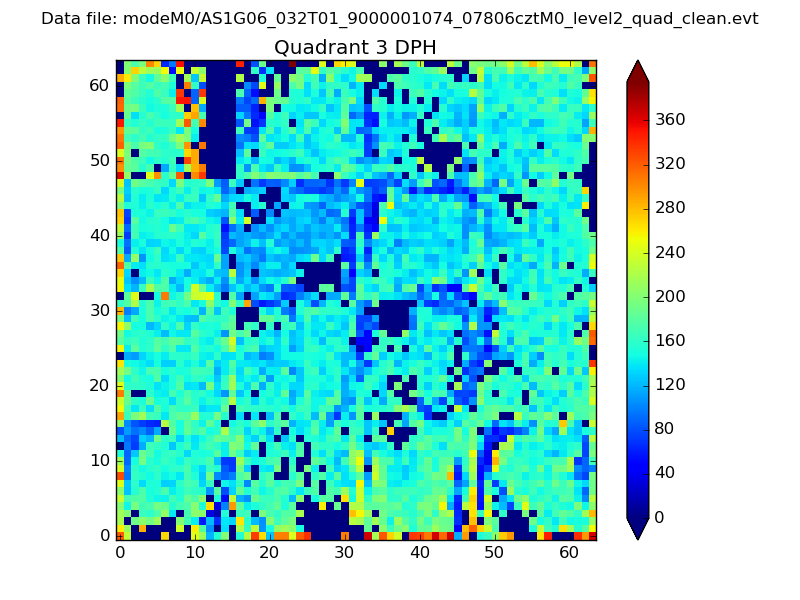 |
 |
Quadrant C |
| Plot type | Count rate plots | Images |
|---|---|---|
| Comparison with Poisson distribution Blue bars denote a histogram of data divided into 1 sec bins. Red curve is a Poisson curve with rate = median count rate of data. |
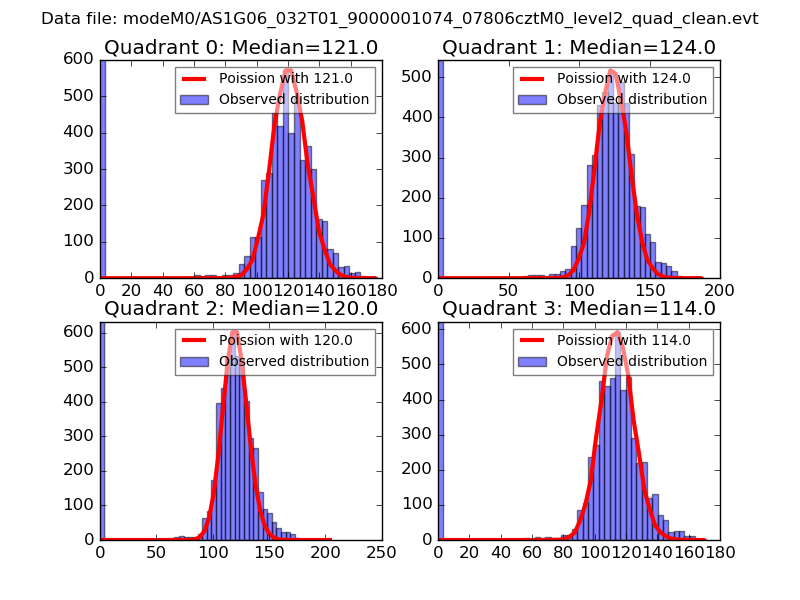 |
 |
| Quadrant-wise count rates Data is divided into 100 sec bins |
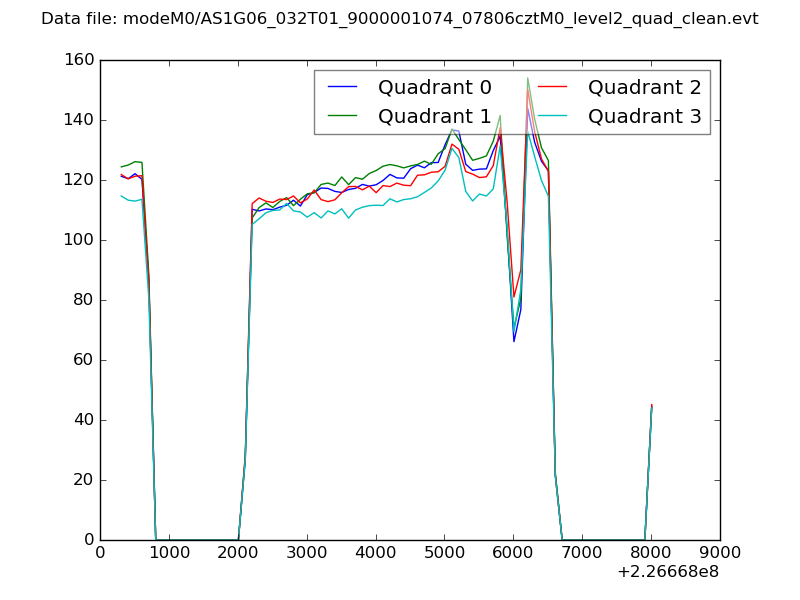 |
|
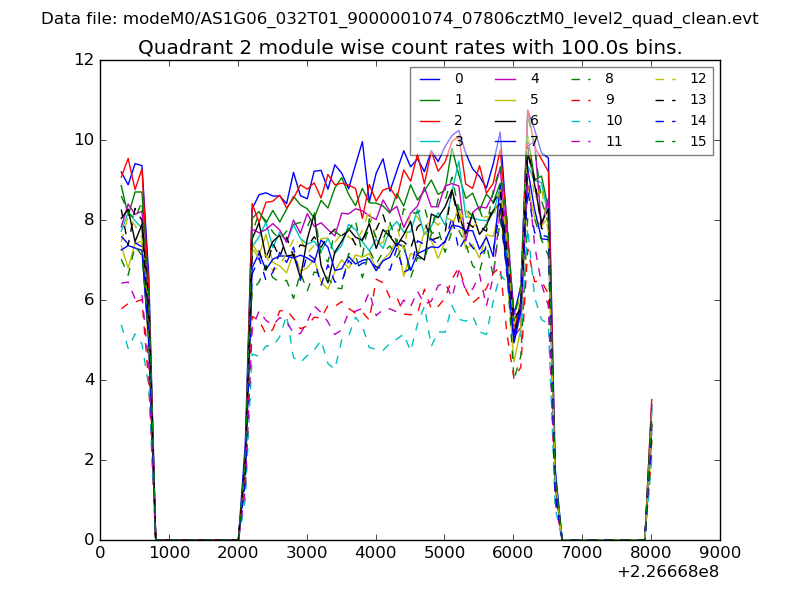
| Module-wise count rates for Quadrant A Data is divided into 100 sec bins |
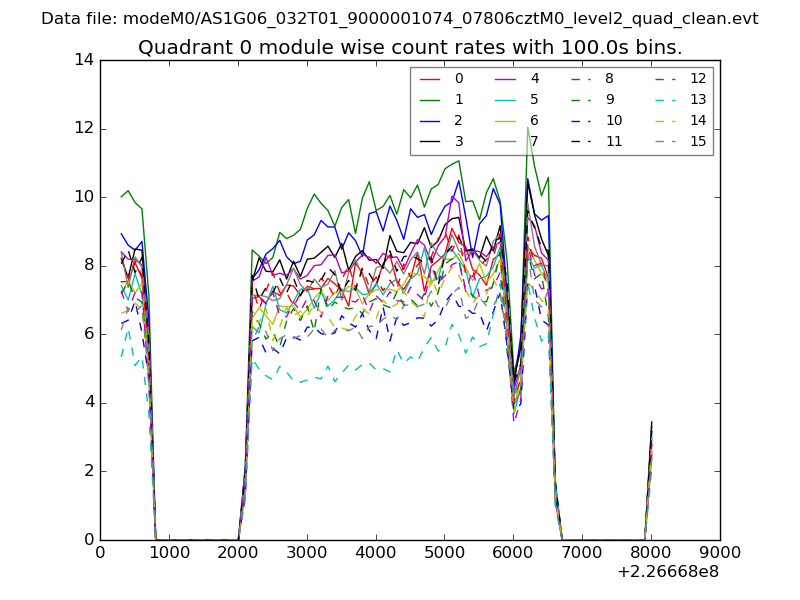 |
 |
| Module-wise count rates for Quadrant B Data is divided into 100 sec bins |
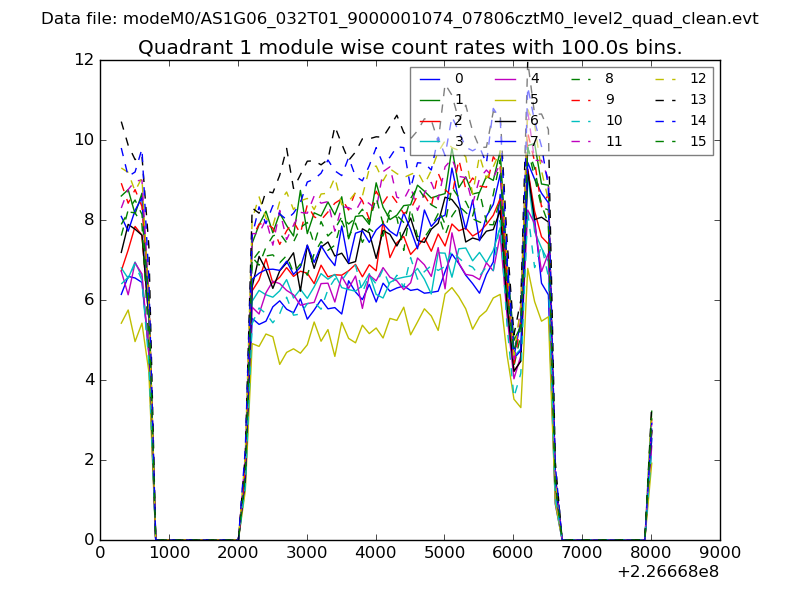 |
 |
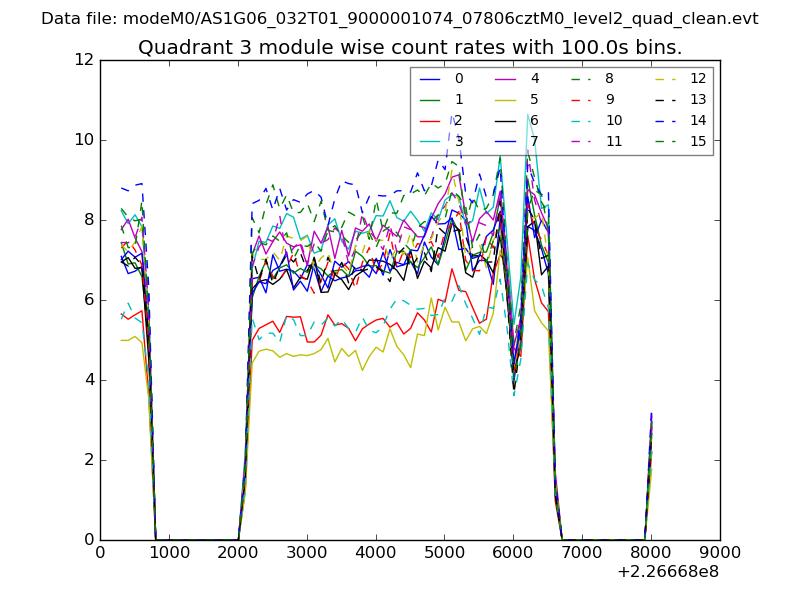
| Module-wise count rates for Quadrant C Data is divided into 100 sec bins |
 |
 |
| Module-wise count rates for Quadrant D Data is divided into 100 sec bins |
 |
 |
| Parameter | Plot |
|---|---|
| CZT HV Monitor | 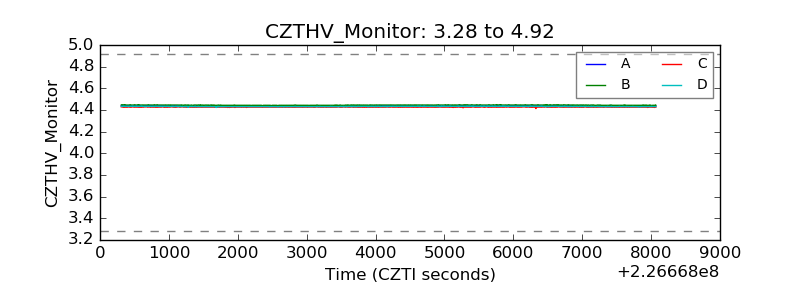 |
| D_VDD | 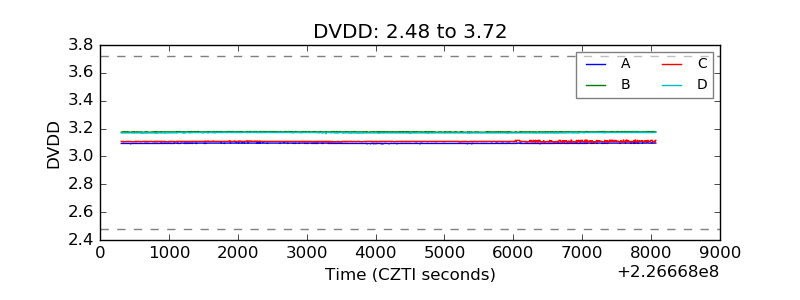 |
| Temperature 1 | 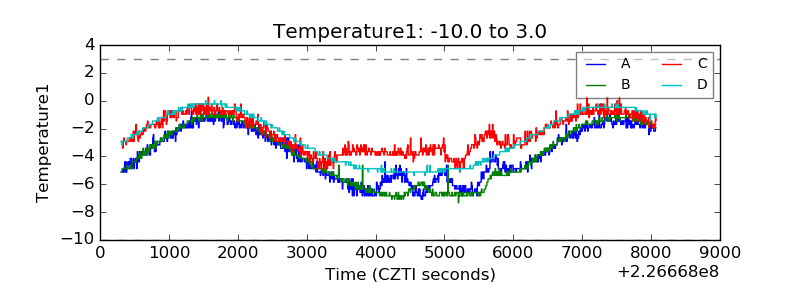 |
| Veto HV Monitor | 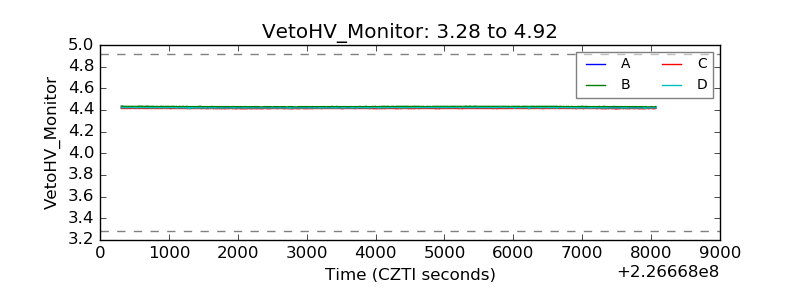 |
| Veto LLD | 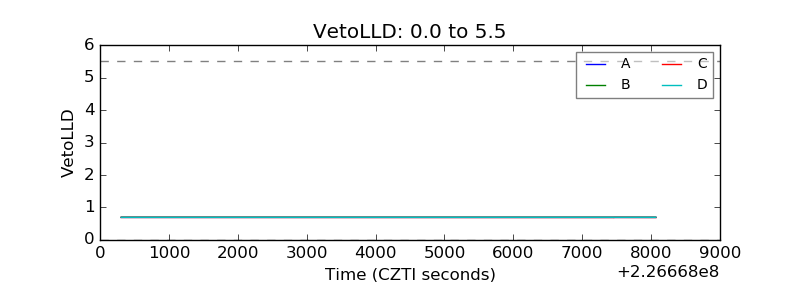 |
| Alpha Counter | 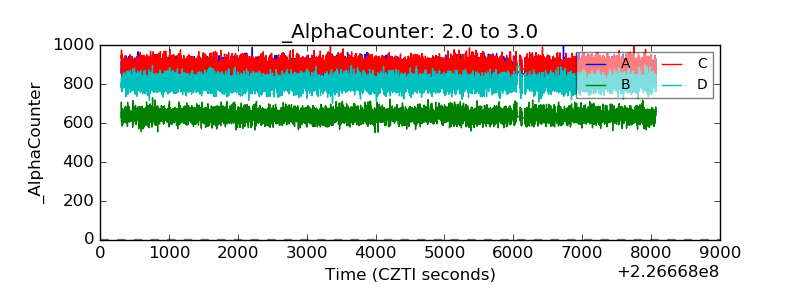 |
| _CPM_Rate | 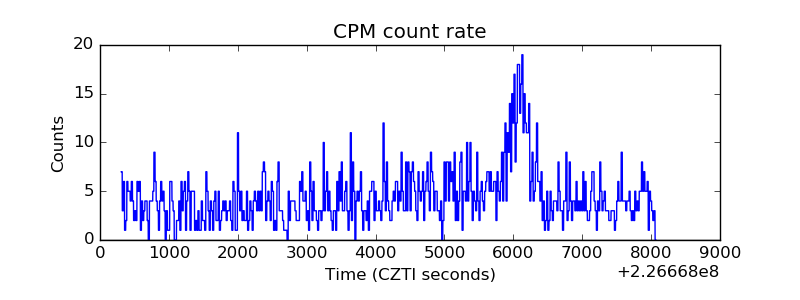 |
| CZT Counter | 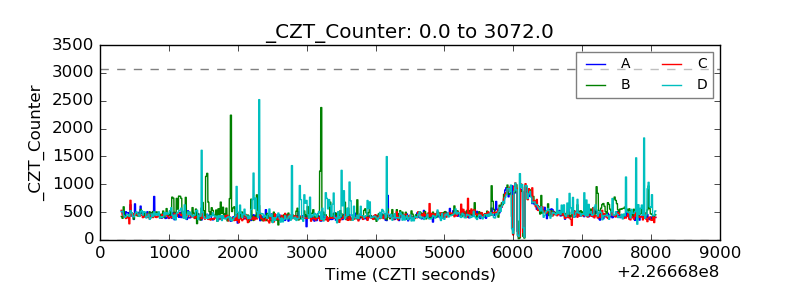 |
| +2.5 Volts monitor |  |
| +5 Volts monitor |  |
| _ROLL_ROT | 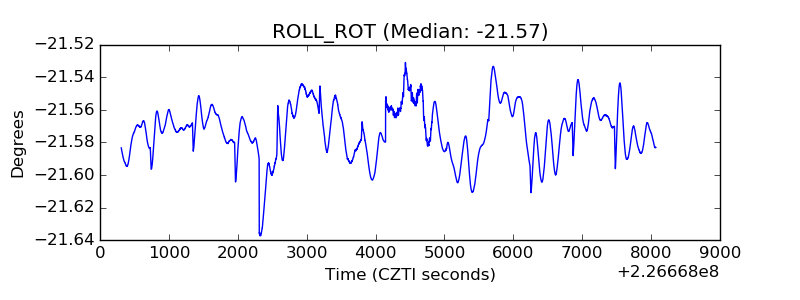 |
| _Roll_DEC | 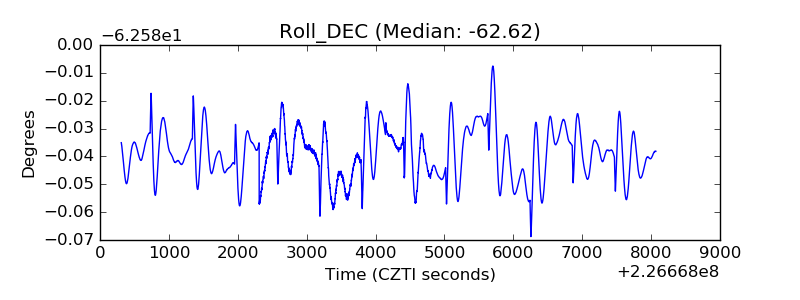 |
| _Roll_RA | 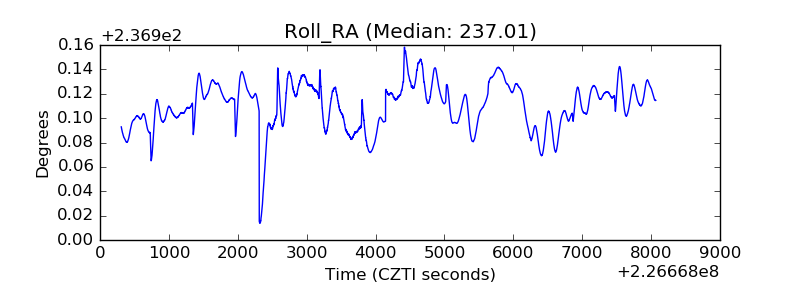 |
| Veto Counter | 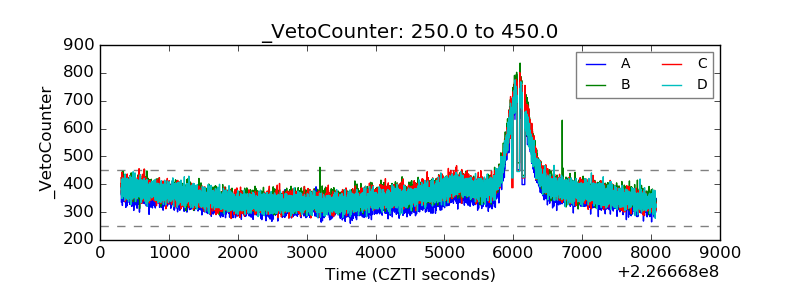 |