| Param | Original file | Final file |
|---|---|---|
| Filename | modeM0/AS1G06_032T01_9000001074_07807cztM0_level2.evt | modeM0/AS1G06_032T01_9000001074_07807cztM0_level2_quad_clean.evt |
| Size (bytes) | 254,882,880 | 48,421,440 |
| Size | 243.1 MB | 46.2 MB |
| Events in quadrant A | 1,741,156 | 297,358 |
| Events in quadrant B | 1,989,379 | 304,232 |
| Events in quadrant C | 1,718,250 | 298,296 |
| Events in quadrant D | 1,999,705 | 286,841 |
| Mode M0 | |||
|---|---|---|---|
| Quadrant | BADHDUFLAG | Total packets | Discarded packets |
| A | 0 | 8113 | 2 |
| B | 0 | 8540 | 1 |
| C | 0 | 8134 | 1 |
| D | 0 | 8835 | 1 |
| Mode SS | |||
|---|---|---|---|
| Quadrant | BADHDUFLAG | Total packets | Discarded packets |
| A | 0 | 80 | 0 |
| B | 0 | 80 | 0 |
| C | 0 | 80 | 0 |
| D | 0 | 80 | 0 |
| Quadrant | Total seconds | Saturated seconds | Saturation percentage |
|---|---|---|---|
| A | 3953 | 65 | 1.644321% |
| B | 3953 | 77 | 1.947888% |
| C | 3953 | 23 | 0.581837% |
| D | 3954 | 50 | 1.264542% |
Noise dominated data is calculated using 1-second bins in cleaned event files. If a bin has >2000 counts, and if more than 50% of those come from <1% of pixels, then it is considered to be noise-dominated and hence unusable.
| Quadrant | # 1 sec bins | Bins with >0 counts | Bins with >2000 counts | High rate bins dominated by noise | Noise dominated (total time) | Noise dominated (detector-on time) | Marked lightcurve |
|---|---|---|---|---|---|---|---|
| A | 3953 | 3953 | 0 | 0 | 0.00% | 0.00% | 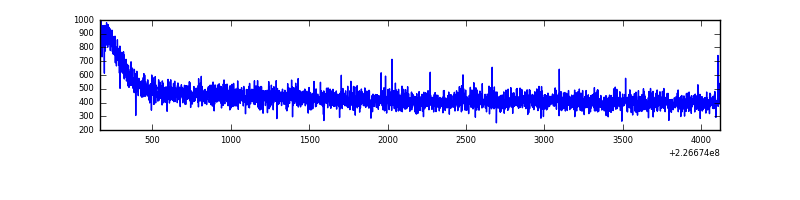 |
| B | 3953 | 3953 | 1 | 1 | 0.03% | 0.03% | 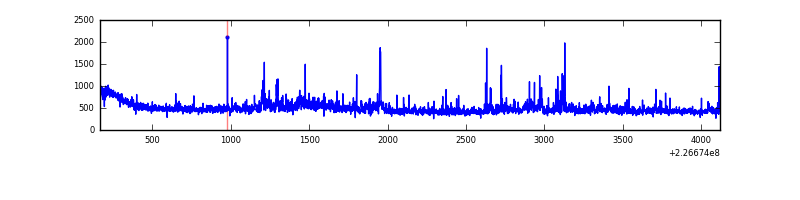 |
| C | 3953 | 3953 | 0 | 0 | 0.00% | 0.00% | 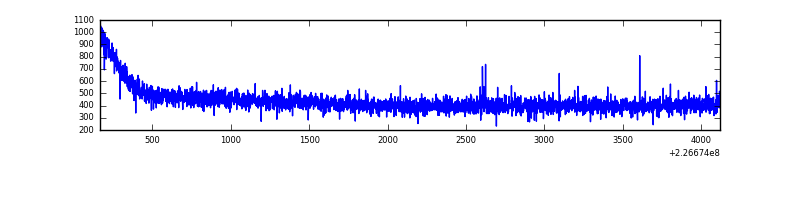 |
| D | 3954 | 3954 | 11 | 11 | 0.28% | 0.28% | 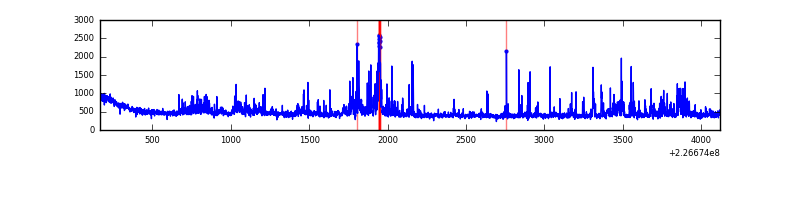 |
Top three noisy pixels from each quadrant. If the there are fewer than three noisy pixels in the level2.evt file, extra rows are filled as -1
| Pixel properties | Quadrant properties | ||||||
|---|---|---|---|---|---|---|---|
| Quadrant | DetID | PixID | Counts | Sigma | Mean | Median | Sigma |
| A | 13 | 14 | 7045 | 70.81 | 449 | 438 | 93.3 |
| A | 3 | 1 | 6171 | 61.44 | 449 | 438 | 93.3 |
| A | 0 | 226 | 4396 | 42.42 | 449 | 438 | 93.3 |
| B | 11 | 51 | 98411 | 1112.02 | 451 | 441 | 88.1 |
| B | 0 | 219 | 29771 | 332.91 | 451 | 441 | 88.1 |
| B | 0 | 214 | 28470 | 318.15 | 451 | 441 | 88.1 |
| C | 8 | 128 | 8535 | 79.27 | 434 | 435 | 102.2 |
| C | 8 | 112 | 4575 | 40.52 | 434 | 435 | 102.2 |
| C | 12 | 4 | 4092 | 35.79 | 434 | 435 | 102.2 |
| D | 2 | 152 | 202860 | 1868.72 | 436 | 421 | 108.3 |
| D | 7 | 55 | 50523 | 462.49 | 436 | 421 | 108.3 |
| D | 13 | 104 | 49503 | 453.08 | 436 | 421 | 108.3 |
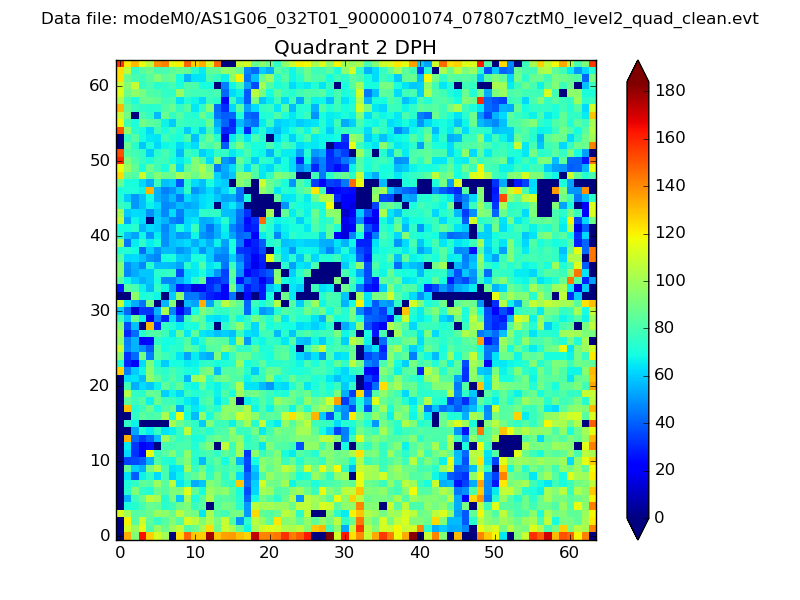
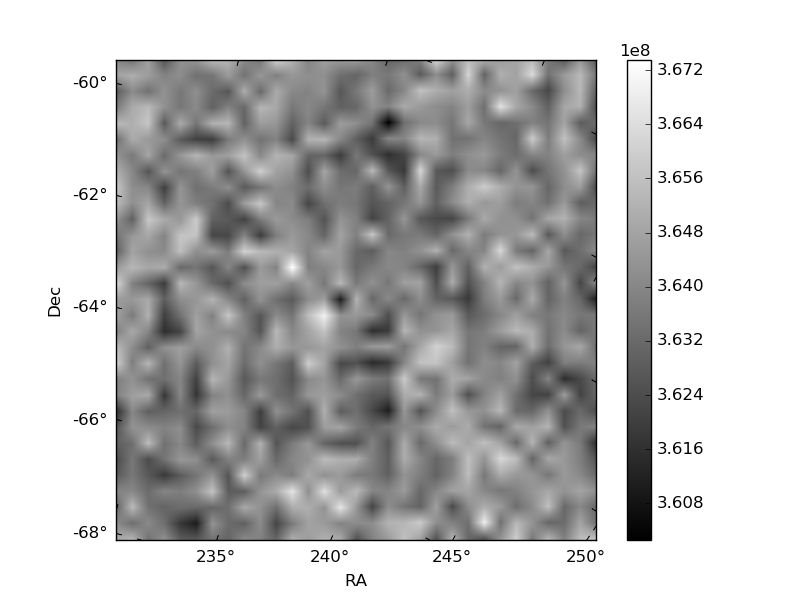
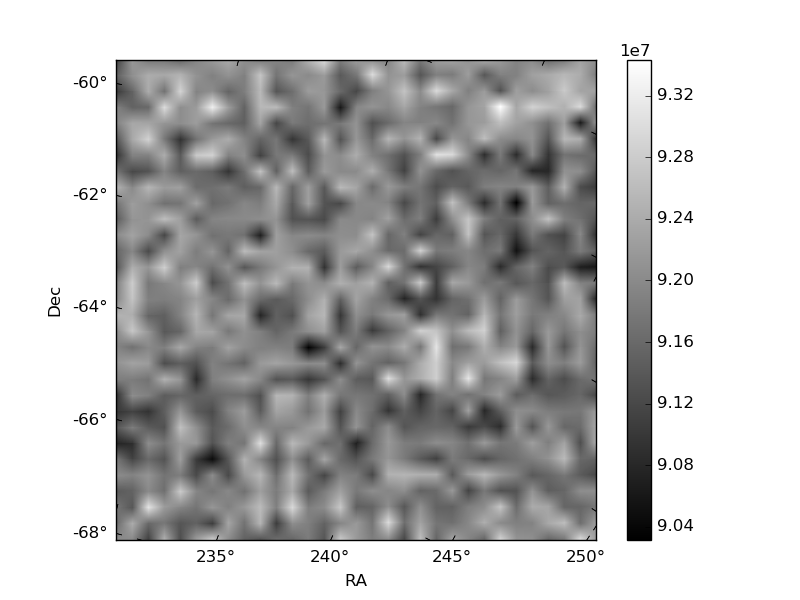
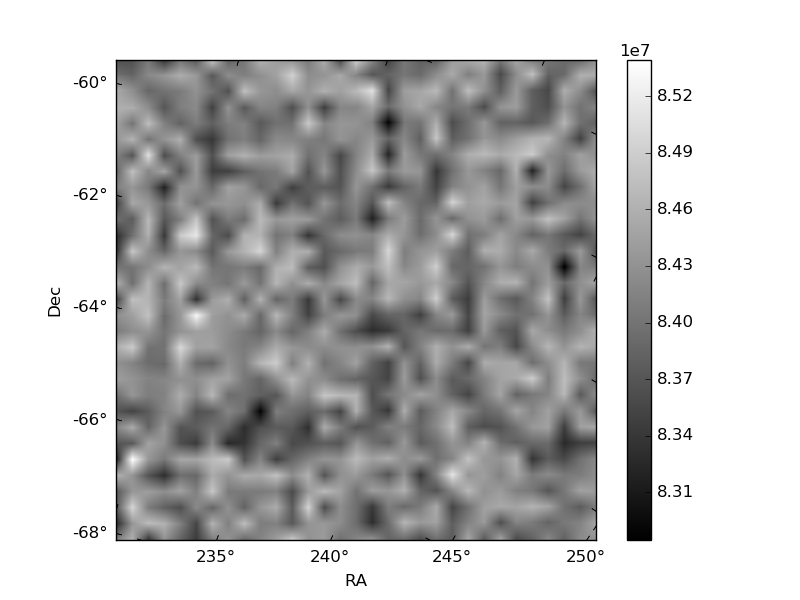
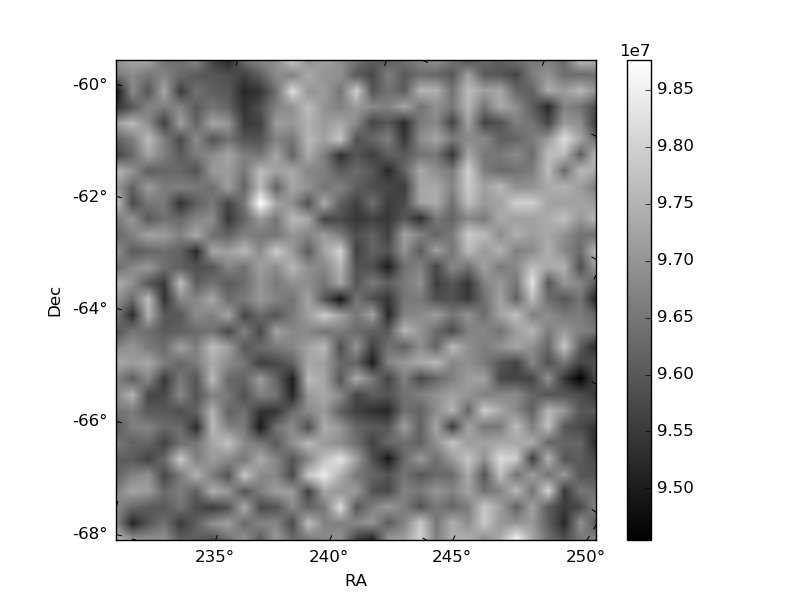
Histogram calculated using DETX and DETY for each event in the final _common_clean file
| Quadrant A | 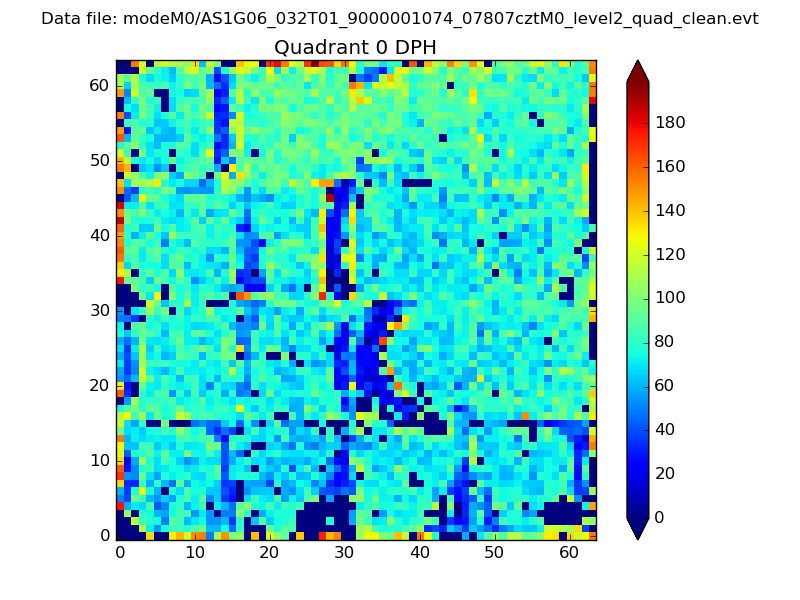 |
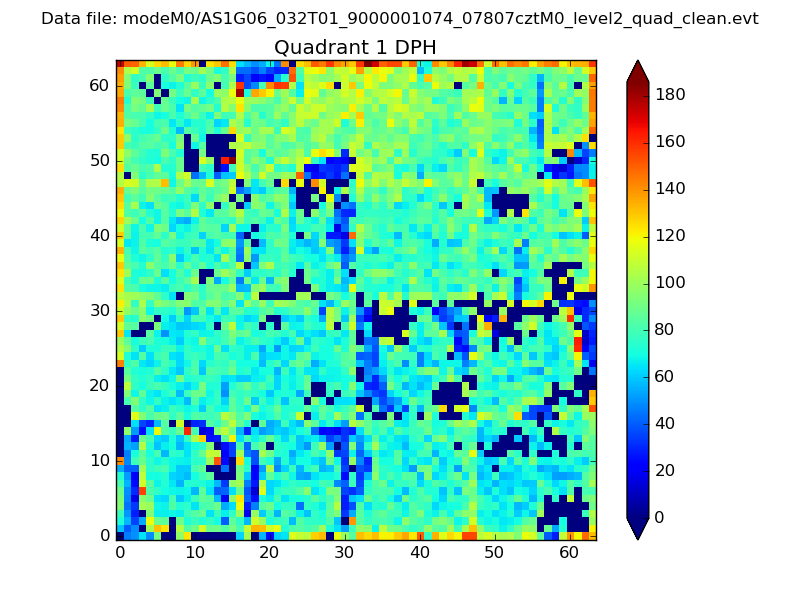 |
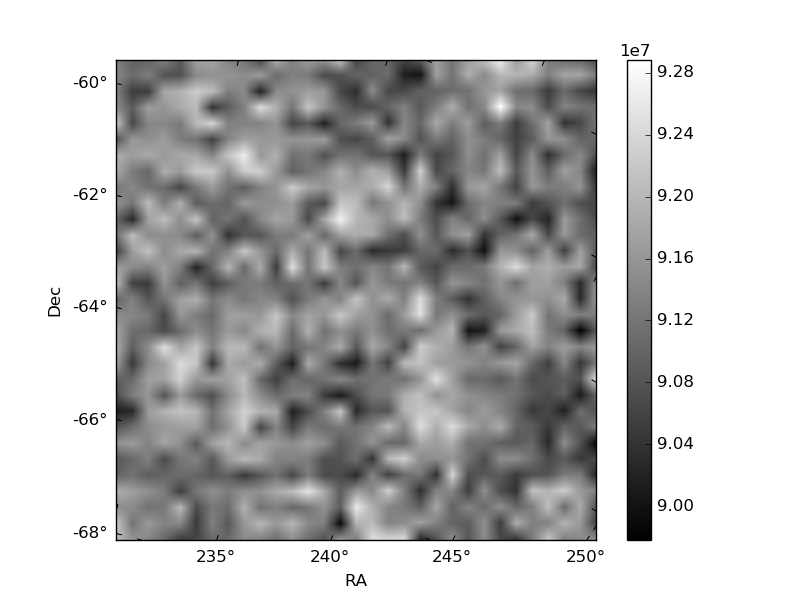
Quadrant B |
|---|---|---|---|
| Quadrant D | 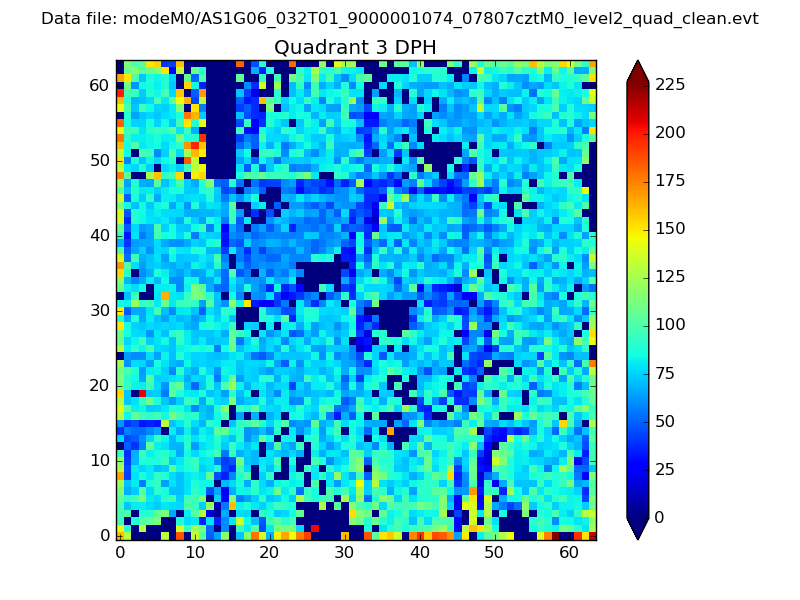 |
 |
Quadrant C |
| Plot type | Count rate plots | Images |
|---|---|---|
| Comparison with Poisson distribution Blue bars denote a histogram of data divided into 1 sec bins. Red curve is a Poisson curve with rate = median count rate of data. |
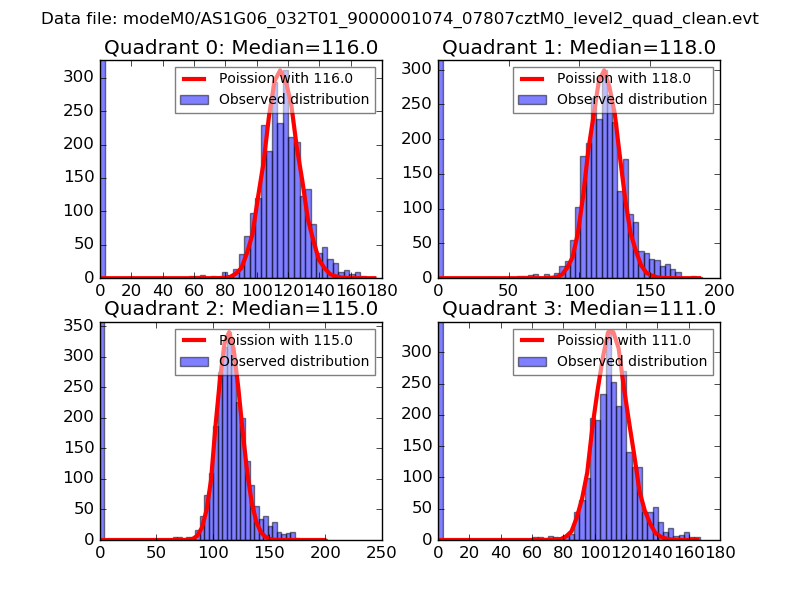 |
 |
| Quadrant-wise count rates Data is divided into 100 sec bins |
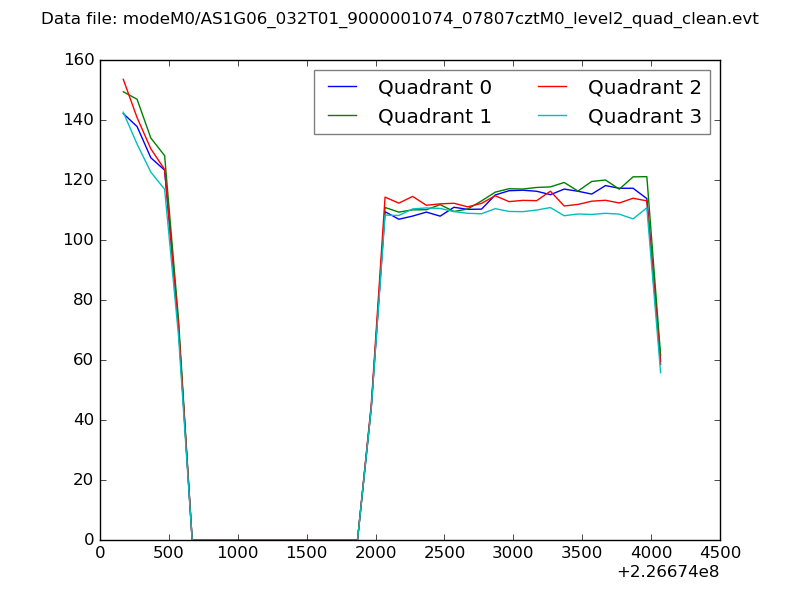 |
|
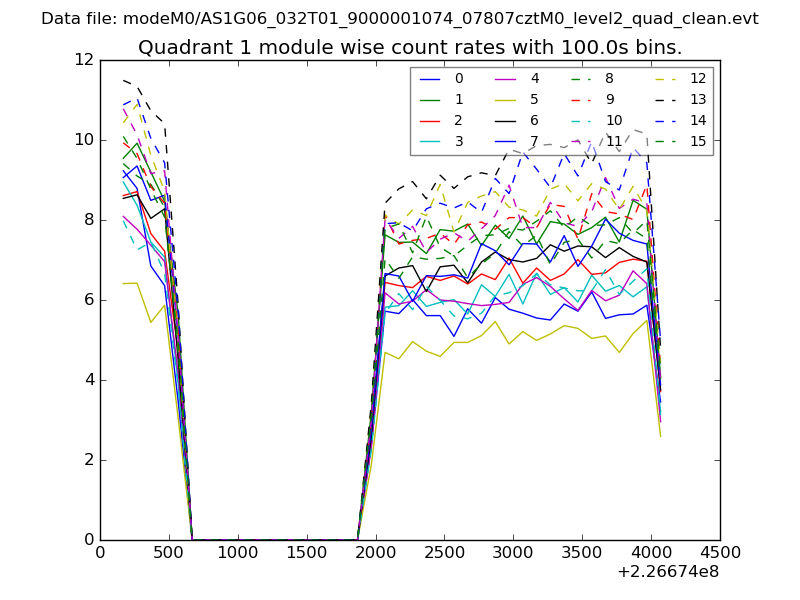
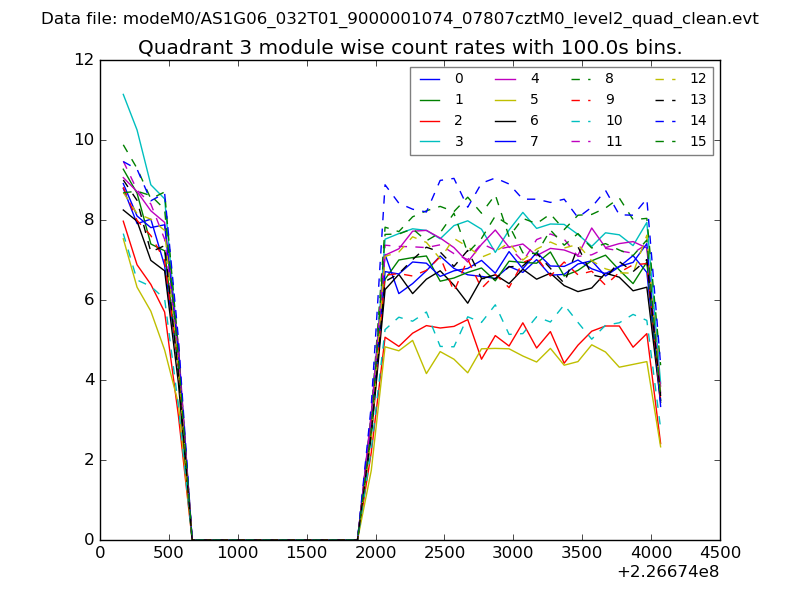
| Module-wise count rates for Quadrant A Data is divided into 100 sec bins |
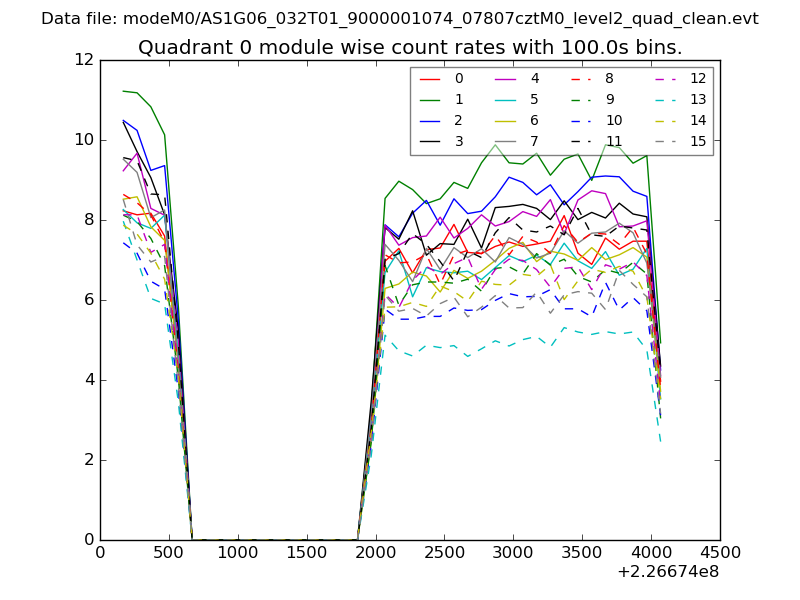 |
 |
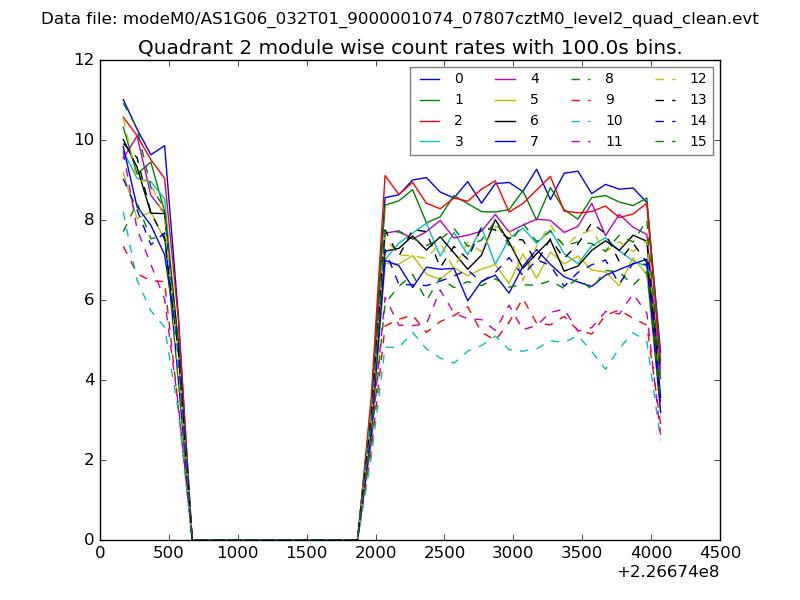
| Module-wise count rates for Quadrant B Data is divided into 100 sec bins |
 |
 |
| Module-wise count rates for Quadrant C Data is divided into 100 sec bins |
 |
 |
| Module-wise count rates for Quadrant D Data is divided into 100 sec bins |
 |
 |
| Parameter | Plot |
|---|---|
| CZT HV Monitor | 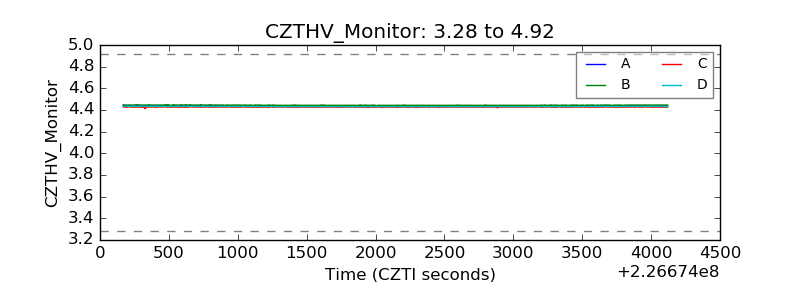 |
| D_VDD | 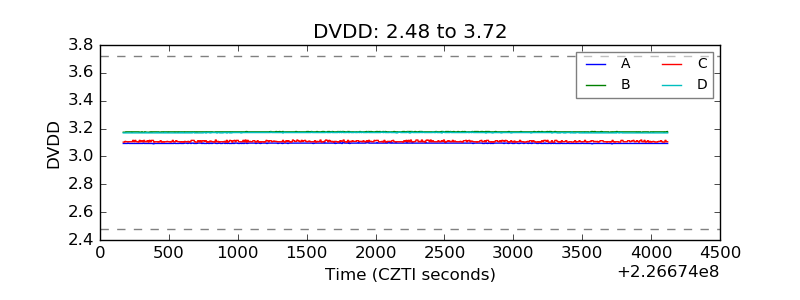 |
| Temperature 1 | 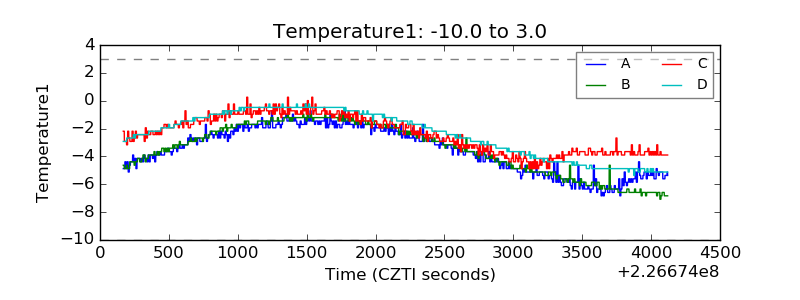 |
| Veto HV Monitor | 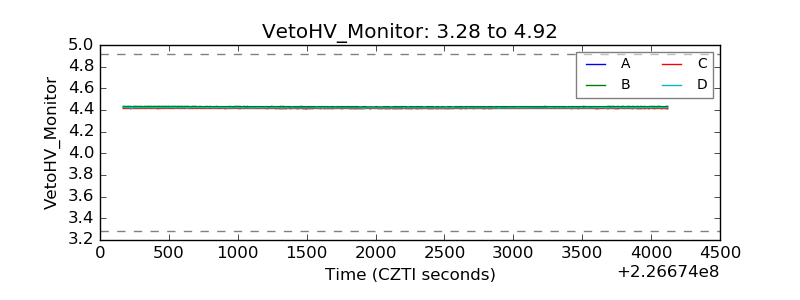 |
| Veto LLD | 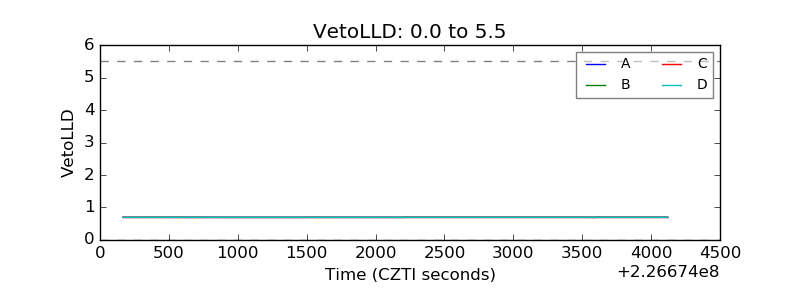 |
| Alpha Counter | 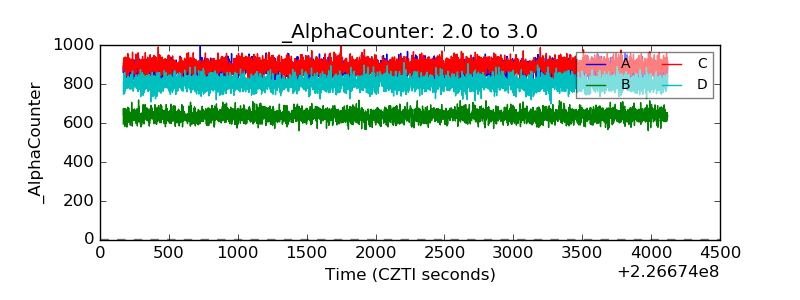 |
| _CPM_Rate | 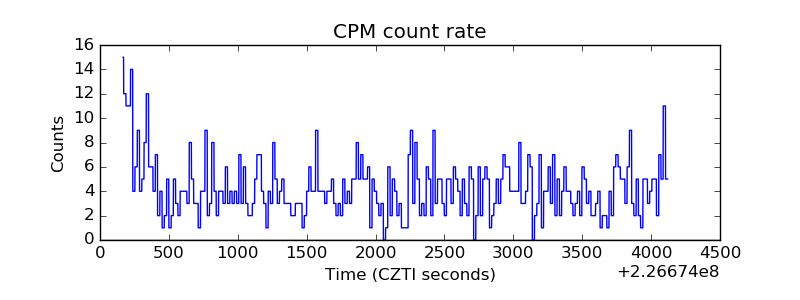 |
| CZT Counter | 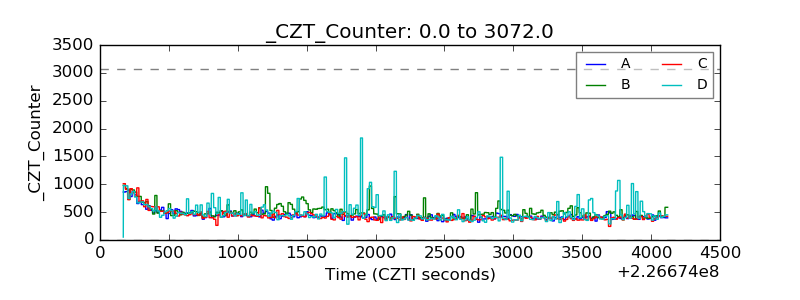 |
| +2.5 Volts monitor | 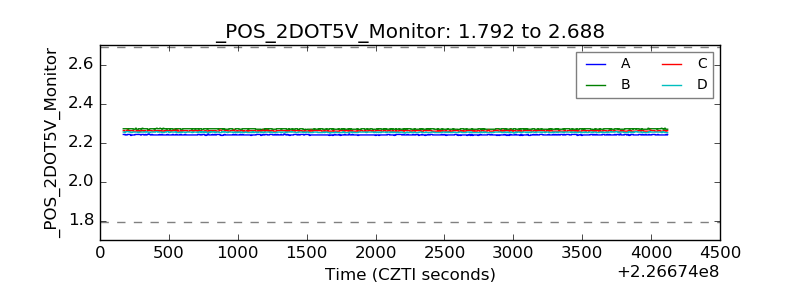 |
| +5 Volts monitor | 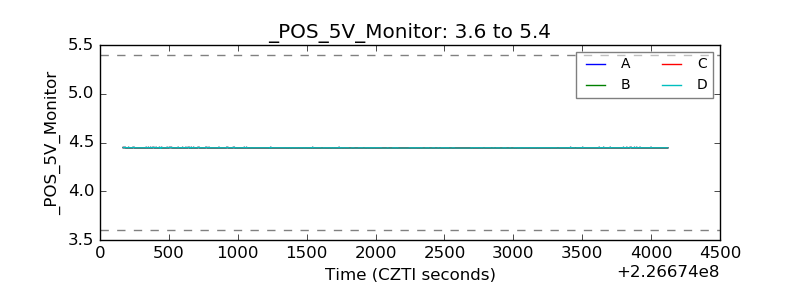 |
| _ROLL_ROT | 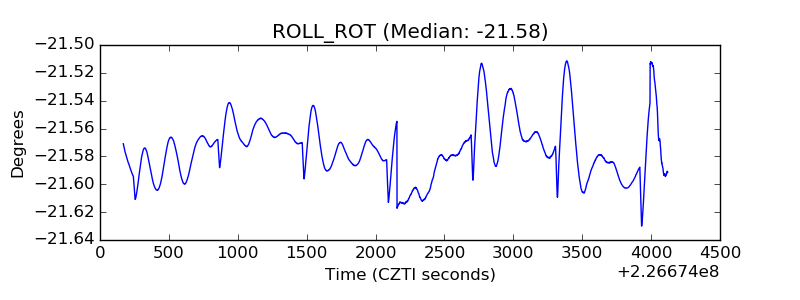 |
| _Roll_DEC | 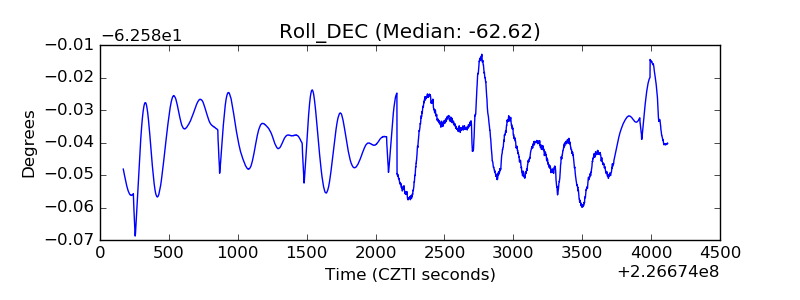 |
| _Roll_RA | 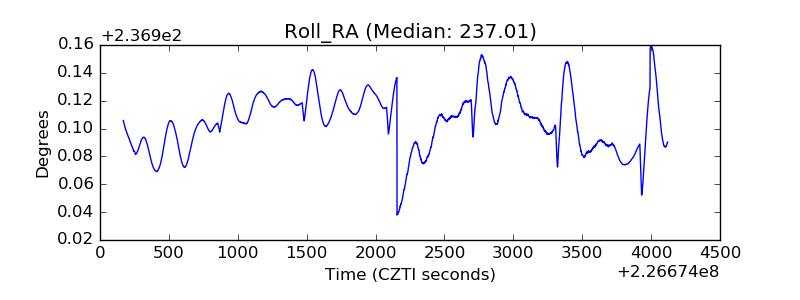 |
| Veto Counter | 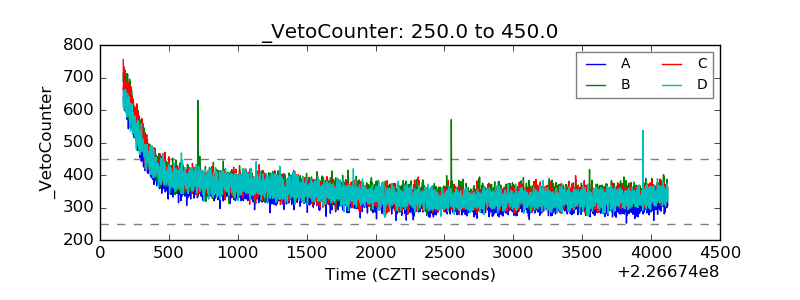 |