| Param | Original file | Final file |
|---|---|---|
| Filename | modeM0/AS1G06_032T01_9000001074_07809cztM0_level2.evt | modeM0/AS1G06_032T01_9000001074_07809cztM0_level2_quad_clean.evt |
| Size (bytes) | 642,093,120 | 146,010,240 |
| Size | 612.3 MB | 139.2 MB |
| Events in quadrant A | 4,499,802 | 942,461 |
| Events in quadrant B | 4,918,491 | 965,665 |
| Events in quadrant C | 4,486,601 | 928,294 |
| Events in quadrant D | 4,859,243 | 889,692 |
| Mode M0 | |||
|---|---|---|---|
| Quadrant | BADHDUFLAG | Total packets | Discarded packets |
| A | 0 | 20460 | 3 |
| B | 0 | 21260 | 2 |
| C | 0 | 20493 | 2 |
| D | 0 | 21821 | 2 |
| Mode M9 | |||
|---|---|---|---|
| Quadrant | BADHDUFLAG | Total packets | Discarded packets |
| A | 0 | 9 | 0 |
| B | 0 | 9 | 0 |
| C | 0 | 9 | 0 |
| D | 0 | 9 | 0 |
| Mode SS | |||
|---|---|---|---|
| Quadrant | BADHDUFLAG | Total packets | Discarded packets |
| A | 0 | 206 | 0 |
| B | 0 | 206 | 0 |
| C | 0 | 206 | 0 |
| D | 0 | 206 | 0 |
| Quadrant | Total seconds | Saturated seconds | Saturation percentage |
|---|---|---|---|
| A | 10044 | 77 | 0.766627% |
| B | 10044 | 114 | 1.135006% |
| C | 10044 | 42 | 0.418160% |
| D | 10044 | 128 | 1.274393% |
Noise dominated data is calculated using 1-second bins in cleaned event files. If a bin has >2000 counts, and if more than 50% of those come from <1% of pixels, then it is considered to be noise-dominated and hence unusable.
| Quadrant | # 1 sec bins | Bins with >0 counts | Bins with >2000 counts | High rate bins dominated by noise | Noise dominated (total time) | Noise dominated (detector-on time) | Marked lightcurve |
|---|---|---|---|---|---|---|---|
| A | 11004 | 10044 | 0 | 0 | 0.00% | 0.00% |  |
| B | 11004 | 10044 | 12 | 12 | 0.11% | 0.12% |  |
| C | 11004 | 10045 | 0 | 0 | 0.00% | 0.00% | 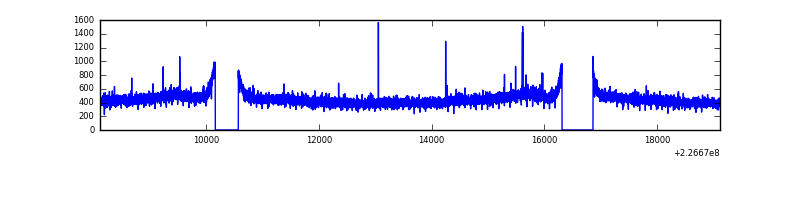 |
| D | 11004 | 10044 | 61 | 61 | 0.55% | 0.61% | 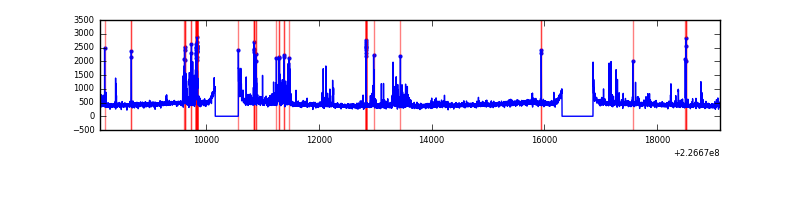 |
Top three noisy pixels from each quadrant. If the there are fewer than three noisy pixels in the level2.evt file, extra rows are filled as -1
| Pixel properties | Quadrant properties | ||||||
|---|---|---|---|---|---|---|---|
| Quadrant | DetID | PixID | Counts | Sigma | Mean | Median | Sigma |
| A | 3 | 1 | 15941 | 62.54 | 1160 | 1132 | 236.8 |
| A | 13 | 14 | 14250 | 55.4 | 1160 | 1132 | 236.8 |
| A | 0 | 226 | 11034 | 41.82 | 1160 | 1132 | 236.8 |
| B | 11 | 51 | 106327 | 470.02 | 1175 | 1148 | 223.8 |
| B | 4 | 239 | 64374 | 282.54 | 1175 | 1148 | 223.8 |
| B | 0 | 219 | 59079 | 258.88 | 1175 | 1148 | 223.8 |
| C | 1 | 16 | 24827 | 90.39 | 1134 | 1139 | 262.1 |
| C | 8 | 128 | 10955 | 37.46 | 1134 | 1139 | 262.1 |
| C | 14 | 234 | 9423 | 31.61 | 1134 | 1139 | 262.1 |
| D | 2 | 152 | 219525 | 791.3 | 1126 | 1088 | 276.0 |
| D | 12 | 233 | 158694 | 570.94 | 1126 | 1088 | 276.0 |
| D | 13 | 104 | 85977 | 307.52 | 1126 | 1088 | 276.0 |
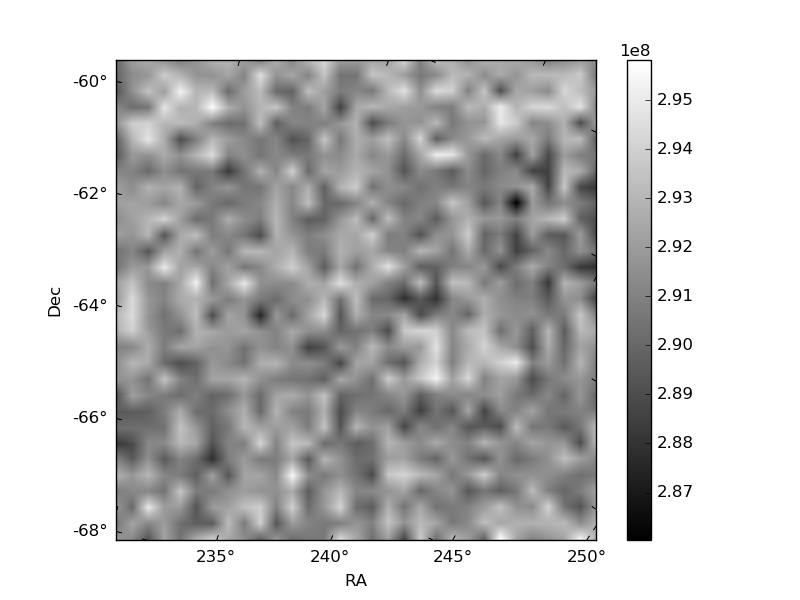
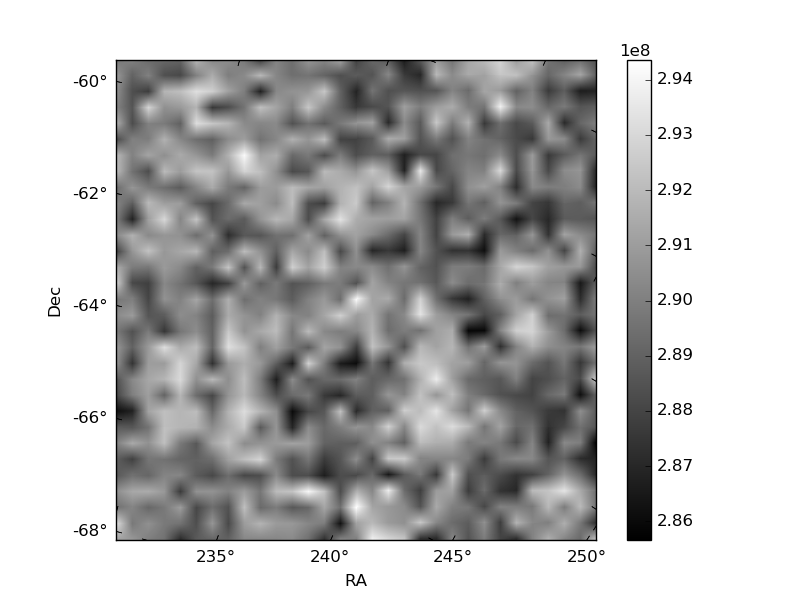
Histogram calculated using DETX and DETY for each event in the final _common_clean file
| Quadrant A | 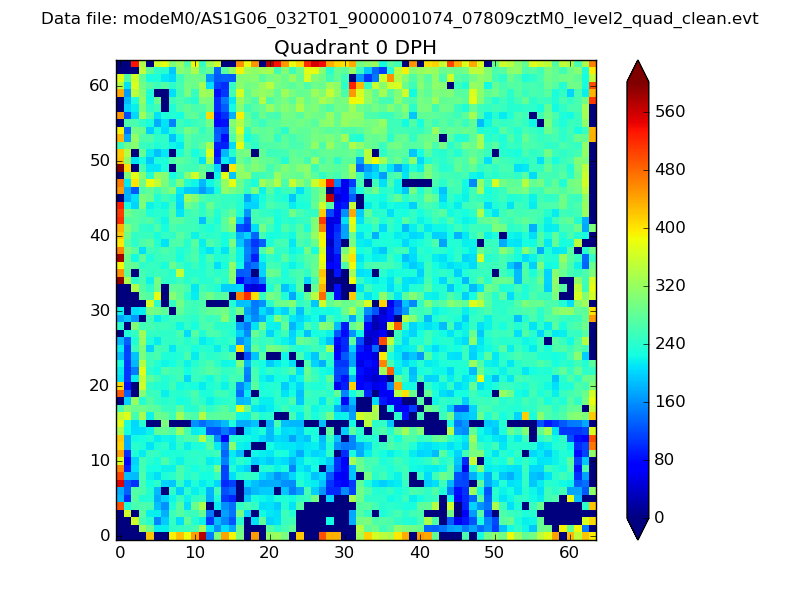 |
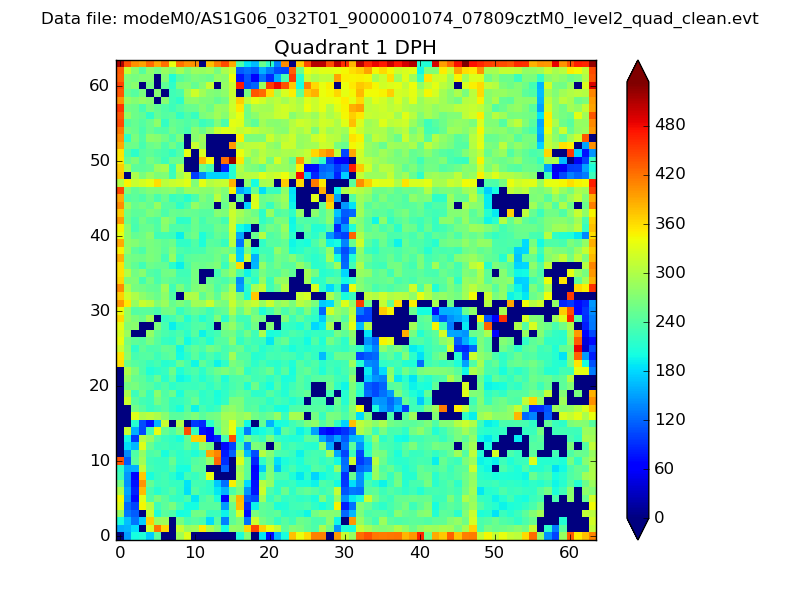 |
Quadrant B |
|---|---|---|---|
| Quadrant D |  |
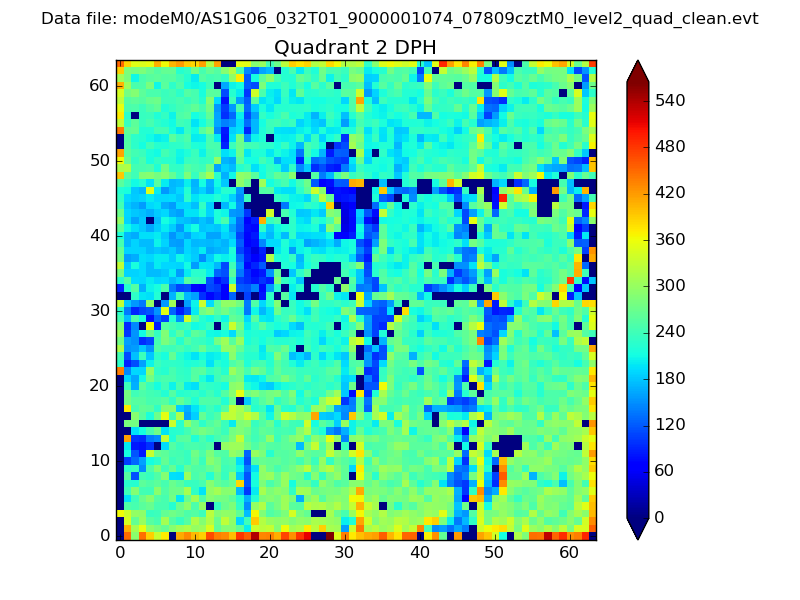 |
Quadrant C |
| Plot type | Count rate plots | Images |
|---|---|---|
| Comparison with Poisson distribution Blue bars denote a histogram of data divided into 1 sec bins. Red curve is a Poisson curve with rate = median count rate of data. |
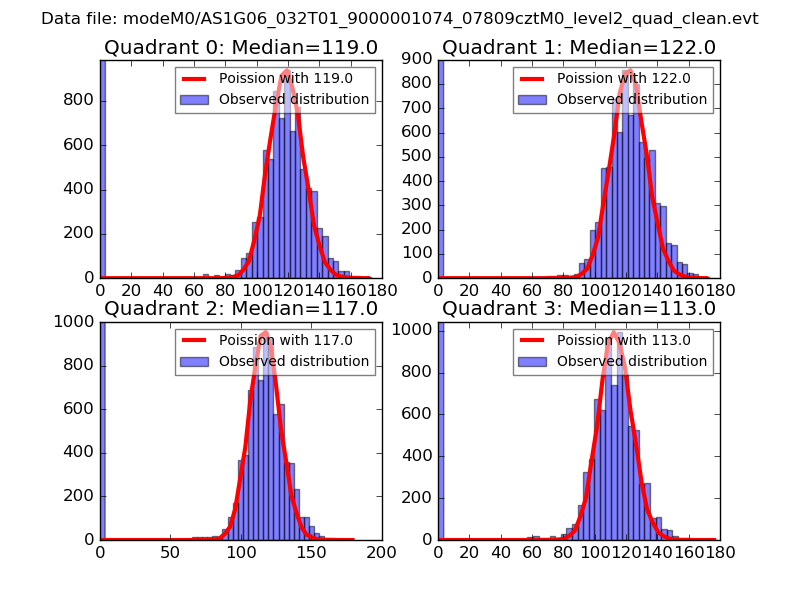 |
 |
| Quadrant-wise count rates Data is divided into 100 sec bins |
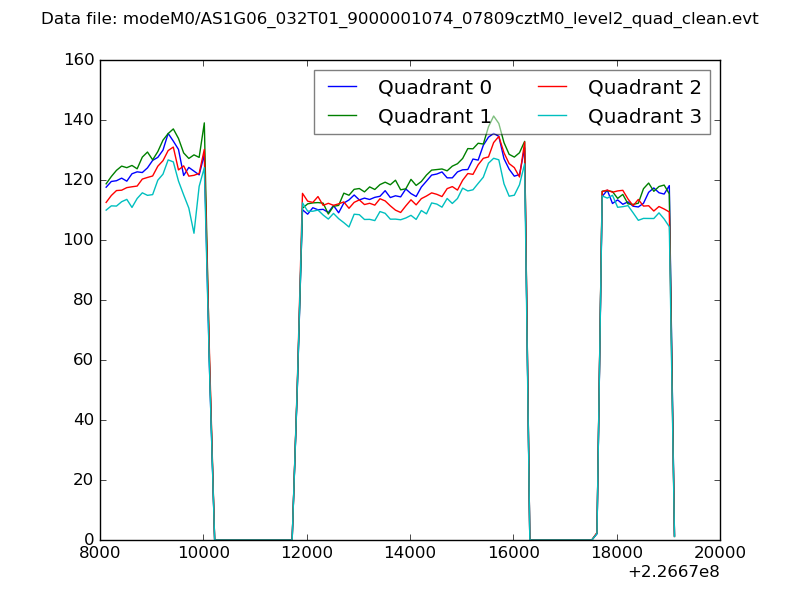 |
|
| Module-wise count rates for Quadrant A Data is divided into 100 sec bins |
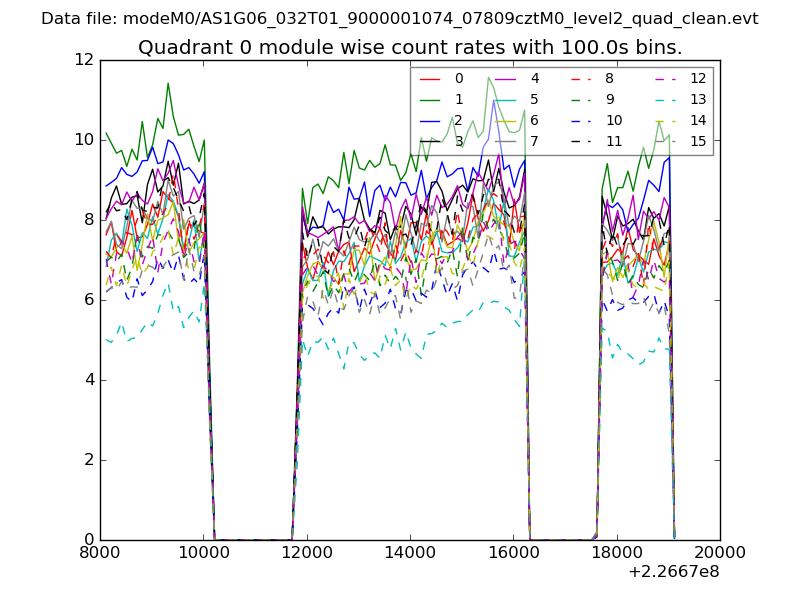 |
 |
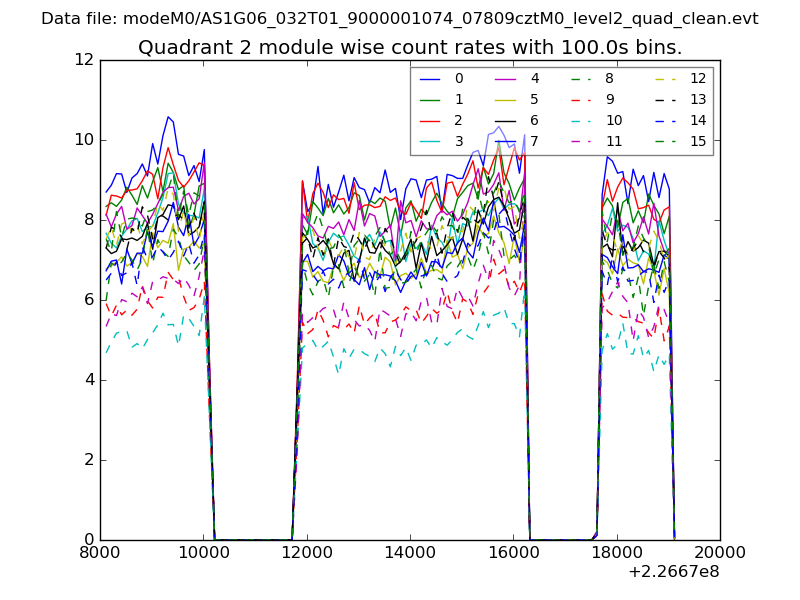
| Module-wise count rates for Quadrant B Data is divided into 100 sec bins |
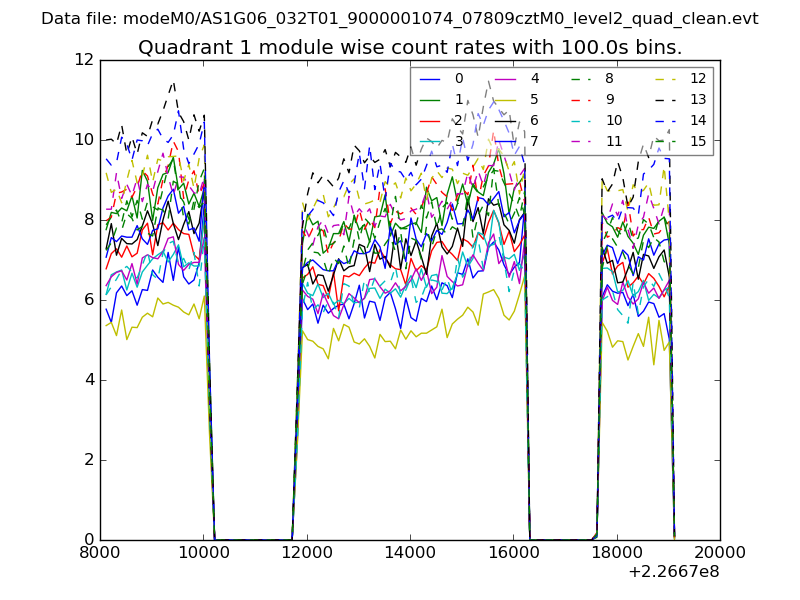 |
 |
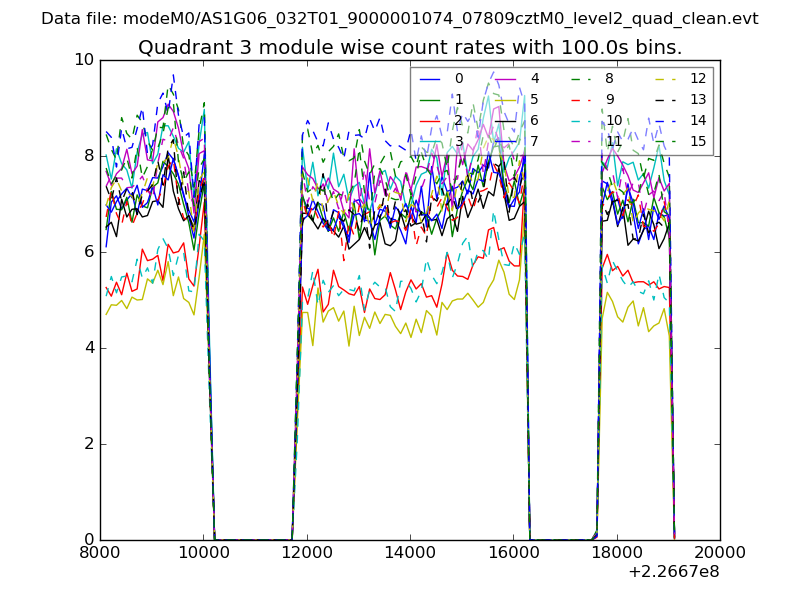
| Module-wise count rates for Quadrant C Data is divided into 100 sec bins |
 |
 |
| Module-wise count rates for Quadrant D Data is divided into 100 sec bins |
 |
 |
| Parameter | Plot |
|---|---|
| CZT HV Monitor | 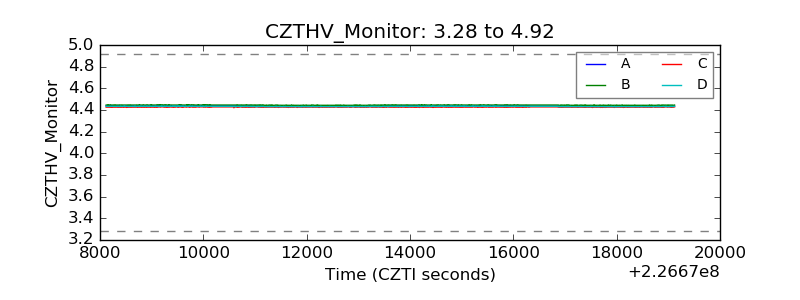 |
| D_VDD | 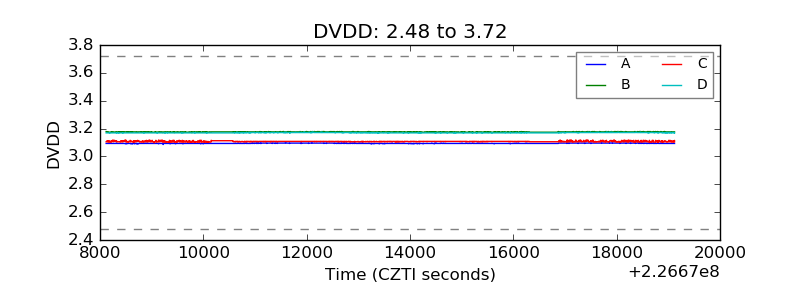 |
| Temperature 1 | 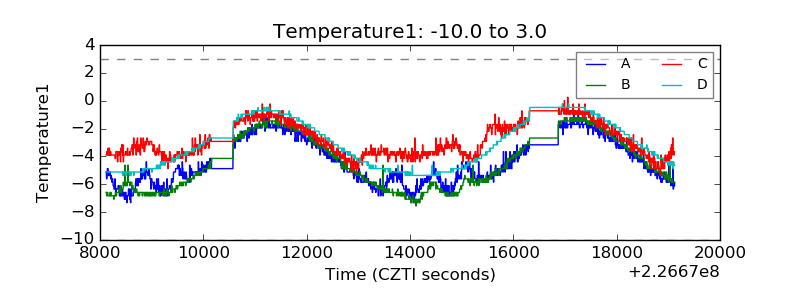 |
| Veto HV Monitor | 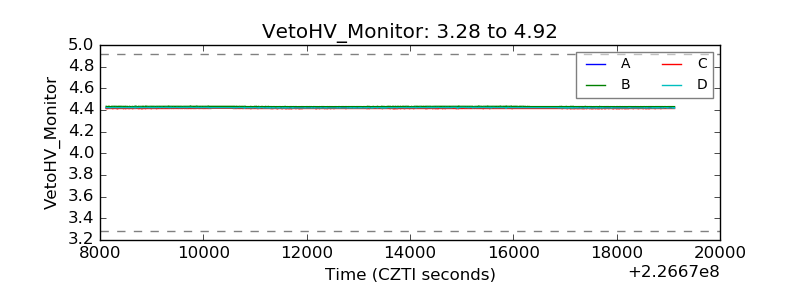 |
| Veto LLD |  |
| Alpha Counter | 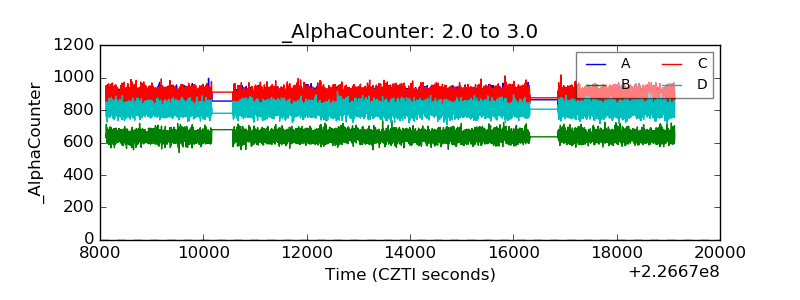 |
| _CPM_Rate | 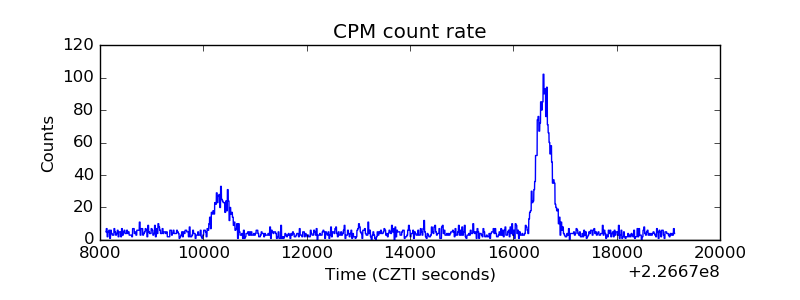 |
| CZT Counter | 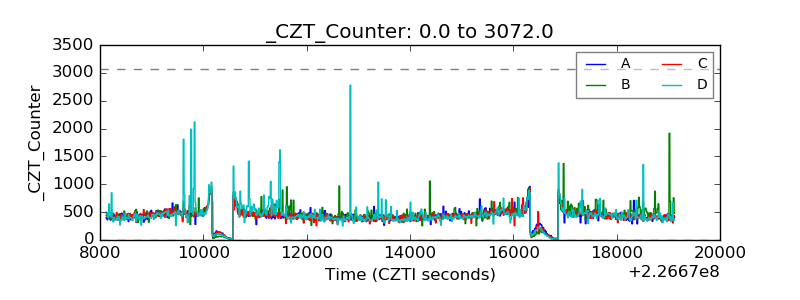 |
| +2.5 Volts monitor | 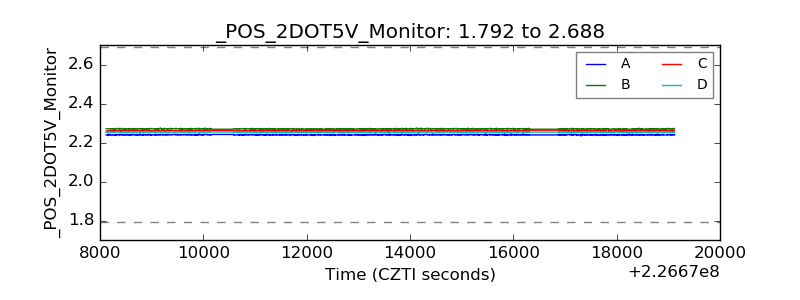 |
| +5 Volts monitor |  |
| _ROLL_ROT | 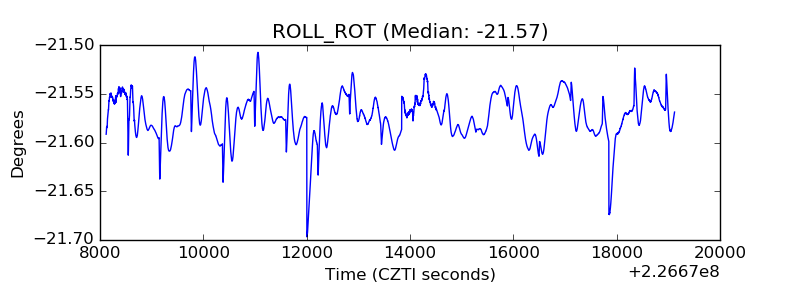 |
| _Roll_DEC | 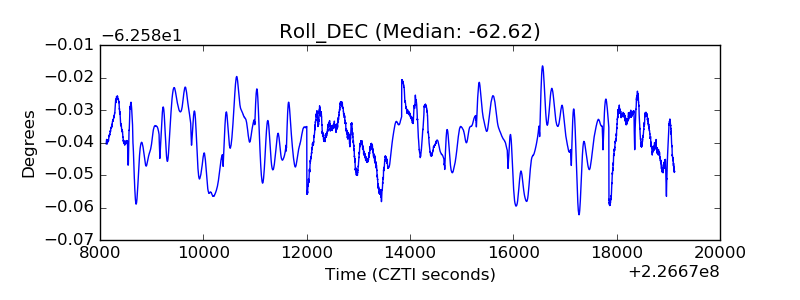 |
| _Roll_RA | 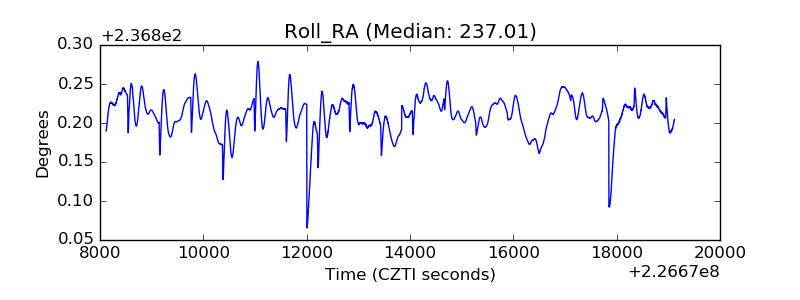 |
| Veto Counter | 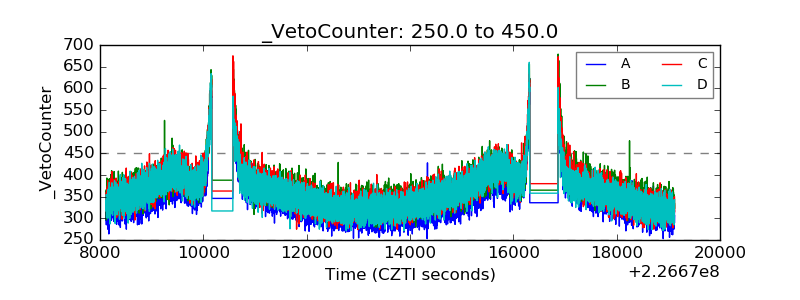 |