| Param | Original file | Final file |
|---|---|---|
| Filename | modeM0/AS1G06_032T01_9000001074_07811cztM0_level2.evt | modeM0/AS1G06_032T01_9000001074_07811cztM0_level2_quad_clean.evt |
| Size (bytes) | 425,246,400 | 105,249,600 |
| Size | 405.5 MB | 100.4 MB |
| Events in quadrant A | 2,926,310 | 690,025 |
| Events in quadrant B | 3,382,245 | 709,690 |
| Events in quadrant C | 2,891,730 | 682,106 |
| Events in quadrant D | 3,232,902 | 649,110 |
| Mode M0 | |||
|---|---|---|---|
| Quadrant | BADHDUFLAG | Total packets | Discarded packets |
| A | 0 | 13256 | 3 |
| B | 0 | 14364 | 2 |
| C | 0 | 13221 | 2 |
| D | 0 | 14243 | 2 |
| Mode M9 | |||
|---|---|---|---|
| Quadrant | BADHDUFLAG | Total packets | Discarded packets |
| A | 0 | 11 | 0 |
| B | 0 | 11 | 0 |
| C | 0 | 11 | 0 |
| D | 0 | 12 | 0 |
| Mode SS | |||
|---|---|---|---|
| Quadrant | BADHDUFLAG | Total packets | Discarded packets |
| A | 0 | 134 | 0 |
| B | 0 | 134 | 0 |
| C | 0 | 134 | 0 |
| D | 0 | 134 | 0 |
| Quadrant | Total seconds | Saturated seconds | Saturation percentage |
|---|---|---|---|
| A | 6546 | 23 | 0.351360% |
| B | 6546 | 73 | 1.115185% |
| C | 6546 | 9 | 0.137489% |
| D | 6546 | 36 | 0.549954% |
Noise dominated data is calculated using 1-second bins in cleaned event files. If a bin has >2000 counts, and if more than 50% of those come from <1% of pixels, then it is considered to be noise-dominated and hence unusable.
| Quadrant | # 1 sec bins | Bins with >0 counts | Bins with >2000 counts | High rate bins dominated by noise | Noise dominated (total time) | Noise dominated (detector-on time) | Marked lightcurve |
|---|---|---|---|---|---|---|---|
| A | 7561 | 6546 | 0 | 0 | 0.00% | 0.00% | 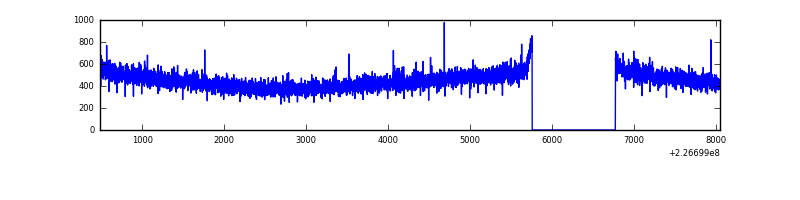 |
| B | 7561 | 6546 | 21 | 21 | 0.28% | 0.32% | 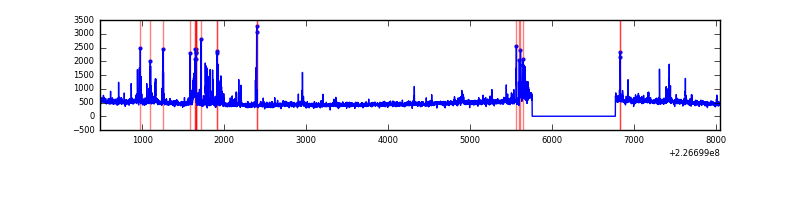 |
| C | 7561 | 6546 | 0 | 0 | 0.00% | 0.00% | 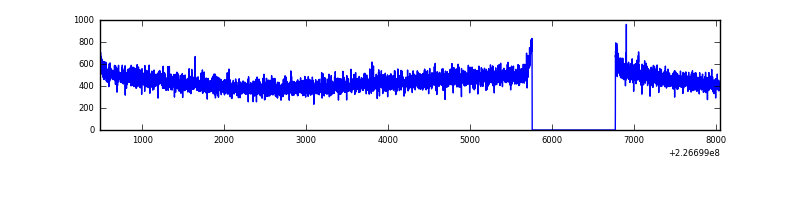 |
| D | 7561 | 6547 | 19 | 19 | 0.25% | 0.29% | 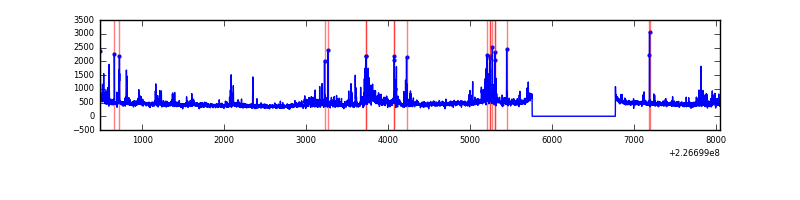 |
Top three noisy pixels from each quadrant. If the there are fewer than three noisy pixels in the level2.evt file, extra rows are filled as -1
| Pixel properties | Quadrant properties | ||||||
|---|---|---|---|---|---|---|---|
| Quadrant | DetID | PixID | Counts | Sigma | Mean | Median | Sigma |
| A | 13 | 14 | 7987 | 46.67 | 756 | 742 | 155.2 |
| A | 0 | 226 | 7186 | 41.51 | 756 | 742 | 155.2 |
| A | 12 | 194 | 6597 | 37.72 | 756 | 742 | 155.2 |
| B | 4 | 239 | 122529 | 832.8 | 768 | 749 | 146.2 |
| B | 10 | 246 | 119526 | 812.27 | 768 | 749 | 146.2 |
| B | 0 | 219 | 56849 | 383.64 | 768 | 749 | 146.2 |
| C | 1 | 16 | 19225 | 107.96 | 734 | 738 | 171.2 |
| C | 12 | 4 | 6429 | 33.23 | 734 | 738 | 171.2 |
| C | 13 | 61 | 5713 | 29.05 | 734 | 738 | 171.2 |
| D | 13 | 104 | 191808 | 1066.89 | 728 | 706 | 179.1 |
| D | 2 | 152 | 138666 | 770.2 | 728 | 706 | 179.1 |
| D | 2 | 14 | 71879 | 397.34 | 728 | 706 | 179.1 |
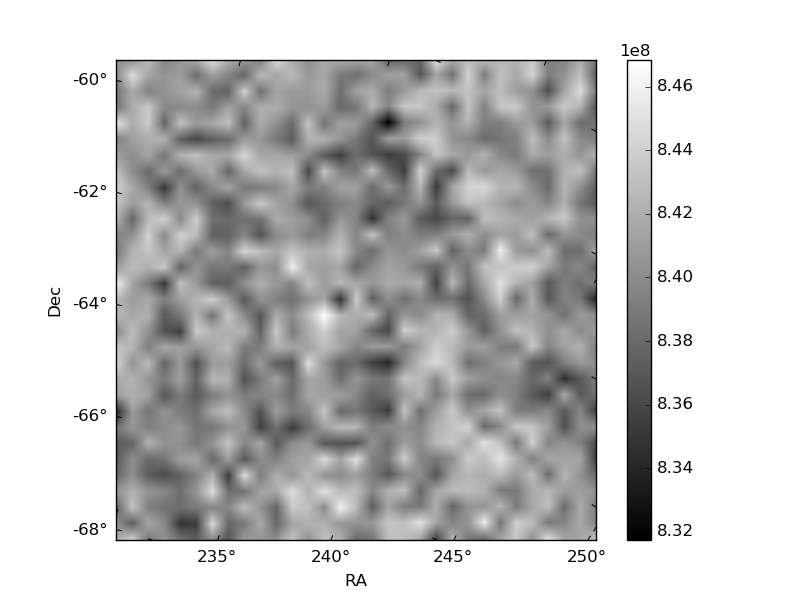
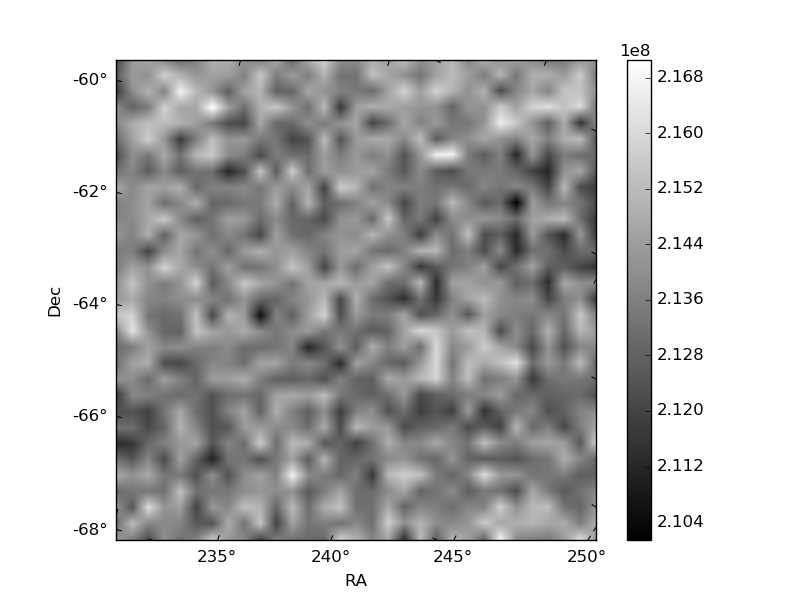
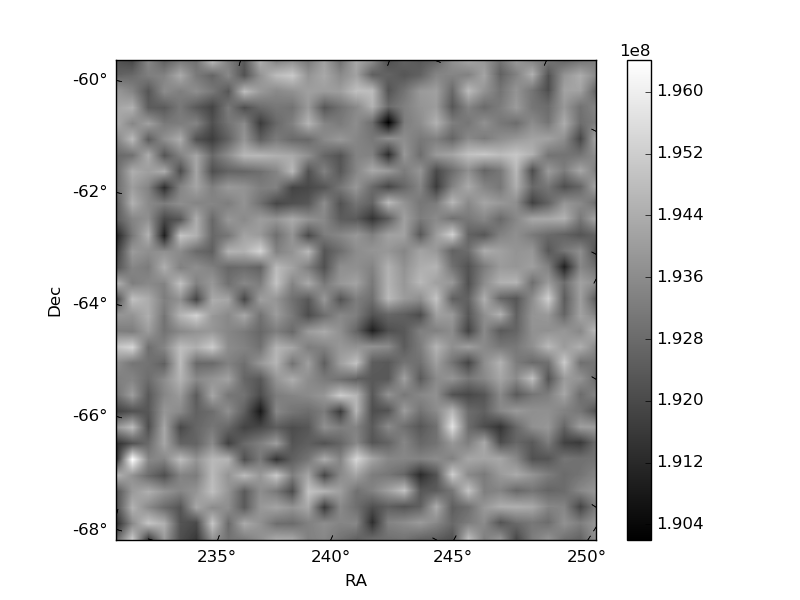
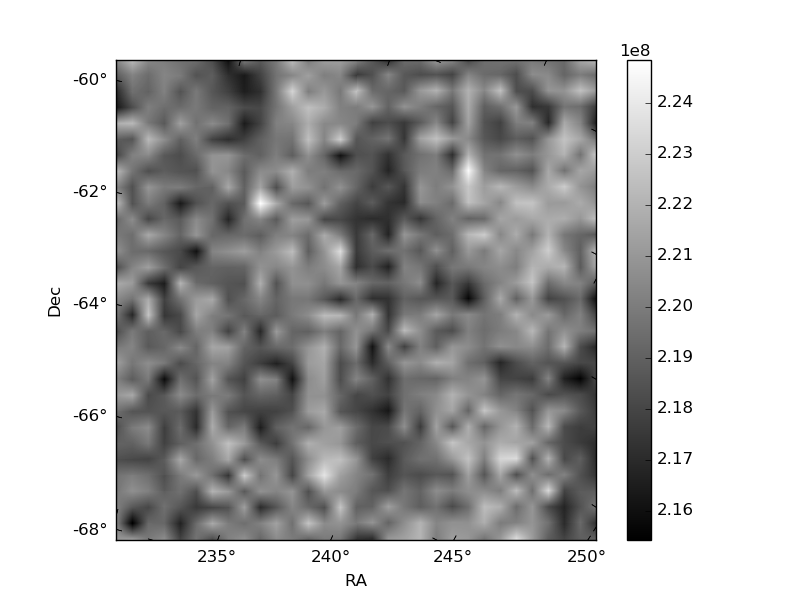
Histogram calculated using DETX and DETY for each event in the final _common_clean file
| Quadrant A | 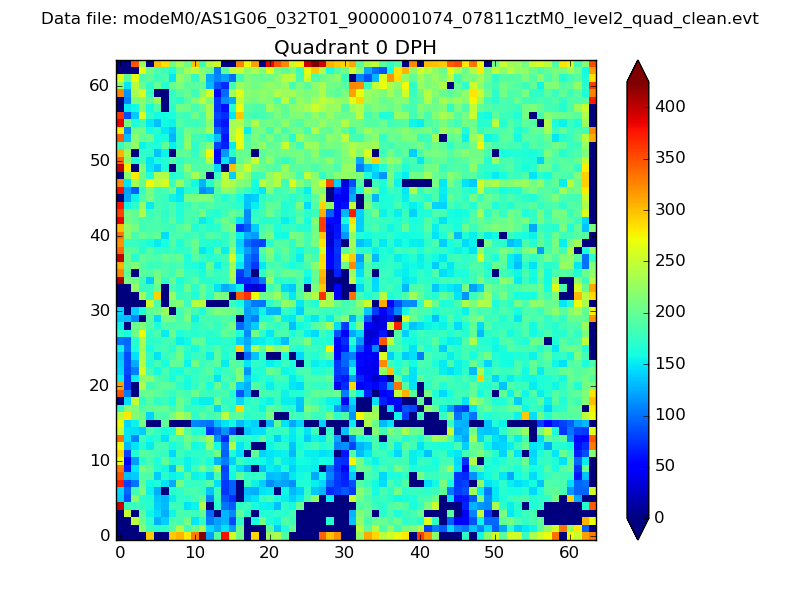 |
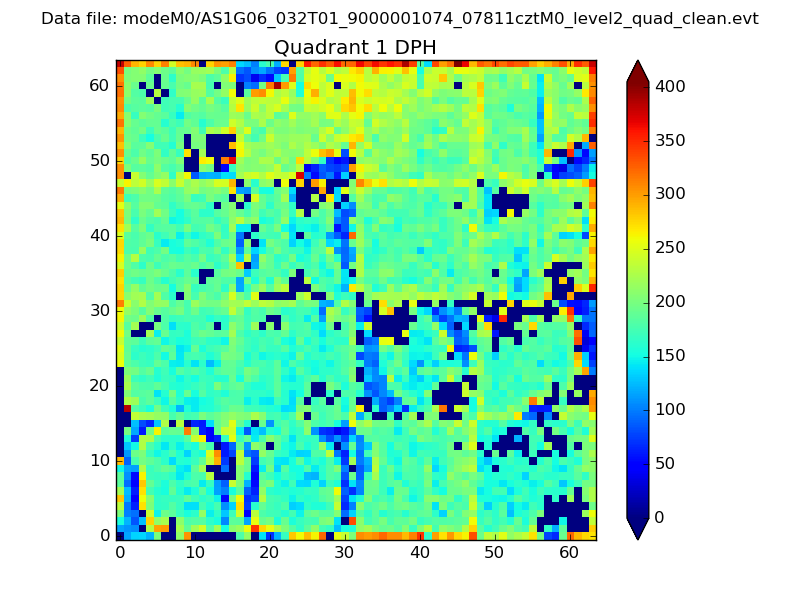 |
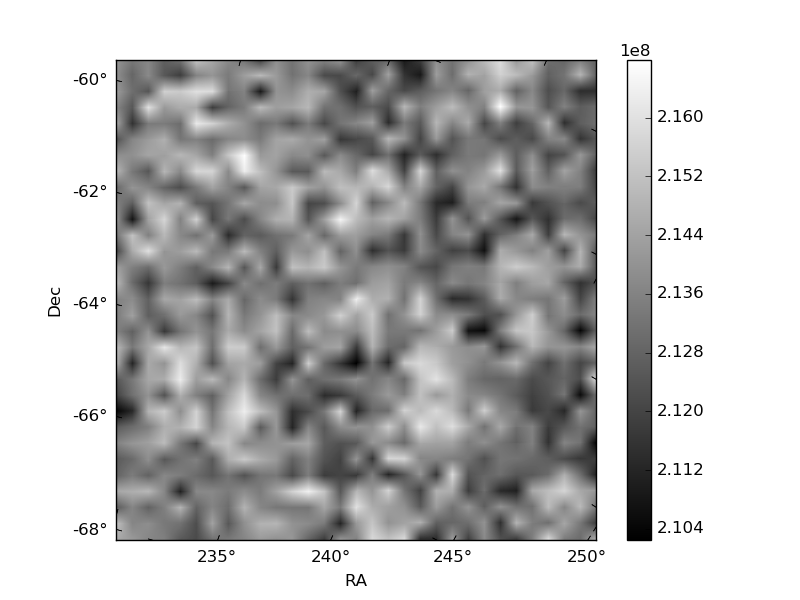
Quadrant B |
|---|---|---|---|
| Quadrant D | 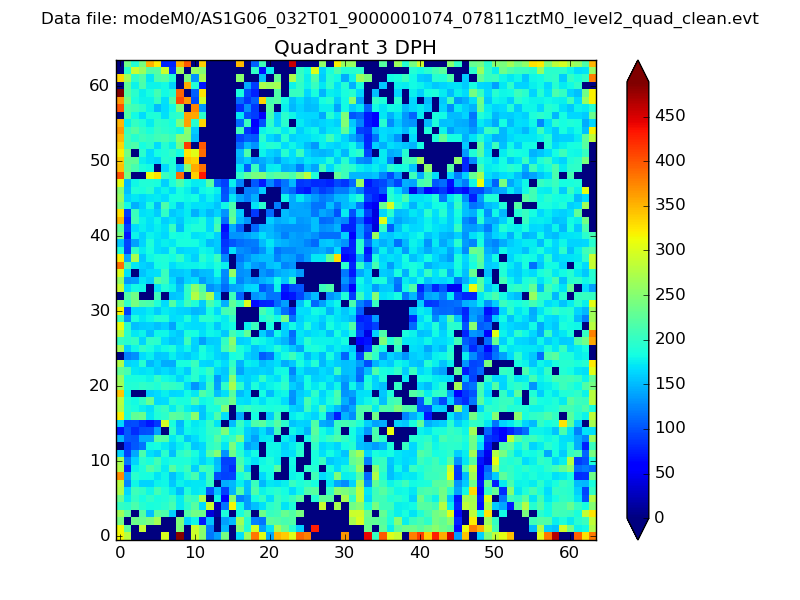 |
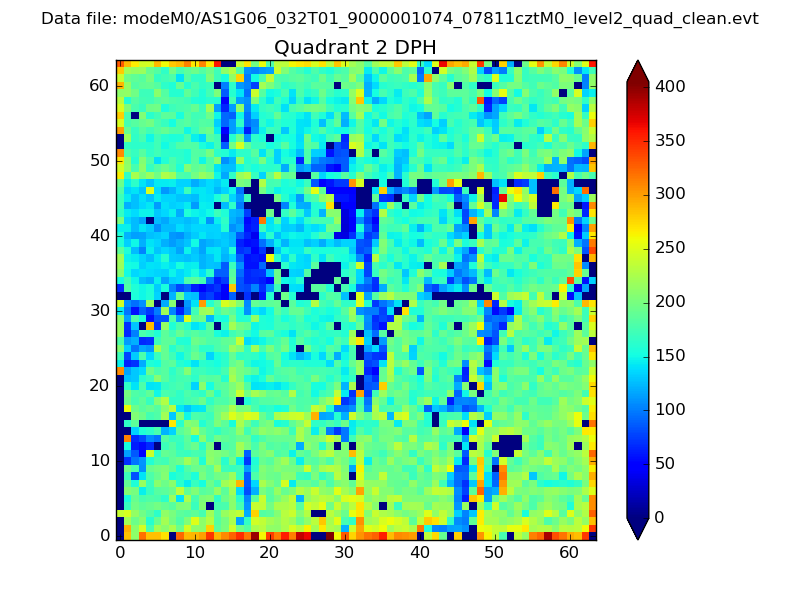 |
Quadrant C |
| Plot type | Count rate plots | Images |
|---|---|---|
| Comparison with Poisson distribution Blue bars denote a histogram of data divided into 1 sec bins. Red curve is a Poisson curve with rate = median count rate of data. |
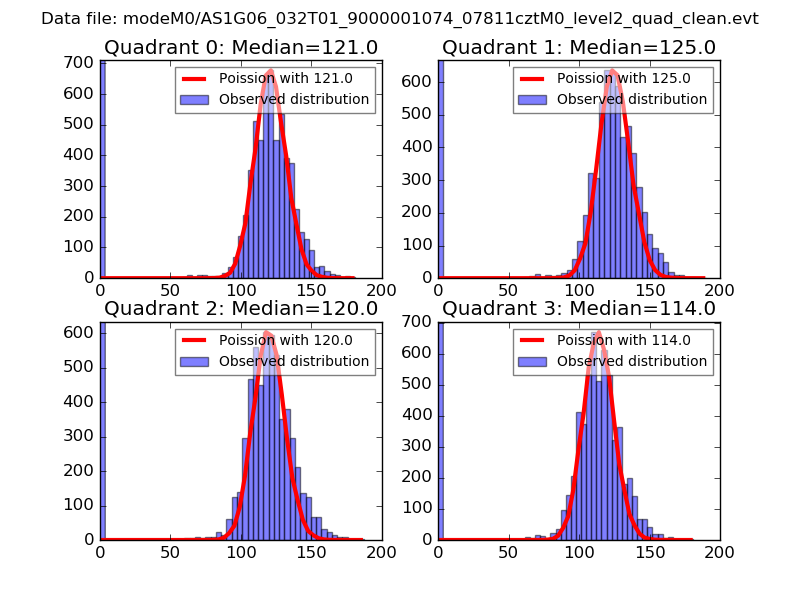 |
 |
| Quadrant-wise count rates Data is divided into 100 sec bins |
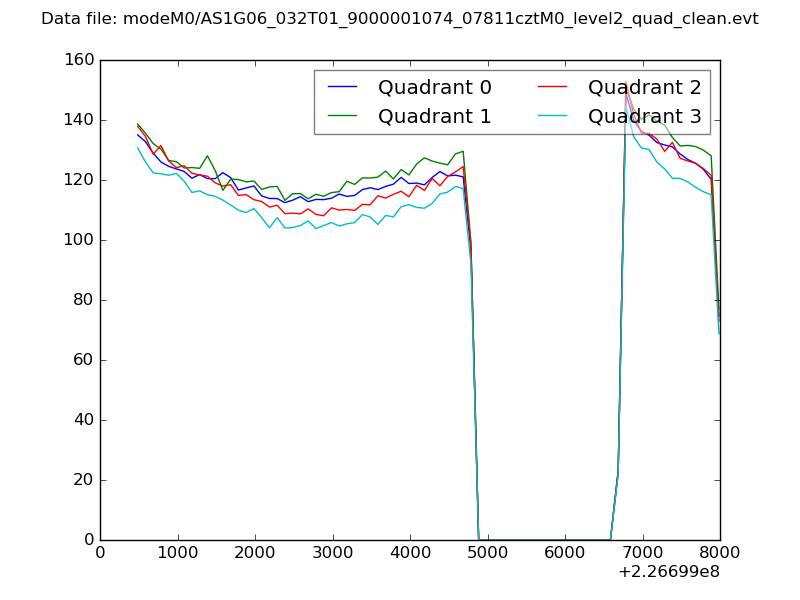 |
|
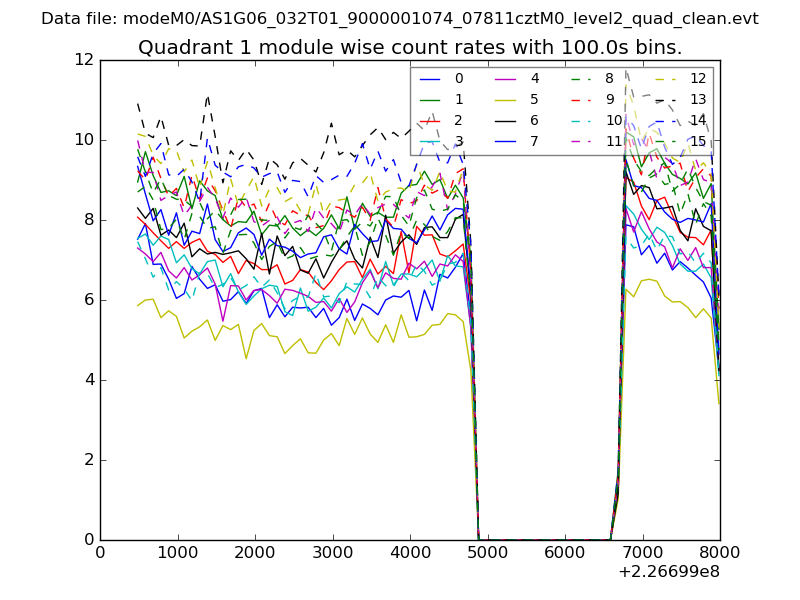
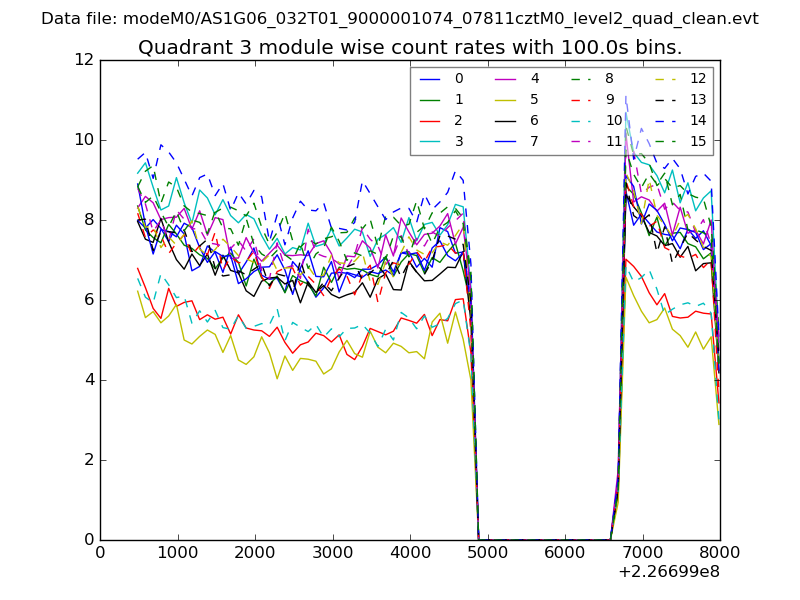
| Module-wise count rates for Quadrant A Data is divided into 100 sec bins |
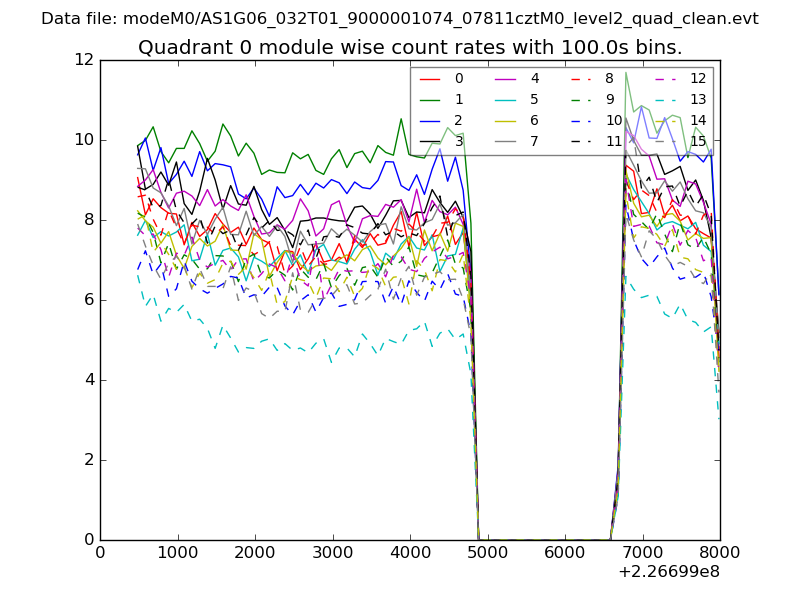 |
 |
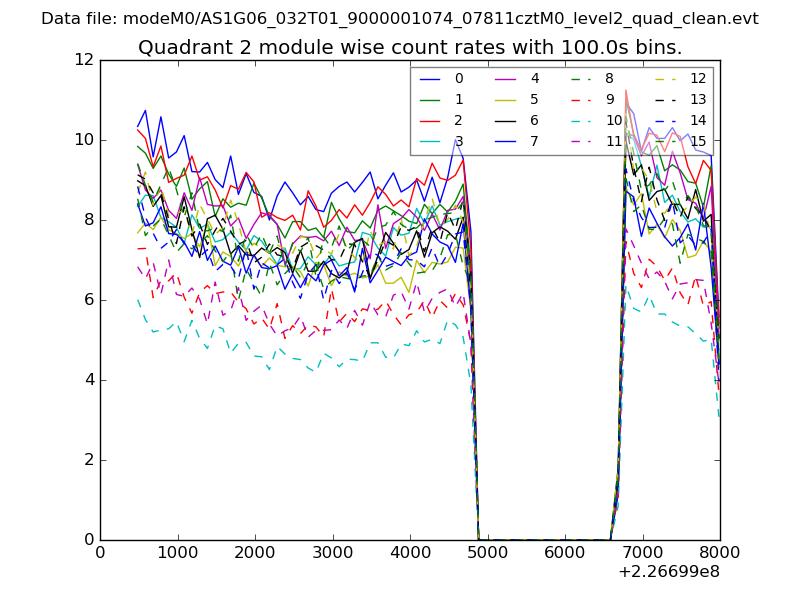
| Module-wise count rates for Quadrant B Data is divided into 100 sec bins |
 |
 |
| Module-wise count rates for Quadrant C Data is divided into 100 sec bins |
 |
 |
| Module-wise count rates for Quadrant D Data is divided into 100 sec bins |
 |
 |
| Parameter | Plot |
|---|---|
| CZT HV Monitor | 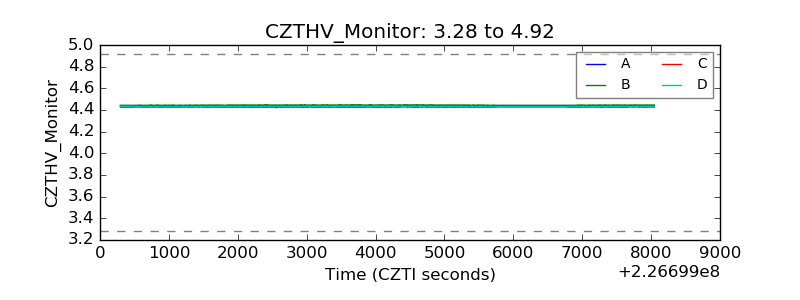 |
| D_VDD | 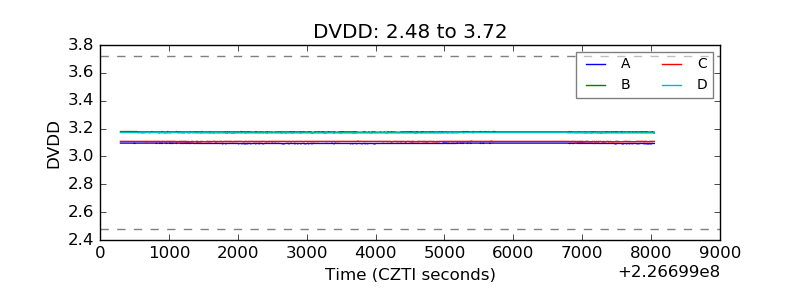 |
| Temperature 1 | 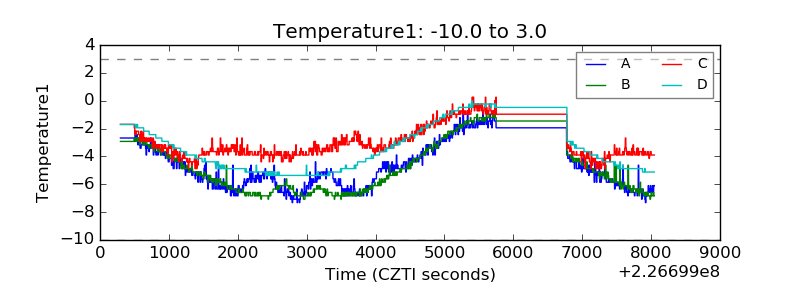 |
| Veto HV Monitor | 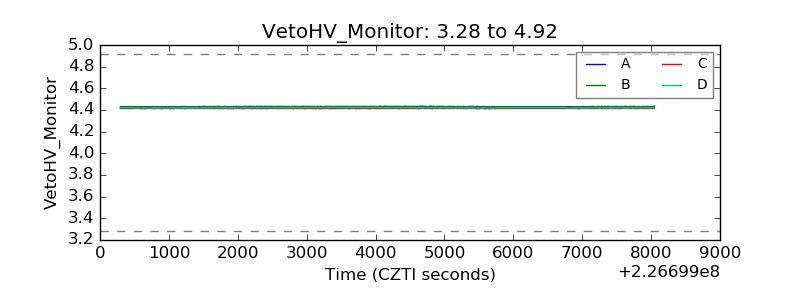 |
| Veto LLD | 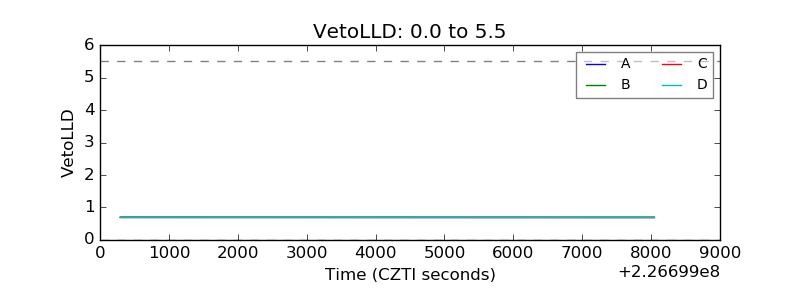 |
| Alpha Counter | 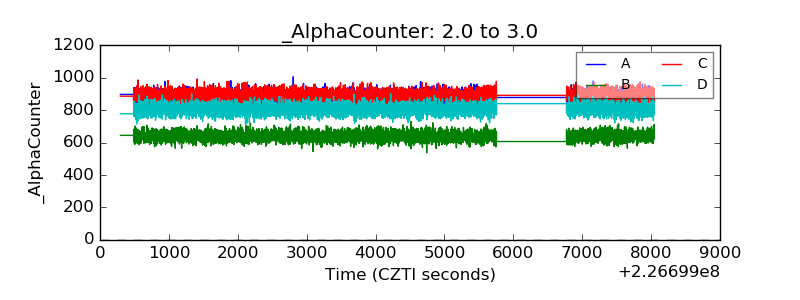 |
| _CPM_Rate | 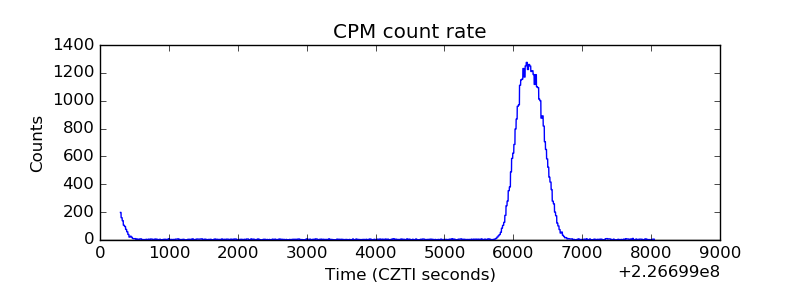 |
| CZT Counter | 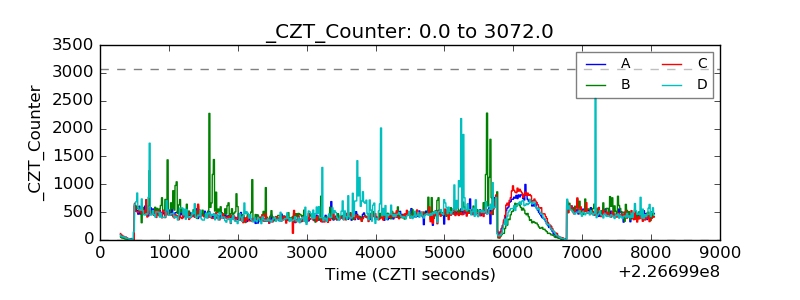 |
| +2.5 Volts monitor | 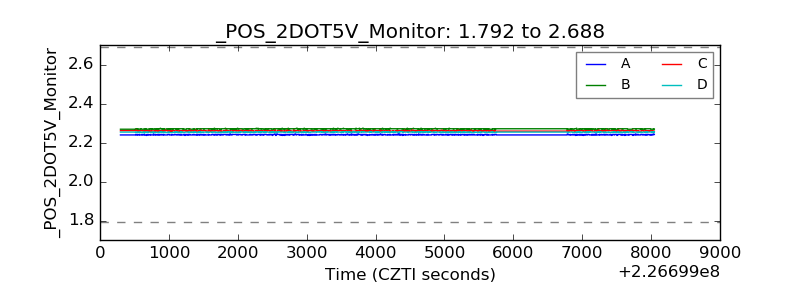 |
| +5 Volts monitor | 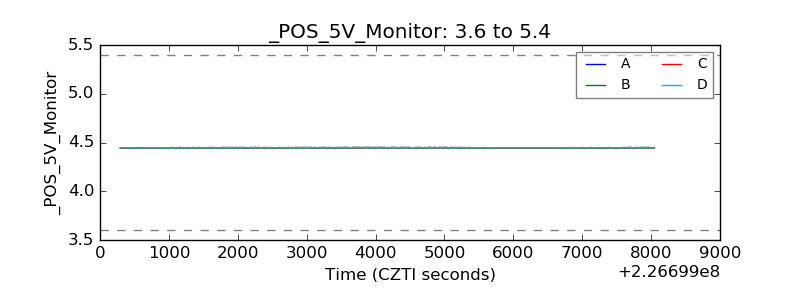 |
| _ROLL_ROT | 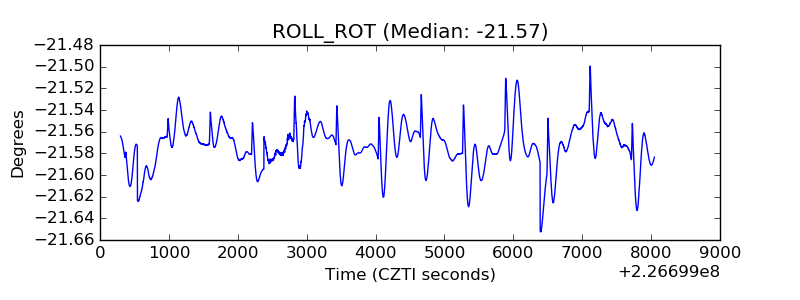 |
| _Roll_DEC | 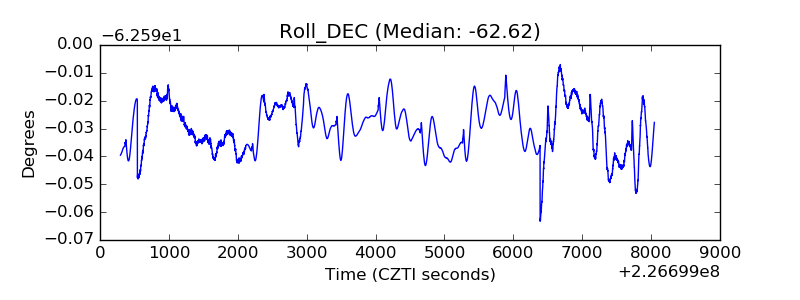 |
| _Roll_RA | 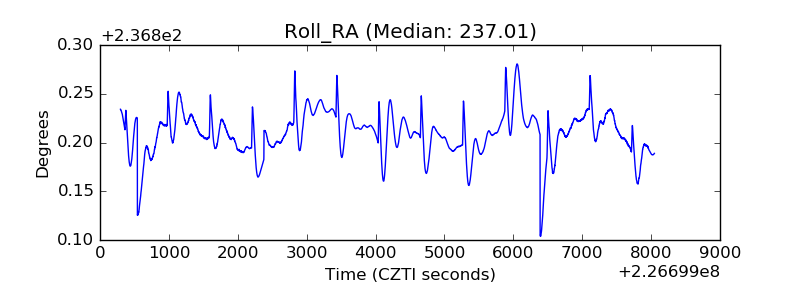 |
| Veto Counter | 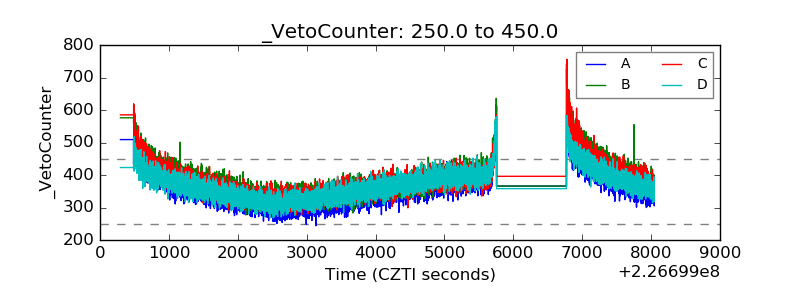 |