| Param | Original file | Final file |
|---|---|---|
| Filename | modeM0/AS1G06_032T01_9000001074_07815cztM0_level2.evt | modeM0/AS1G06_032T01_9000001074_07815cztM0_level2_quad_clean.evt |
| Size (bytes) | 447,693,120 | 106,217,280 |
| Size | 427.0 MB | 101.3 MB |
| Events in quadrant A | 3,010,655 | 691,510 |
| Events in quadrant B | 3,252,997 | 725,823 |
| Events in quadrant C | 3,056,294 | 701,401 |
| Events in quadrant D | 3,799,134 | 647,319 |
| Mode M0 | |||
|---|---|---|---|
| Quadrant | BADHDUFLAG | Total packets | Discarded packets |
| A | 0 | 13202 | 3 |
| B | 0 | 13741 | 2 |
| C | 0 | 13233 | 2 |
| D | 0 | 15776 | 2 |
| Mode M9 | |||
|---|---|---|---|
| Quadrant | BADHDUFLAG | Total packets | Discarded packets |
| A | 0 | 14 | 0 |
| B | 0 | 14 | 0 |
| C | 0 | 14 | 0 |
| D | 0 | 15 | 0 |
| Mode SS | |||
|---|---|---|---|
| Quadrant | BADHDUFLAG | Total packets | Discarded packets |
| A | 0 | 132 | 0 |
| B | 0 | 132 | 0 |
| C | 0 | 132 | 0 |
| D | 0 | 132 | 0 |
| Quadrant | Total seconds | Saturated seconds | Saturation percentage |
|---|---|---|---|
| A | 6460 | 13 | 0.201238% |
| B | 6460 | 50 | 0.773994% |
| C | 6460 | 9 | 0.139319% |
| D | 6460 | 230 | 3.560372% |
Noise dominated data is calculated using 1-second bins in cleaned event files. If a bin has >2000 counts, and if more than 50% of those come from <1% of pixels, then it is considered to be noise-dominated and hence unusable.
| Quadrant | # 1 sec bins | Bins with >0 counts | Bins with >2000 counts | High rate bins dominated by noise | Noise dominated (total time) | Noise dominated (detector-on time) | Marked lightcurve |
|---|---|---|---|---|---|---|---|
| A | 7755 | 6461 | 0 | 0 | 0.00% | 0.00% | 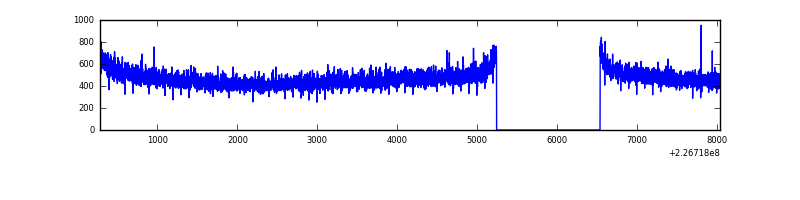 |
| B | 7755 | 6461 | 17 | 17 | 0.22% | 0.26% | 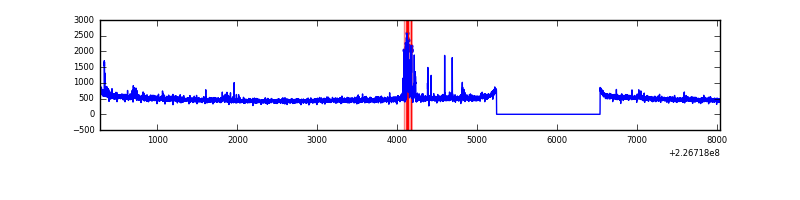 |
| C | 7755 | 6461 | 0 | 0 | 0.00% | 0.00% | 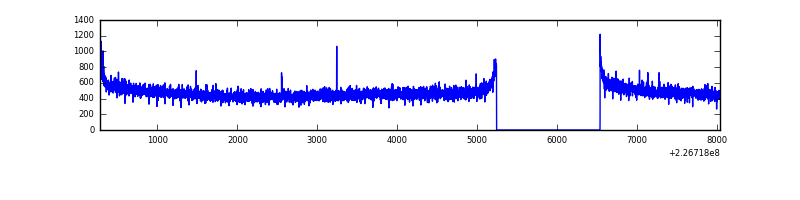 |
| D | 7755 | 6460 | 164 | 164 | 2.11% | 2.54% | 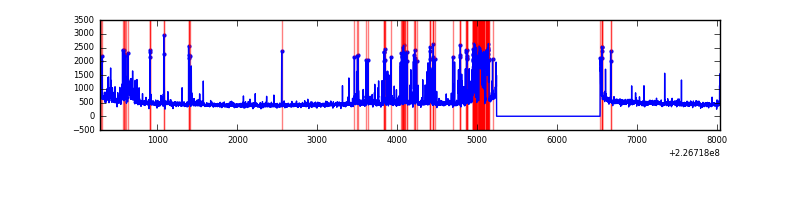 |
Top three noisy pixels from each quadrant. If the there are fewer than three noisy pixels in the level2.evt file, extra rows are filled as -1
| Pixel properties | Quadrant properties | ||||||
|---|---|---|---|---|---|---|---|
| Quadrant | DetID | PixID | Counts | Sigma | Mean | Median | Sigma |
| A | 13 | 14 | 24684 | 153.4 | 774 | 757 | 156.0 |
| A | 3 | 1 | 8600 | 50.28 | 774 | 757 | 156.0 |
| A | 0 | 226 | 7208 | 41.36 | 774 | 757 | 156.0 |
| B | 4 | 239 | 100905 | 682.43 | 793 | 774 | 146.7 |
| B | 0 | 214 | 30440 | 202.18 | 793 | 774 | 146.7 |
| B | 0 | 219 | 14741 | 95.19 | 793 | 774 | 146.7 |
| C | 1 | 16 | 12449 | 65.27 | 778 | 782 | 178.7 |
| C | 12 | 4 | 7474 | 37.44 | 778 | 782 | 178.7 |
| C | 13 | 61 | 6034 | 29.38 | 778 | 782 | 178.7 |
| D | 7 | 71 | 552069 | 3040.46 | 754 | 732 | 181.3 |
| D | 2 | 152 | 145195 | 796.67 | 754 | 732 | 181.3 |
| D | 12 | 233 | 129548 | 710.38 | 754 | 732 | 181.3 |
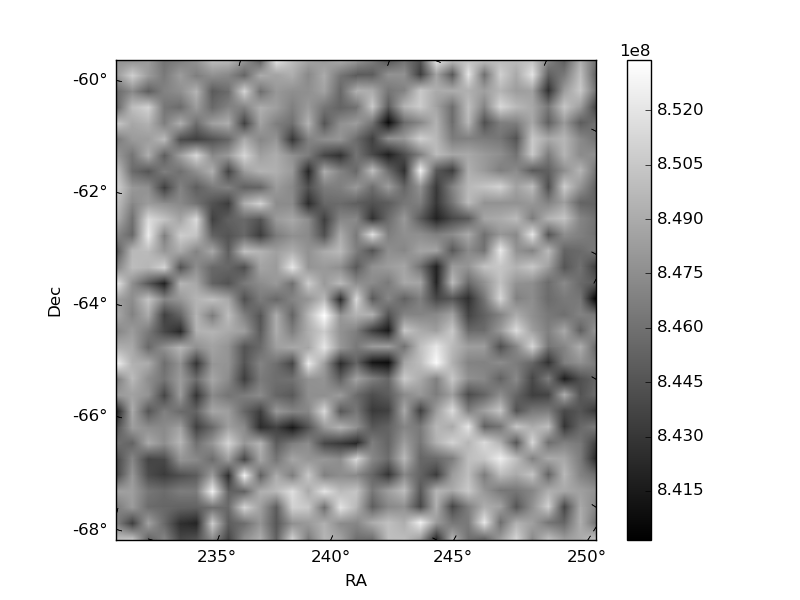
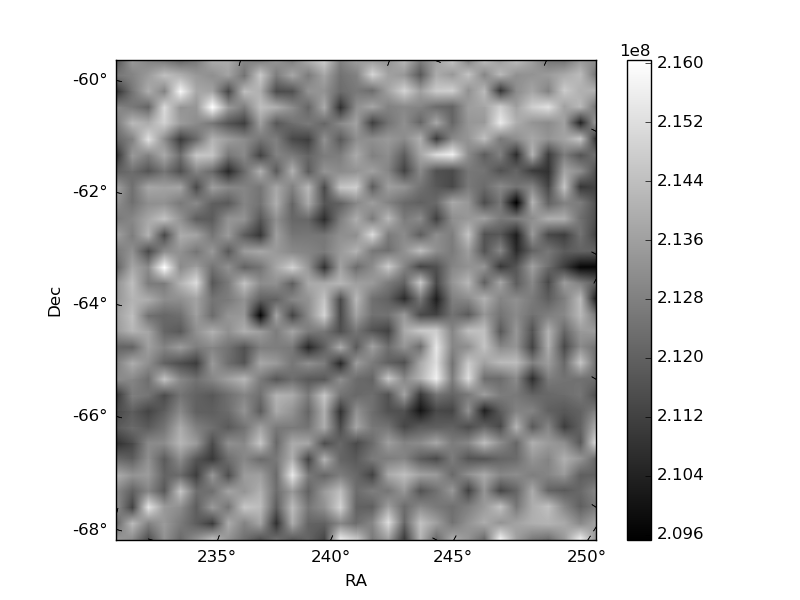
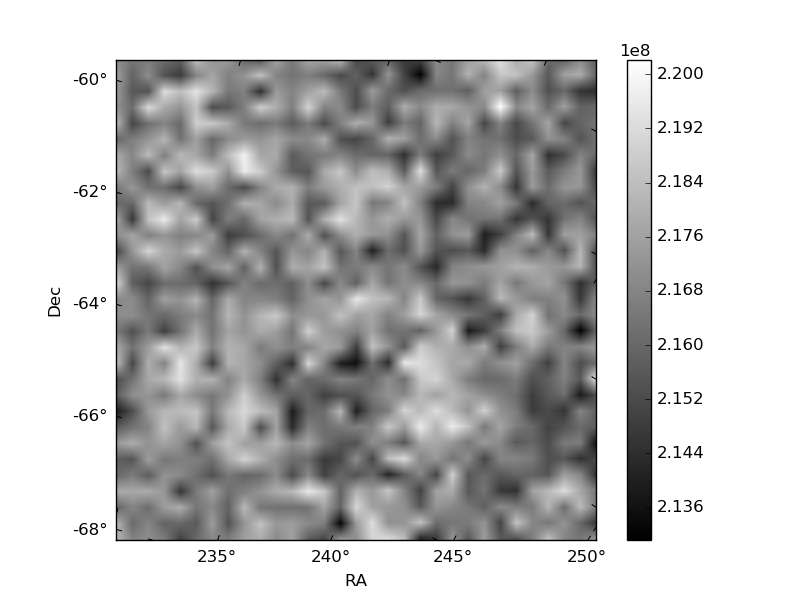
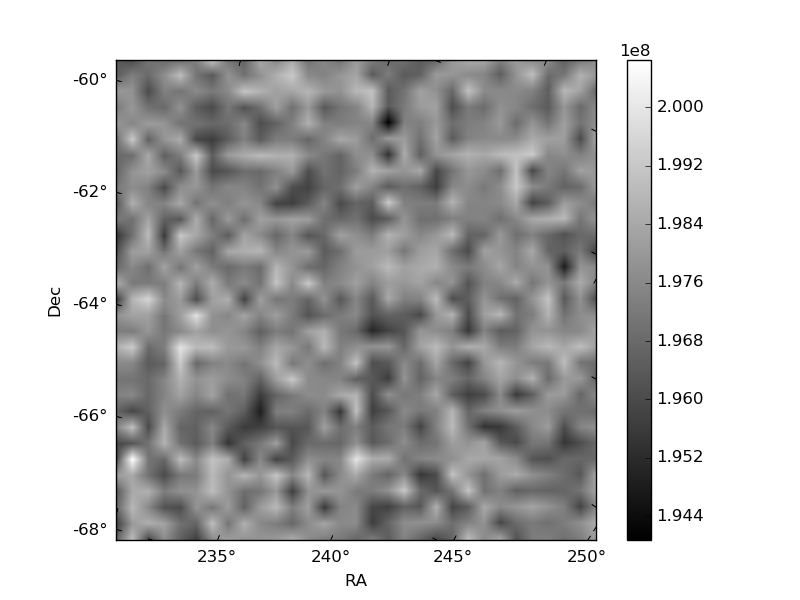
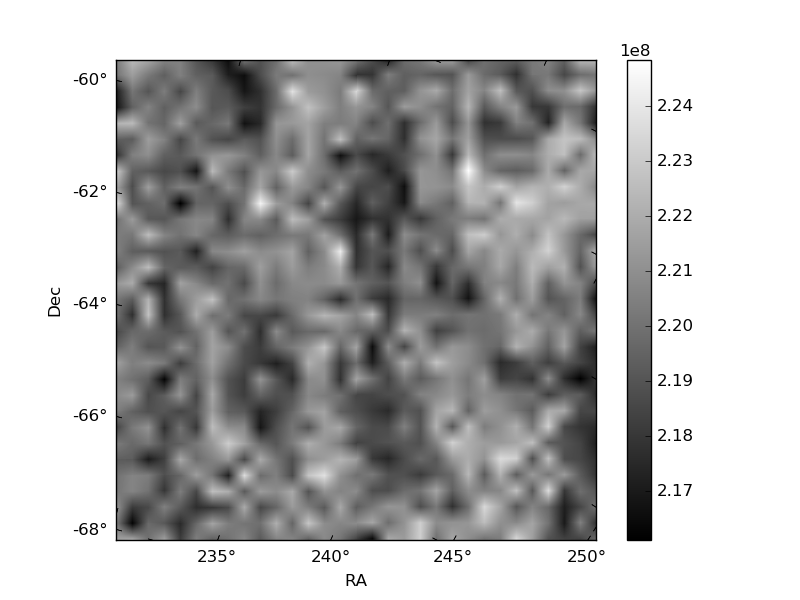
Histogram calculated using DETX and DETY for each event in the final _common_clean file
| Quadrant A | 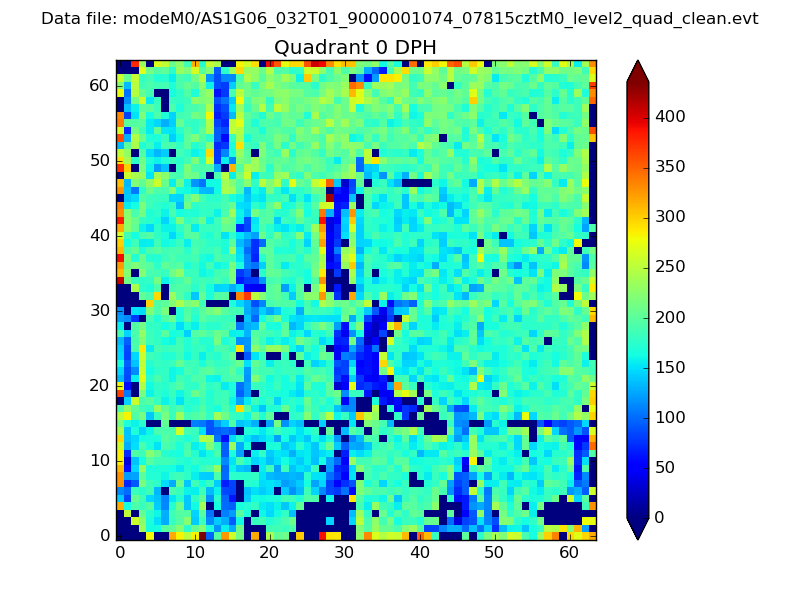 |
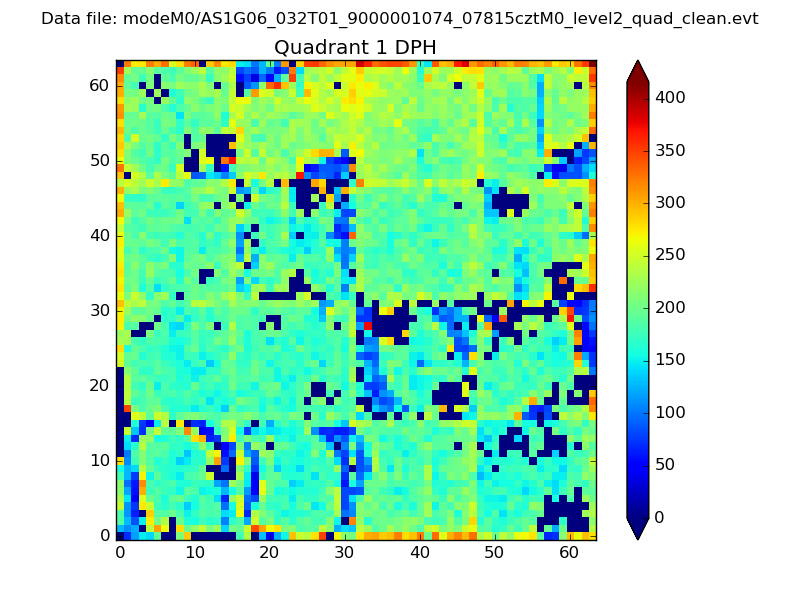 |
Quadrant B |
|---|---|---|---|
| Quadrant D | 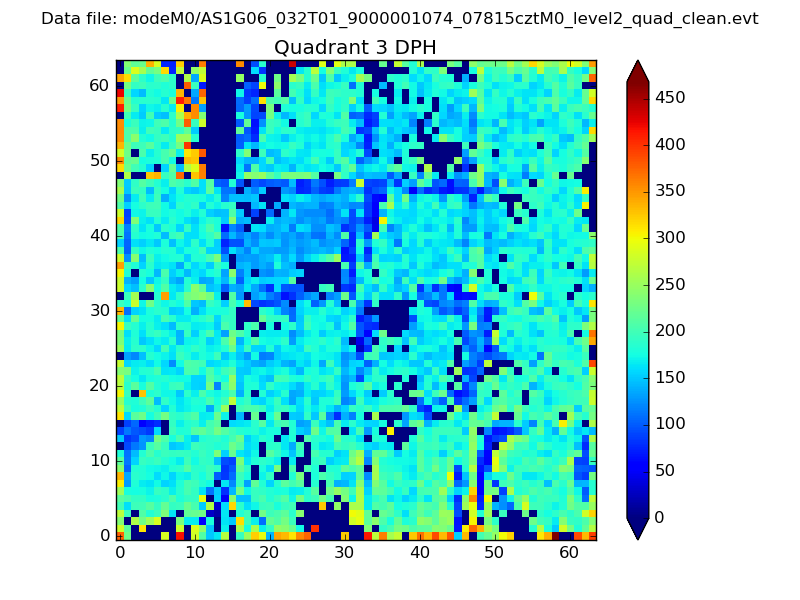 |
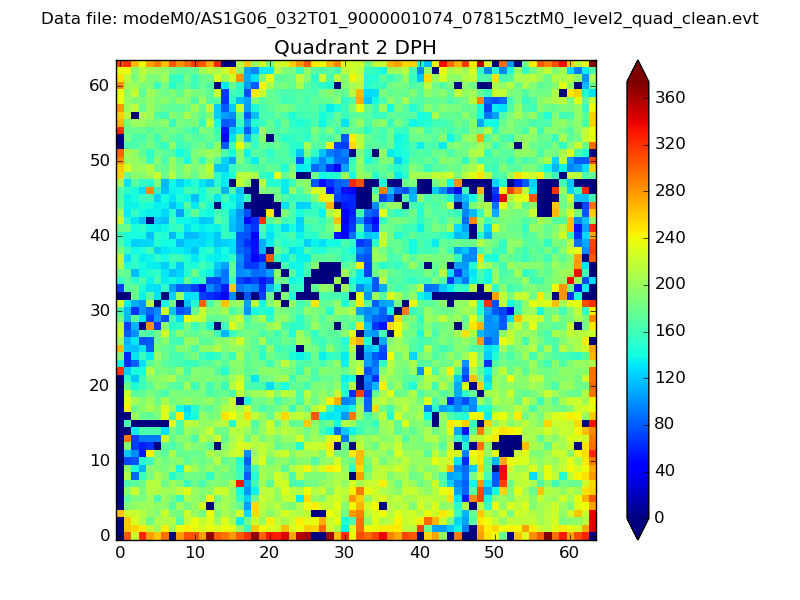 |
Quadrant C |
| Plot type | Count rate plots | Images |
|---|---|---|
| Comparison with Poisson distribution Blue bars denote a histogram of data divided into 1 sec bins. Red curve is a Poisson curve with rate = median count rate of data. |
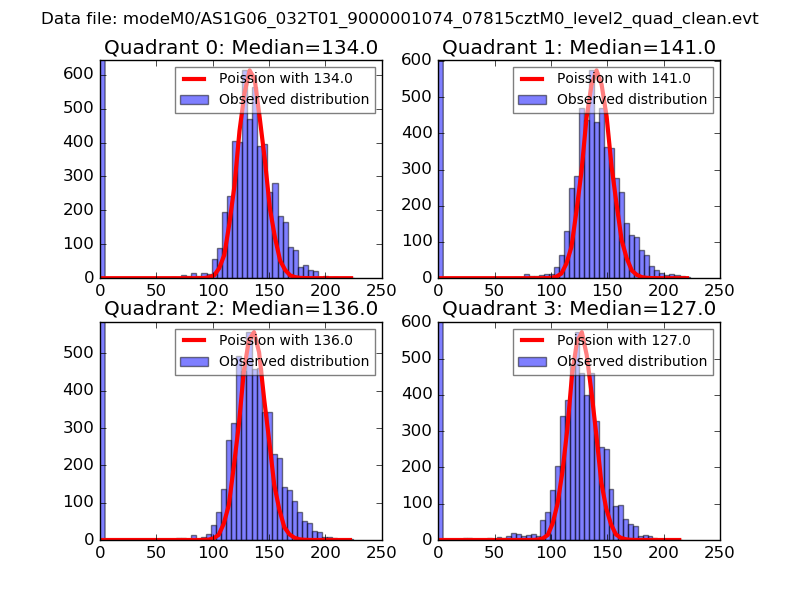 |
 |
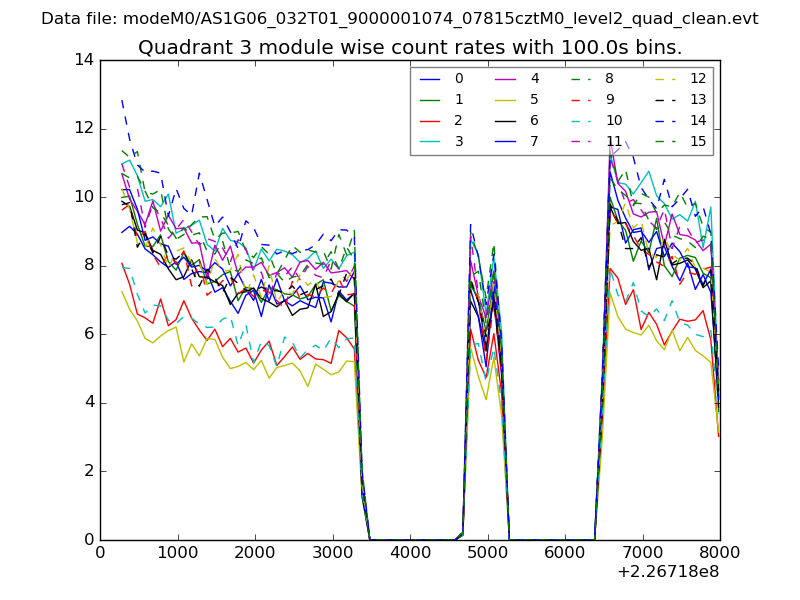
| Quadrant-wise count rates Data is divided into 100 sec bins |
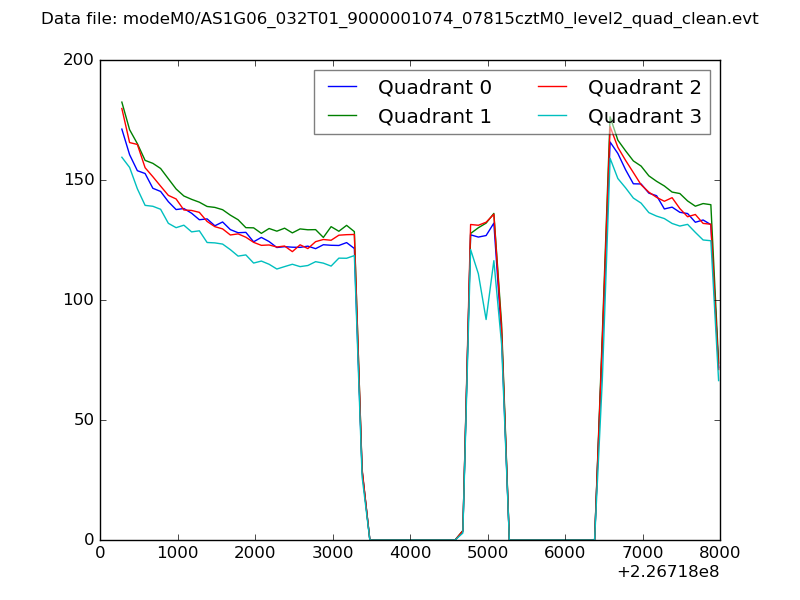 |
|
| Module-wise count rates for Quadrant A Data is divided into 100 sec bins |
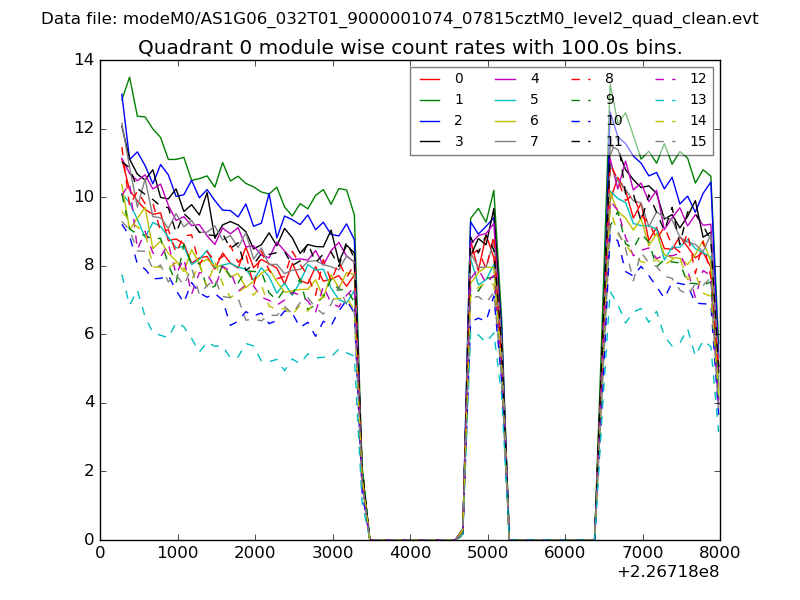 |
 |
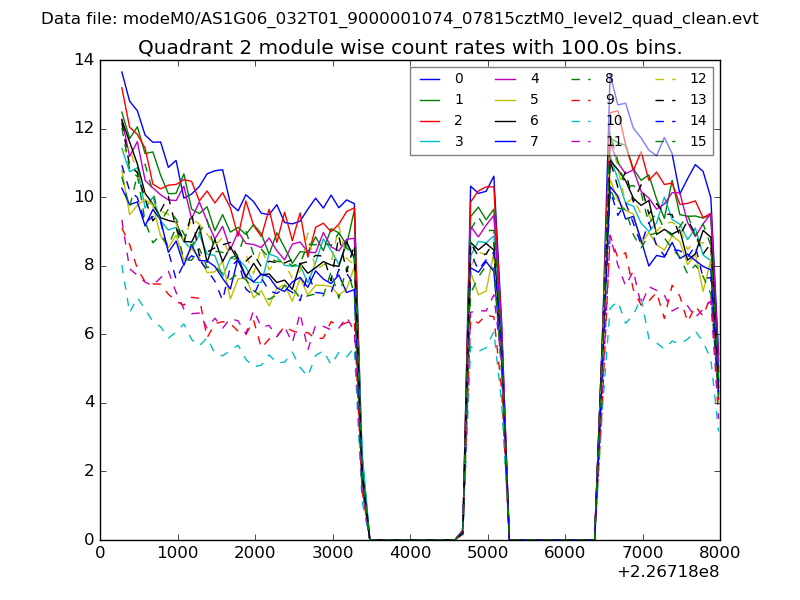
| Module-wise count rates for Quadrant B Data is divided into 100 sec bins |
 |
 |
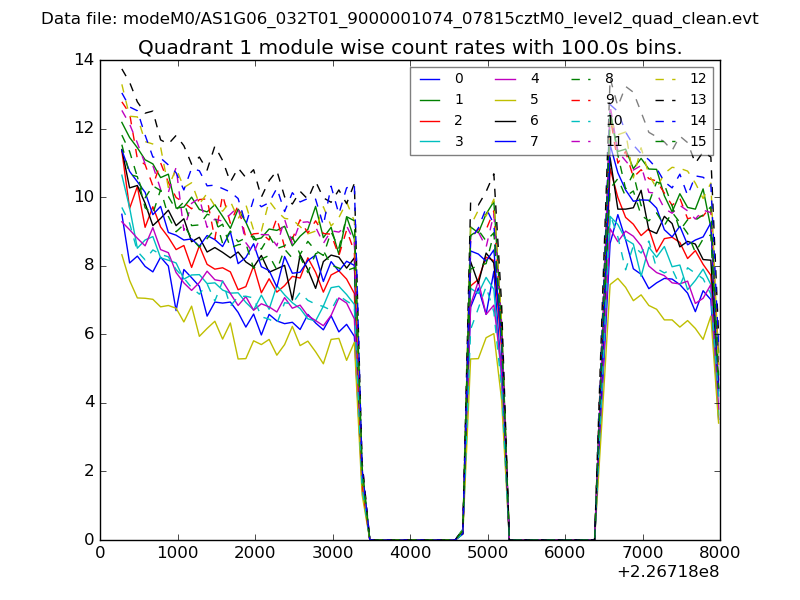
| Module-wise count rates for Quadrant C Data is divided into 100 sec bins |
 |
 |
| Module-wise count rates for Quadrant D Data is divided into 100 sec bins |
 |
 |
| Parameter | Plot |
|---|---|
| CZT HV Monitor | 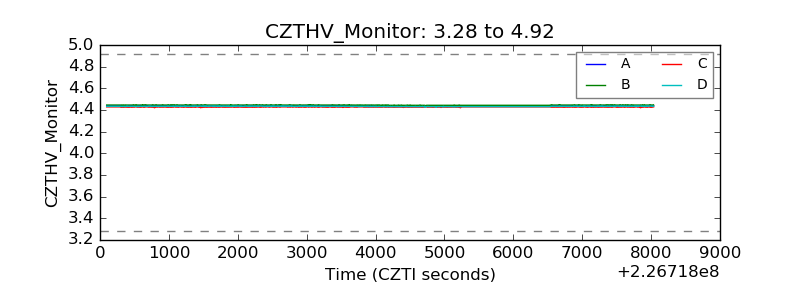 |
| D_VDD | 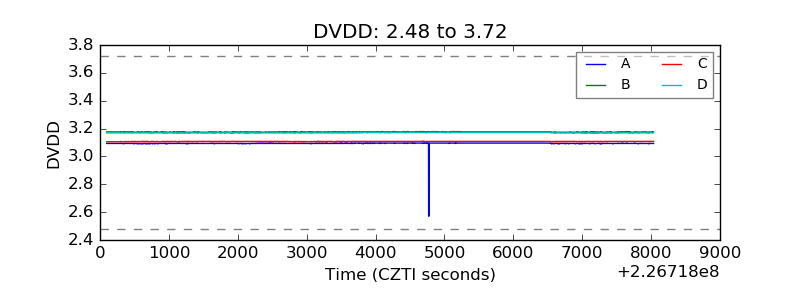 |
| Temperature 1 | 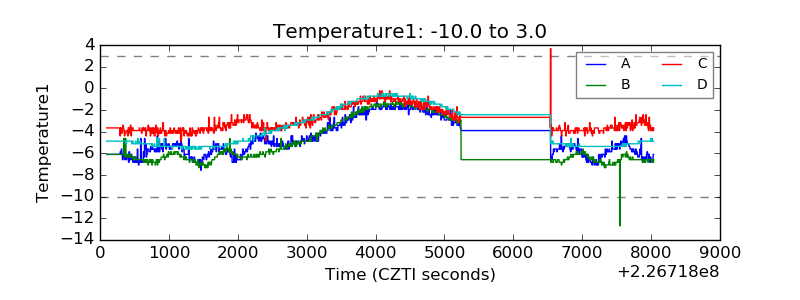 |
| Veto HV Monitor | 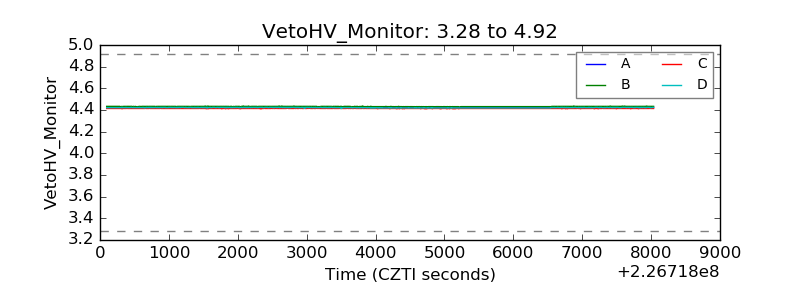 |
| Veto LLD | 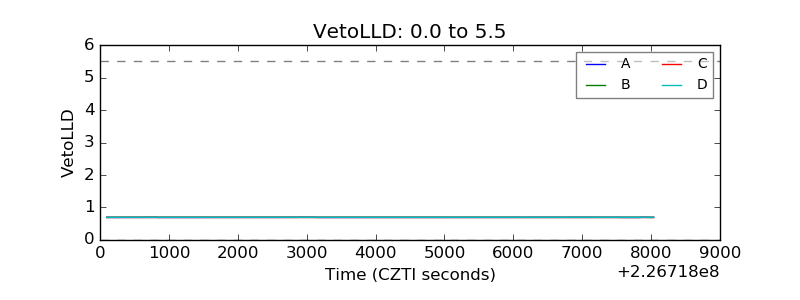 |
| Alpha Counter | 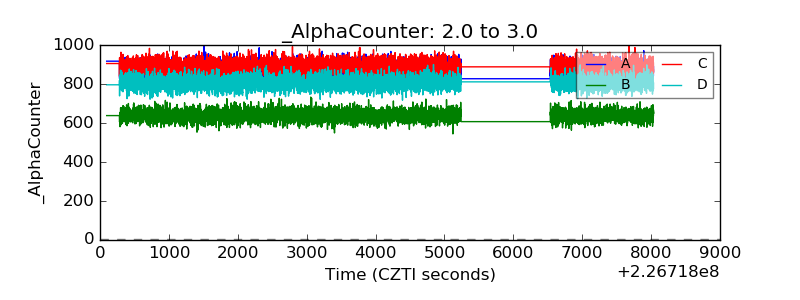 |
| _CPM_Rate | 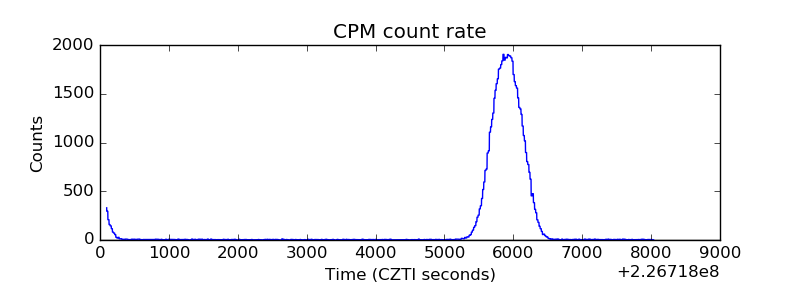 |
| CZT Counter | 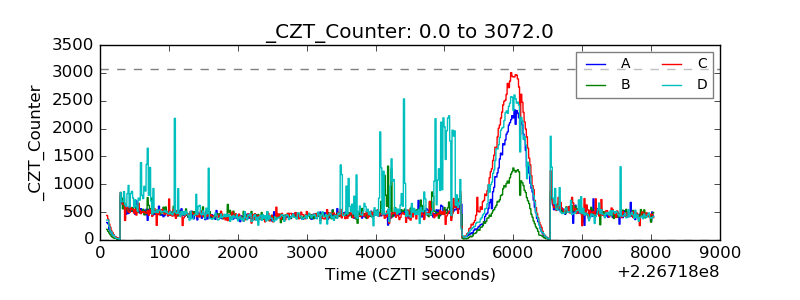 |
| +2.5 Volts monitor |  |
| +5 Volts monitor |  |
| _ROLL_ROT | 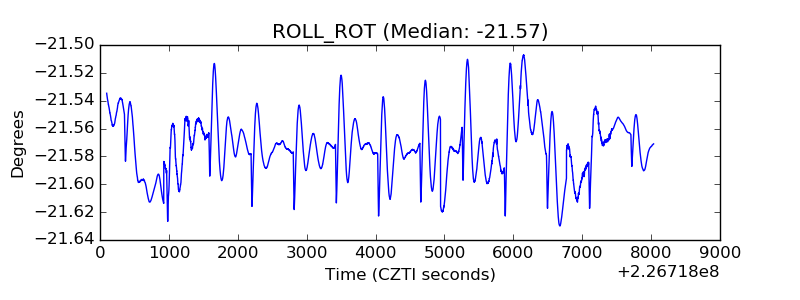 |
| _Roll_DEC | 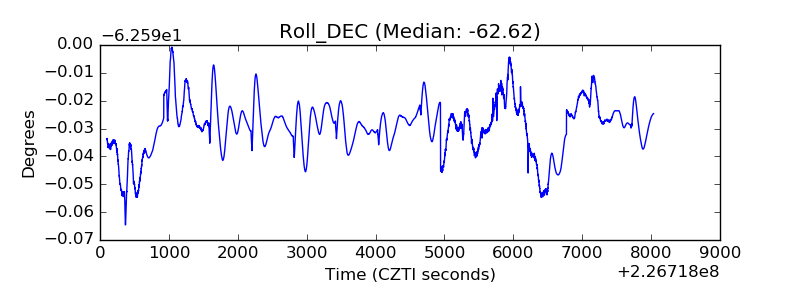 |
| _Roll_RA | 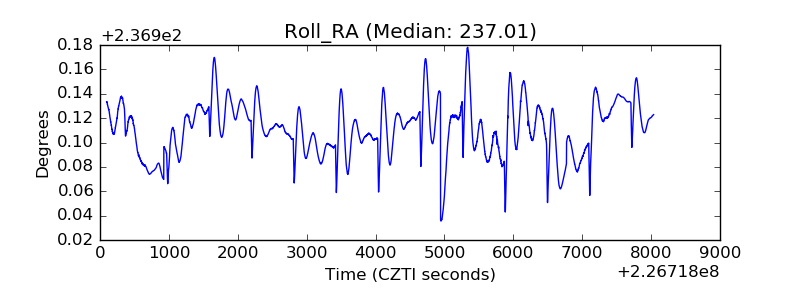 |
| Veto Counter | 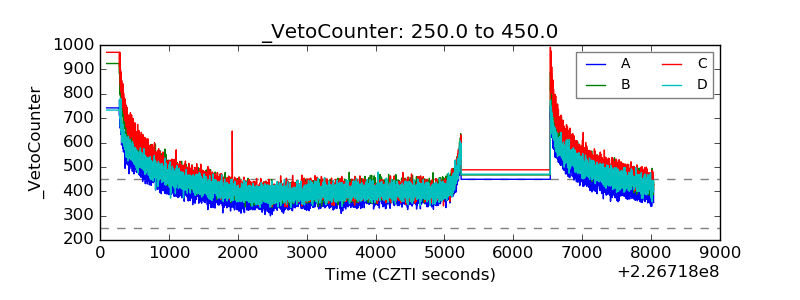 |