| Param | Original file | Final file |
|---|---|---|
| Filename | modeM0/AS1G06_032T01_9000001074_07816cztM0_level2.evt | modeM0/AS1G06_032T01_9000001074_07816cztM0_level2_quad_clean.evt |
| Size (bytes) | 284,506,560 | 63,308,160 |
| Size | 271.3 MB | 60.4 MB |
| Events in quadrant A | 1,991,422 | 400,377 |
| Events in quadrant B | 2,101,168 | 421,880 |
| Events in quadrant C | 2,010,329 | 407,708 |
| Events in quadrant D | 2,216,651 | 381,264 |
| Mode M0 | |||
|---|---|---|---|
| Quadrant | BADHDUFLAG | Total packets | Discarded packets |
| A | 0 | 8790 | 1 |
| B | 0 | 8988 | 1 |
| C | 0 | 8823 | 1 |
| D | 0 | 9507 | 1 |
| Mode M9 | |||
|---|---|---|---|
| Quadrant | BADHDUFLAG | Total packets | Discarded packets |
| A | 0 | 7 | 0 |
| B | 0 | 7 | 0 |
| C | 0 | 7 | 0 |
| D | 0 | 8 | 0 |
| Mode SS | |||
|---|---|---|---|
| Quadrant | BADHDUFLAG | Total packets | Discarded packets |
| A | 0 | 86 | 0 |
| B | 0 | 86 | 0 |
| C | 0 | 86 | 0 |
| D | 0 | 86 | 0 |
| Quadrant | Total seconds | Saturated seconds | Saturation percentage |
|---|---|---|---|
| A | 4347 | 5 | 0.115022% |
| B | 4347 | 11 | 0.253048% |
| C | 4347 | 5 | 0.115022% |
| D | 4347 | 37 | 0.851162% |
Noise dominated data is calculated using 1-second bins in cleaned event files. If a bin has >2000 counts, and if more than 50% of those come from <1% of pixels, then it is considered to be noise-dominated and hence unusable.
| Quadrant | # 1 sec bins | Bins with >0 counts | Bins with >2000 counts | High rate bins dominated by noise | Noise dominated (total time) | Noise dominated (detector-on time) | Marked lightcurve |
|---|---|---|---|---|---|---|---|
| A | 4347 | 4347 | 0 | 0 | 0.00% | 0.00% | 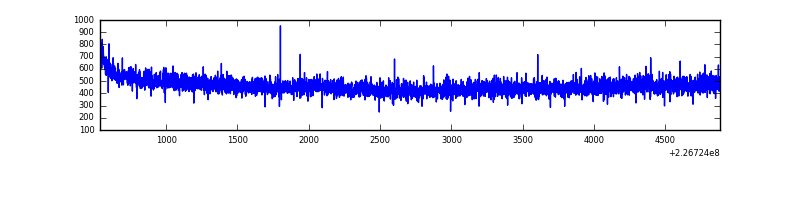 |
| B | 4347 | 4347 | 4 | 4 | 0.09% | 0.09% | 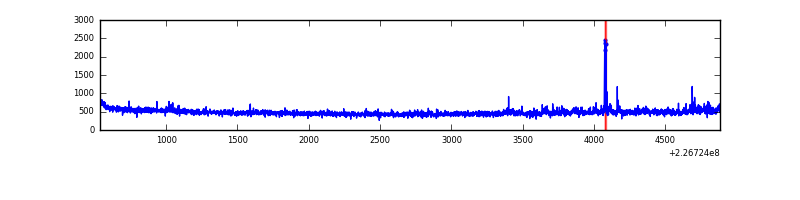 |
| C | 4347 | 4347 | 0 | 0 | 0.00% | 0.00% | 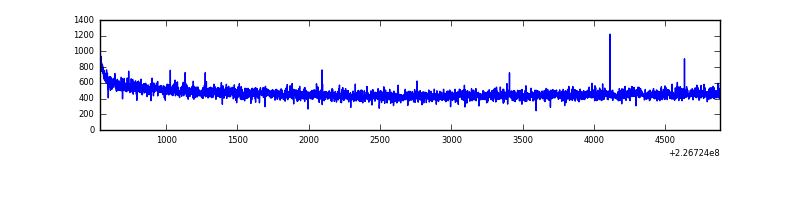 |
| D | 4346 | 4346 | 28 | 28 | 0.64% | 0.64% | 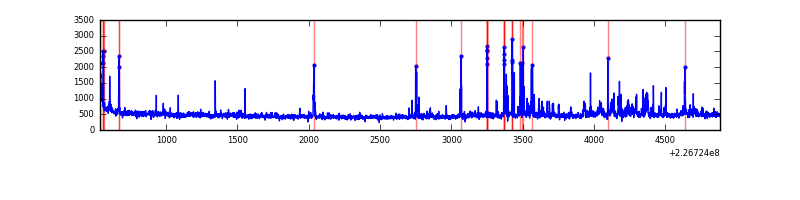 |
Top three noisy pixels from each quadrant. If the there are fewer than three noisy pixels in the level2.evt file, extra rows are filled as -1
| Pixel properties | Quadrant properties | ||||||
|---|---|---|---|---|---|---|---|
| Quadrant | DetID | PixID | Counts | Sigma | Mean | Median | Sigma |
| A | 13 | 14 | 24412 | 232.64 | 510 | 499 | 102.8 |
| A | 3 | 1 | 5886 | 52.41 | 510 | 499 | 102.8 |
| A | 0 | 226 | 4728 | 41.14 | 510 | 499 | 102.8 |
| B | 0 | 214 | 30986 | 312.0 | 520 | 508 | 97.7 |
| B | 4 | 239 | 19280 | 192.16 | 520 | 508 | 97.7 |
| B | 15 | 204 | 14204 | 140.2 | 520 | 508 | 97.7 |
| C | 1 | 16 | 9054 | 72.19 | 512 | 517 | 118.3 |
| C | 13 | 61 | 3971 | 29.21 | 512 | 517 | 118.3 |
| C | 12 | 4 | 3026 | 21.22 | 512 | 517 | 118.3 |
| D | 2 | 152 | 117515 | 964.66 | 502 | 487 | 121.3 |
| D | 7 | 71 | 89958 | 737.51 | 502 | 487 | 121.3 |
| D | 12 | 233 | 43628 | 355.61 | 502 | 487 | 121.3 |
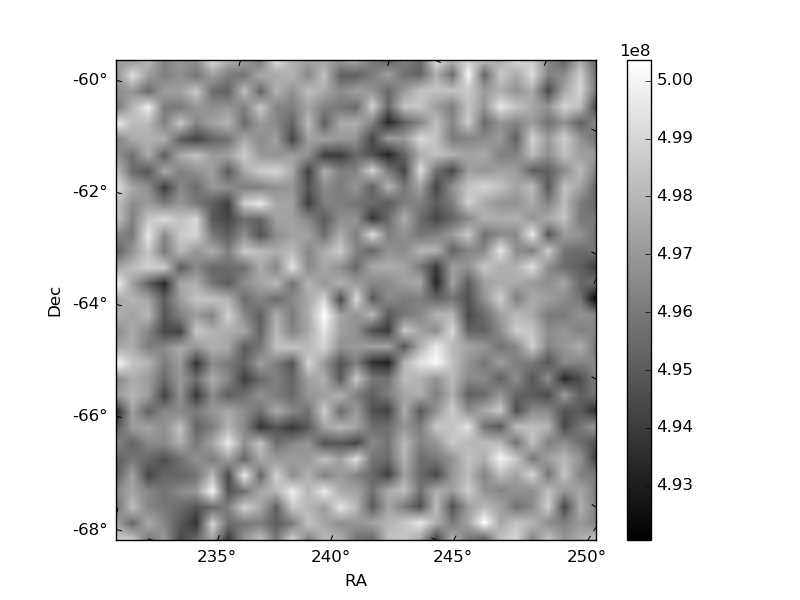
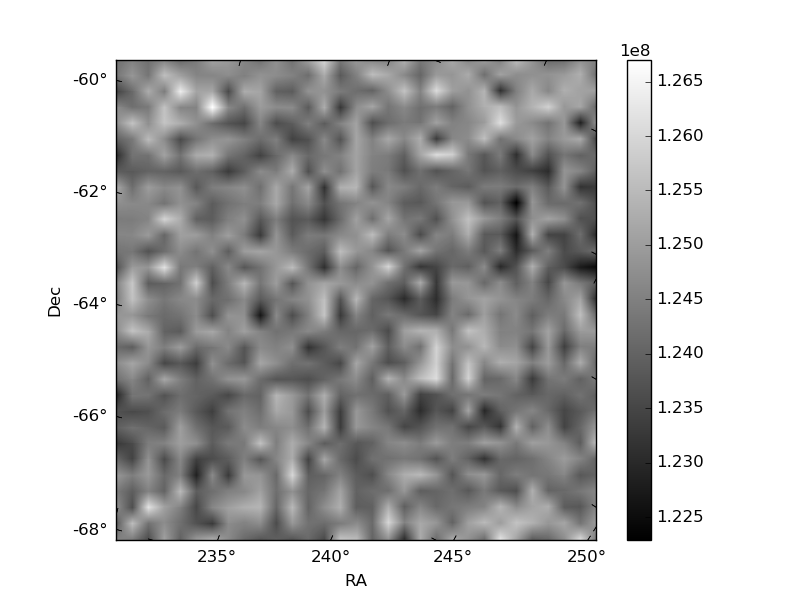
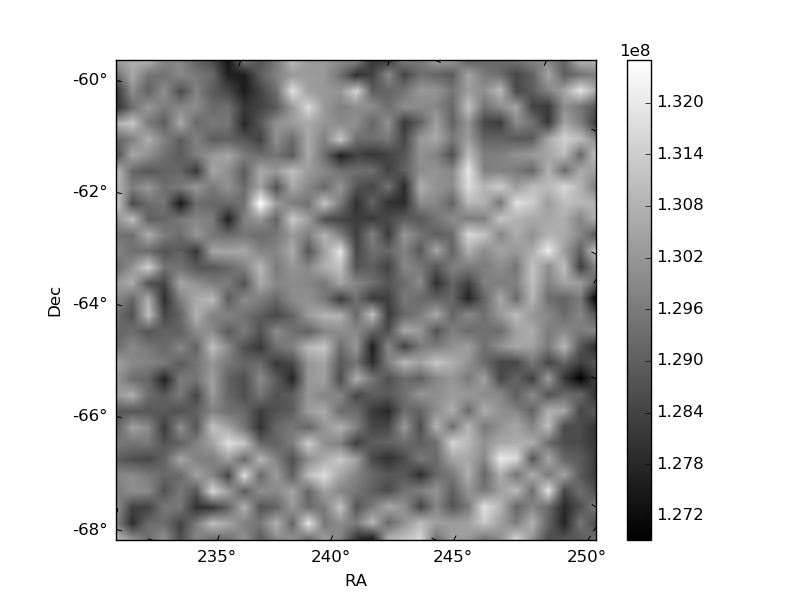
Histogram calculated using DETX and DETY for each event in the final _common_clean file
| Quadrant A | 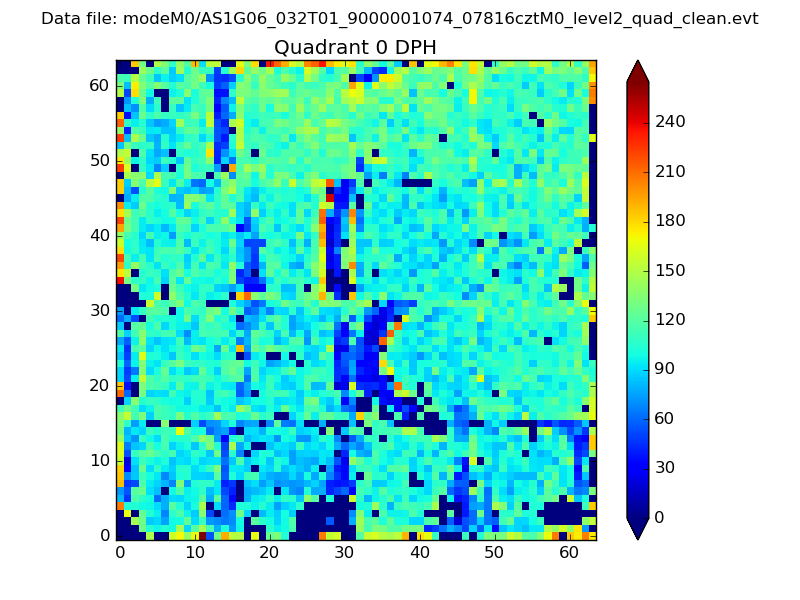 |
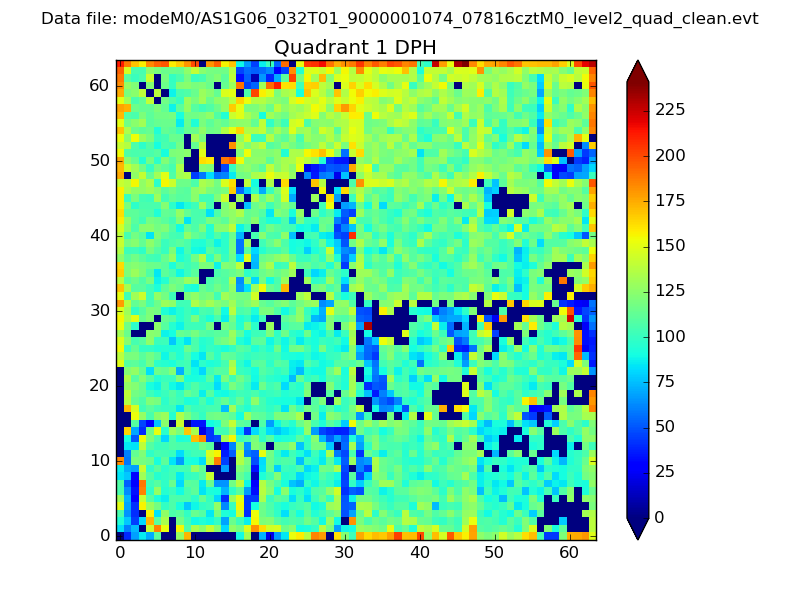 |
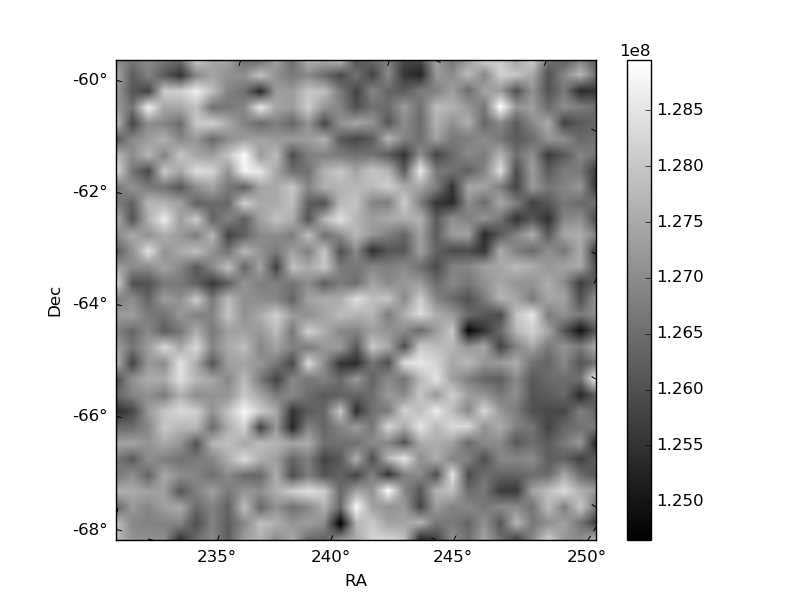
Quadrant B |
|---|---|---|---|
| Quadrant D | 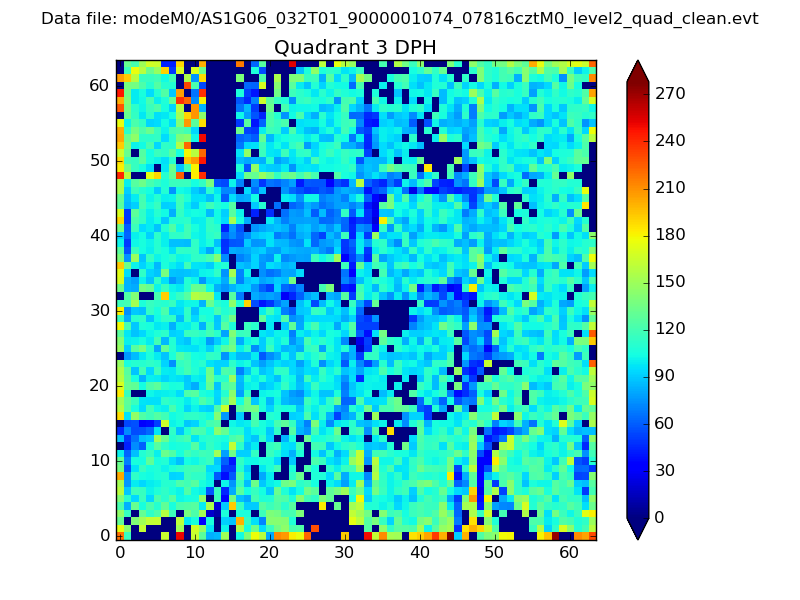 |
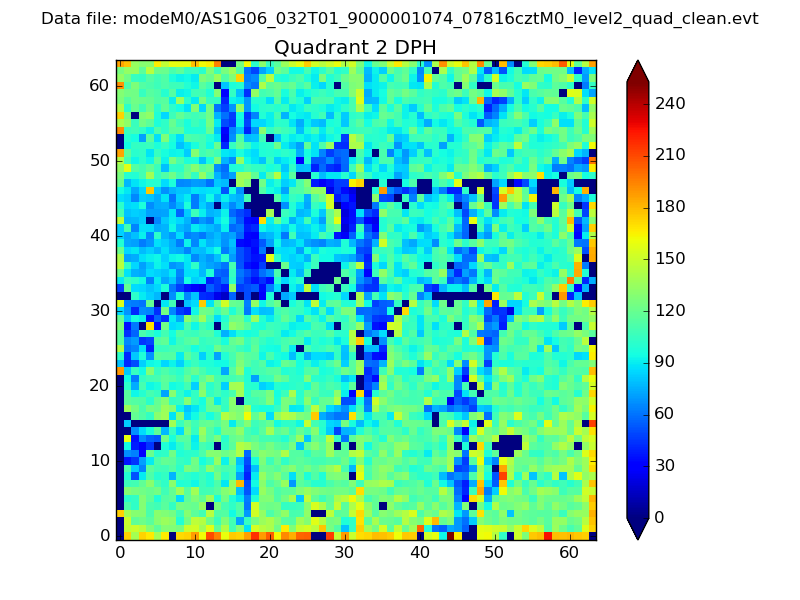 |
Quadrant C |
| Plot type | Count rate plots | Images |
|---|---|---|
| Comparison with Poisson distribution Blue bars denote a histogram of data divided into 1 sec bins. Red curve is a Poisson curve with rate = median count rate of data. |
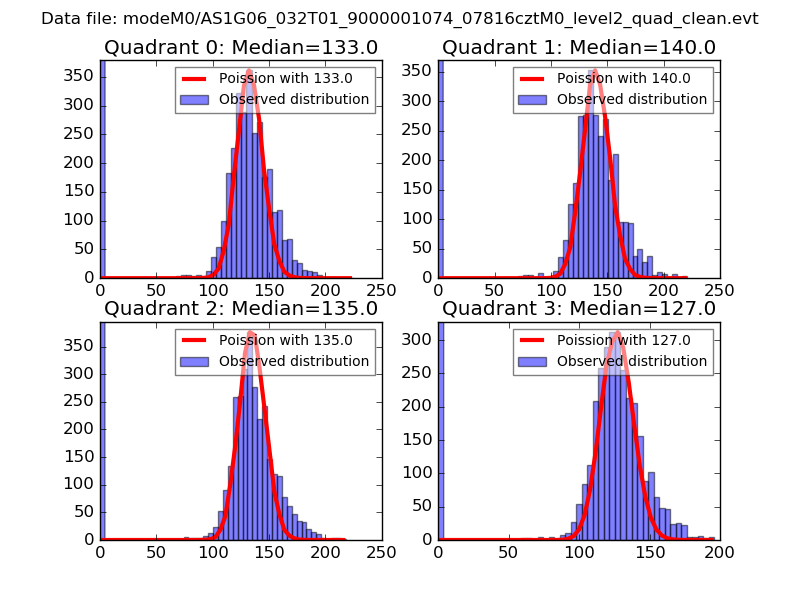 |
 |
| Quadrant-wise count rates Data is divided into 100 sec bins |
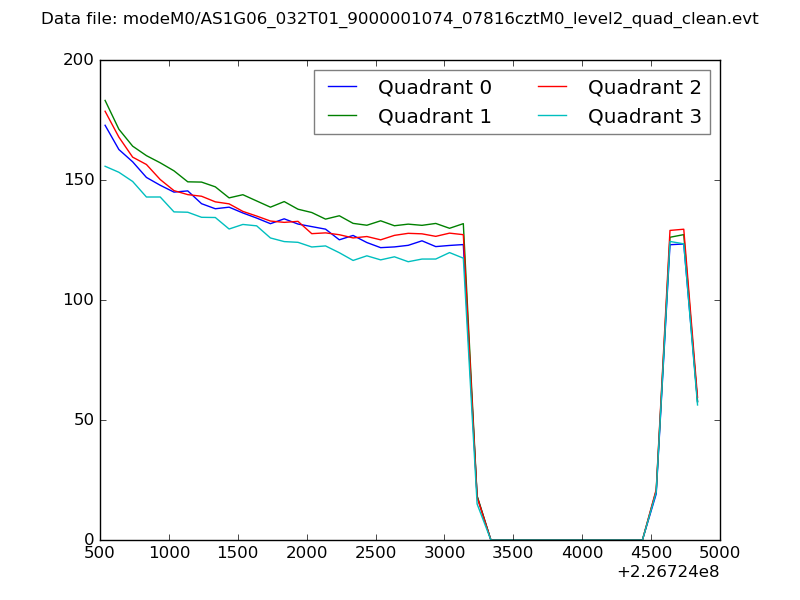 |
|
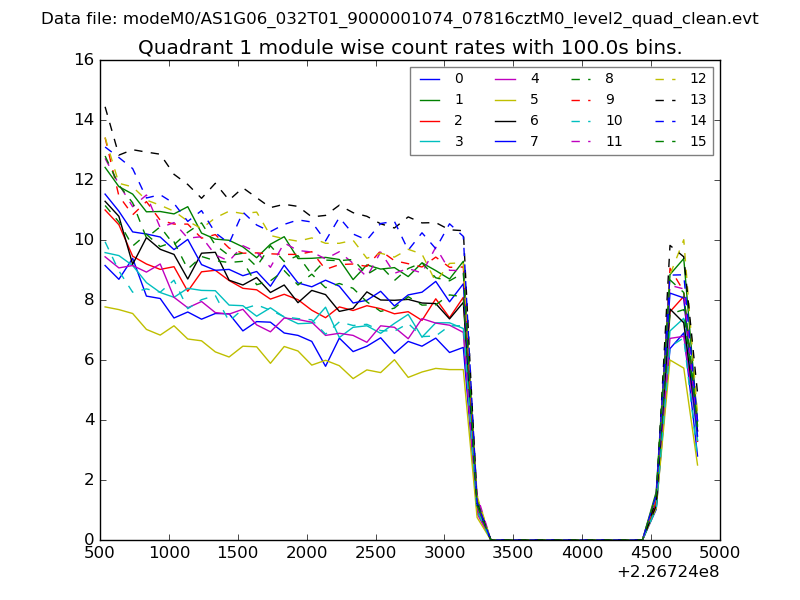
| Module-wise count rates for Quadrant A Data is divided into 100 sec bins |
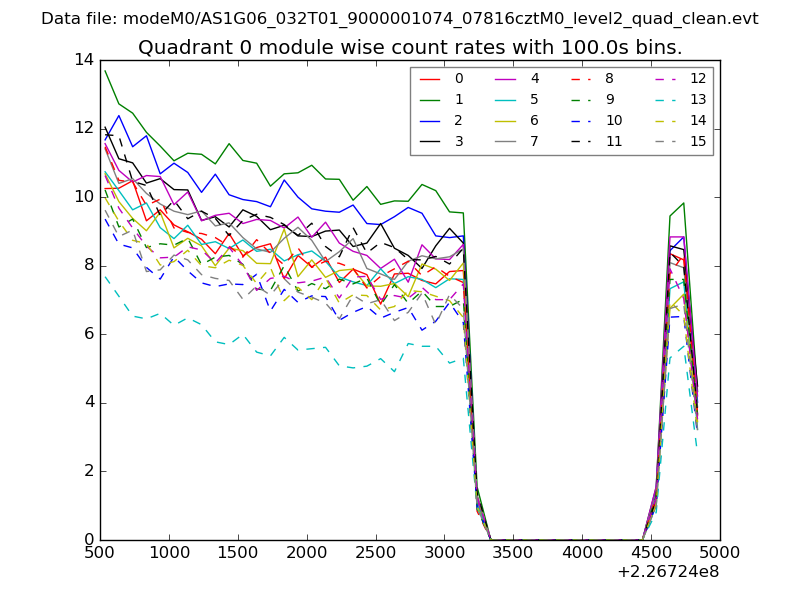 |
 |
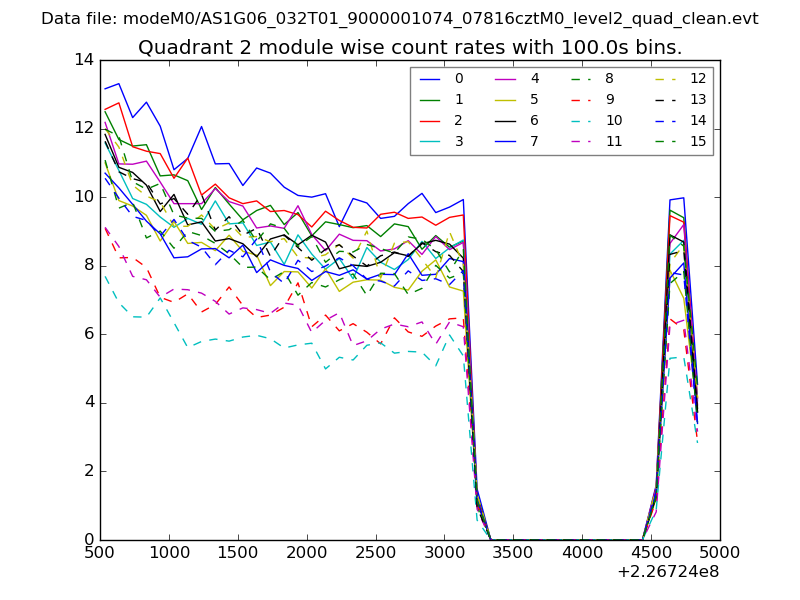
| Module-wise count rates for Quadrant B Data is divided into 100 sec bins |
 |
 |
| Module-wise count rates for Quadrant C Data is divided into 100 sec bins |
 |
 |
| Module-wise count rates for Quadrant D Data is divided into 100 sec bins |
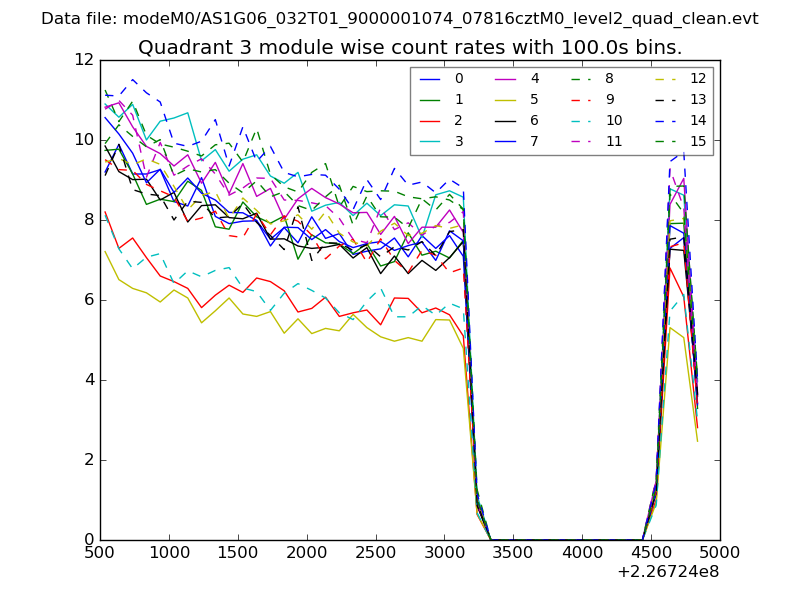 |
 |
| Parameter | Plot |
|---|---|
| CZT HV Monitor | 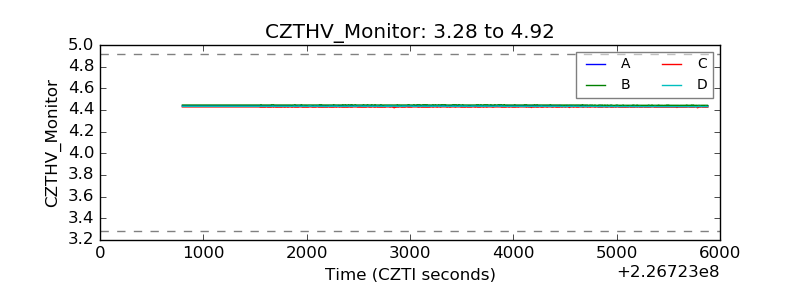 |
| D_VDD | 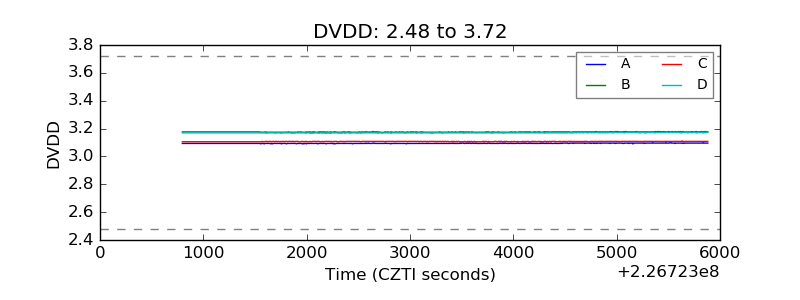 |
| Temperature 1 | 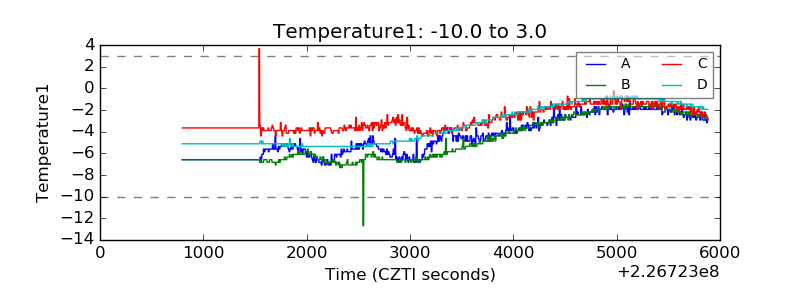 |
| Veto HV Monitor | 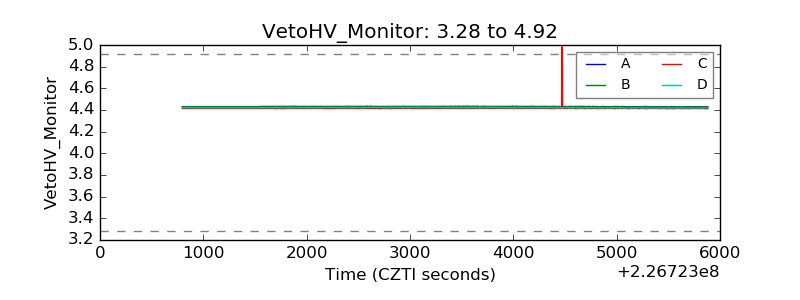 |
| Veto LLD | 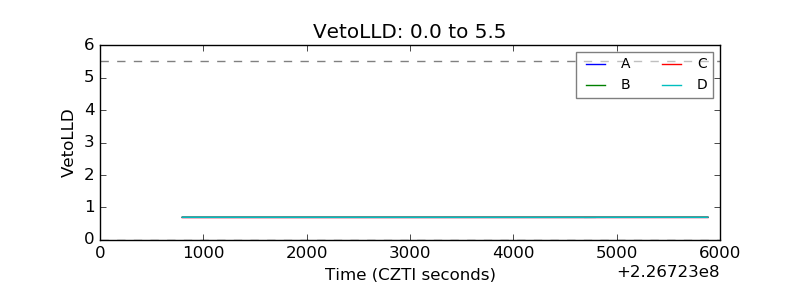 |
| Alpha Counter | 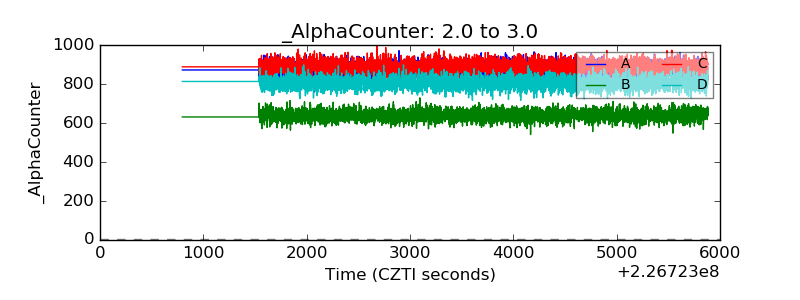 |
| _CPM_Rate | 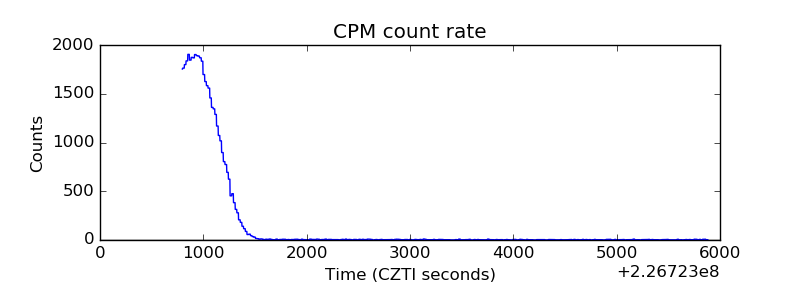 |
| CZT Counter | 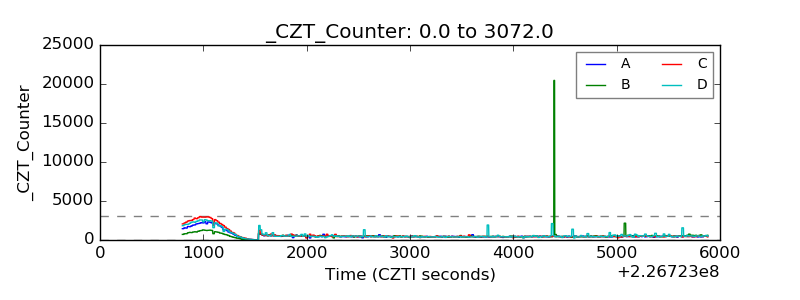 |
| +2.5 Volts monitor |  |
| +5 Volts monitor |  |
| _ROLL_ROT | 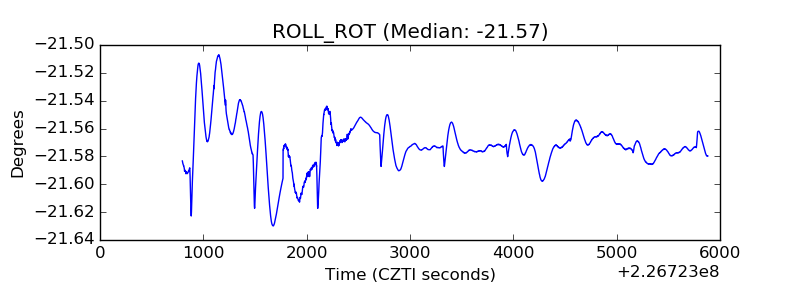 |
| _Roll_DEC | 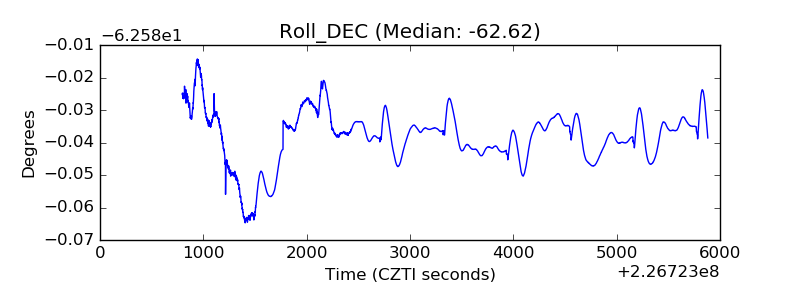 |
| _Roll_RA | 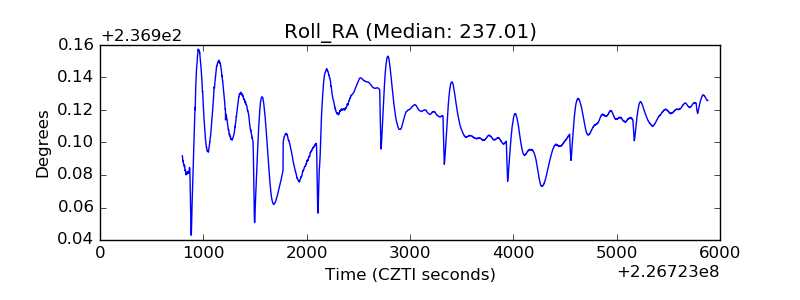 |
| Veto Counter | 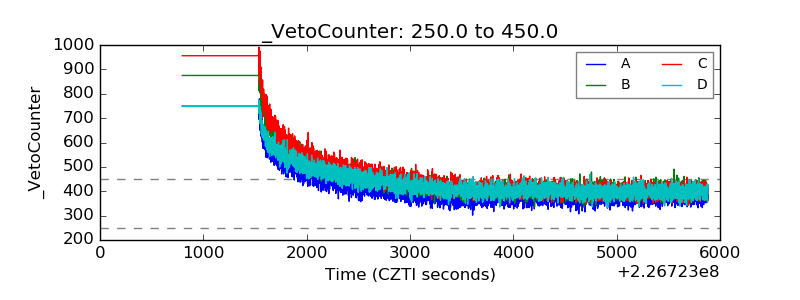 |