| Param | Original file | Final file |
|---|---|---|
| Filename | modeM0/AS1G06_077T02_9000001076cztM0_level2.fits | modeM0/AS1G06_077T02_9000001076cztM0_level2_quad_clean.evt |
| Size (bytes) | 2,370,925,440 | 2,456,412,480 |
| Size | 2.2 GB | 2.3 GB |
| Events in quadrant A | 14,179,390 | 14,693,027 |
| Events in quadrant B | 13,774,310 | 14,834,916 |
| Events in quadrant C | 14,141,210 | 14,338,366 |
| Events in quadrant D | 12,155,036 | 12,984,186 |
| Mode M9 | |||
|---|---|---|---|
| Quadrant | BADHDUFLAG | Total packets | Discarded packets |
| A | 0 | 375 | 0 |
| B | 0 | 375 | 0 |
| C | 0 | 375 | 0 |
| D | 0 | 375 | 0 |
| Mode M0 | |||
|---|---|---|---|
| Quadrant | BADHDUFLAG | Total packets | Discarded packets |
| A | 0 | 541085 | 0 |
| B | 0 | 565975 | 0 |
| C | 0 | 582134 | 0 |
| D | 0 | 590558 | 0 |
| Mode SS | |||
|---|---|---|---|
| Quadrant | BADHDUFLAG | Total packets | Discarded packets |
| A | 0 | 5212 | 0 |
| B | 0 | 5216 | 0 |
| C | 0 | 5216 | 0 |
| D | 0 | 5216 | 0 |
| Quadrant | Total seconds | Saturated seconds | Saturation percentage |
|---|---|---|---|
| A | 256224 | 4581 | 1.787889% |
| B | 256208 | 6997 | 2.730984% |
| C | 256227 | 4494 | 1.753914% |
| D | 256221 | 6809 | 2.657471% |
Noise dominated data is calculated using 1-second bins in cleaned event files. If a bin has >2000 counts, and if more than 50% of those come from <1% of pixels, then it is considered to be noise-dominated and hence unusable.
| Quadrant | # 1 sec bins | Bins with >0 counts | Bins with >2000 counts | High rate bins dominated by noise | Noise dominated (total time) | Noise dominated (detector-on time) | Marked lightcurve |
|---|---|---|---|---|---|---|---|
| A | 293577 | 256226 | 0 | 0 | 0.00% | 0.00% | 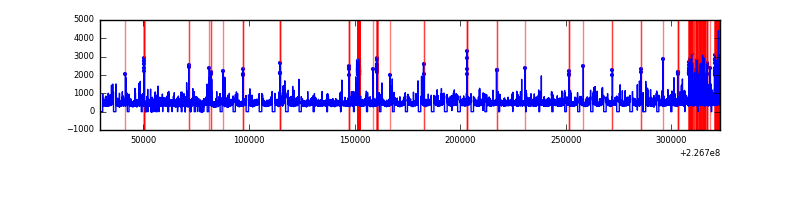 |
| B | 293577 | 256195 | 0 | 0 | 0.00% | 0.00% | 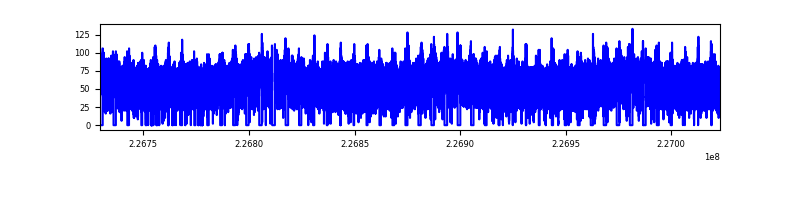 |
| C | 293577 | 256227 | 0 | 0 | 0.00% | 0.00% | 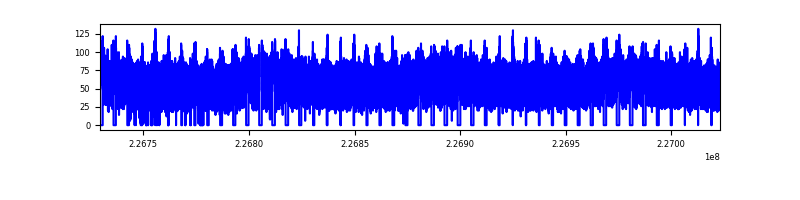 |
| D | 293577 | 256128 | 0 | 0 | 0.00% | 0.00% | 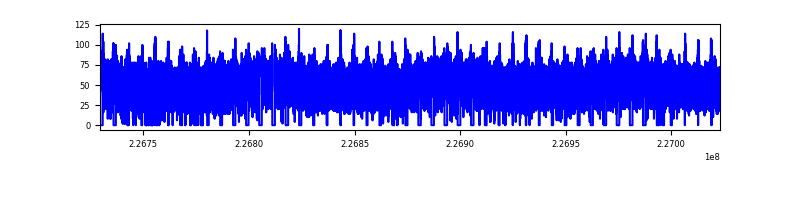 |
Top three noisy pixels from each quadrant. If the there are fewer than three noisy pixels in the level2.evt file, extra rows are filled as -1
| Pixel properties | Quadrant properties | ||||||
|---|---|---|---|---|---|---|---|
| Quadrant | DetID | PixID | Counts | Sigma | Mean | Median | Sigma |
| A | 0 | 29 | 13565 | 10.91 | 3685 | 3428 | 929.3 |
| A | 7 | 110 | 12019 | 9.25 | 3685 | 3428 | 929.3 |
| A | 0 | 30 | 10736 | 7.86 | 3685 | 3428 | 929.3 |
| B | 2 | 9 | 11990 | 11.81 | 3628 | 3431 | 725.0 |
| B | 12 | 226 | 9365 | 8.18 | 3628 | 3431 | 725.0 |
| B | 3 | 17 | 9328 | 8.13 | 3628 | 3431 | 725.0 |
| C | 1 | 80 | 10505 | 7.13 | 3740 | 3447 | 989.1 |
| C | 1 | 81 | 10336 | 6.96 | 3740 | 3447 | 989.1 |
| C | 12 | 241 | 9961 | 6.59 | 3740 | 3447 | 989.1 |
| D | 7 | 3 | 8905 | 6.25 | 3473 | 3146 | 921.8 |
| D | 7 | 5 | 8831 | 6.17 | 3473 | 3146 | 921.8 |
| D | 6 | 231 | 8791 | 6.12 | 3473 | 3146 | 921.8 |
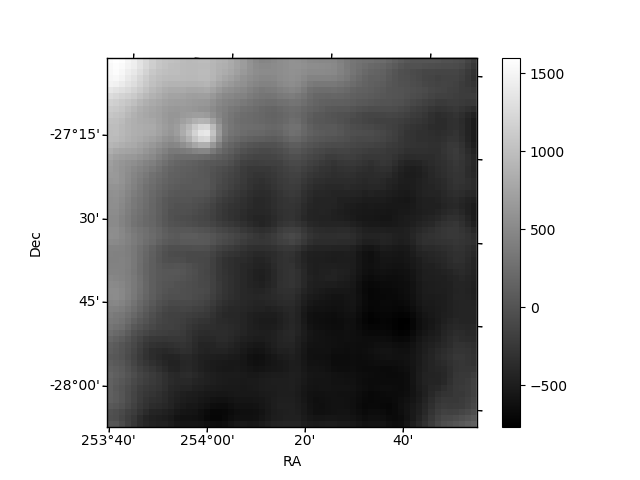
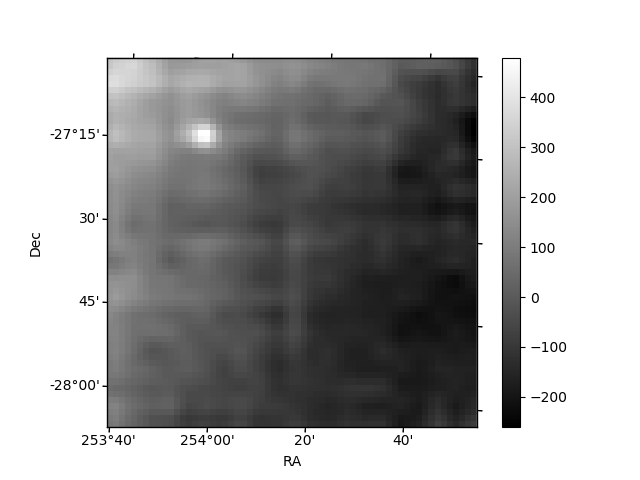
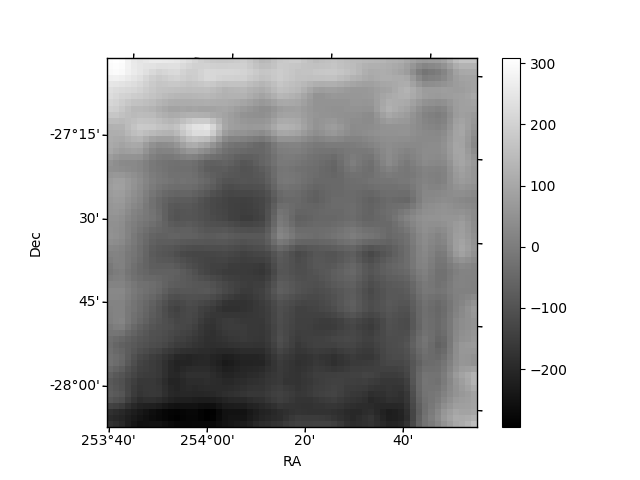
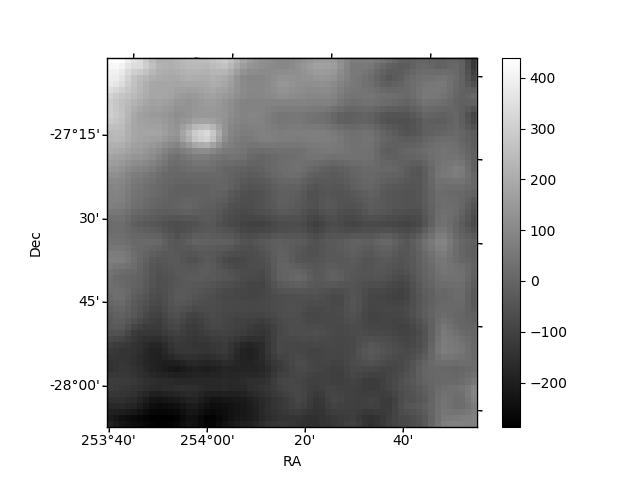
Histogram calculated using DETX and DETY for each event in the final _common_clean file
| Quadrant A | 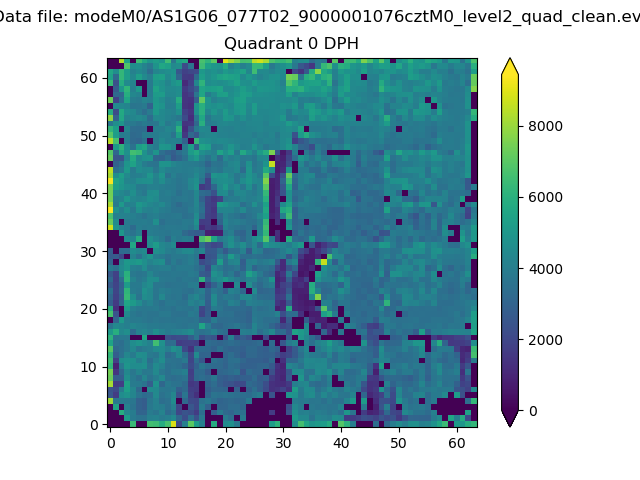 |
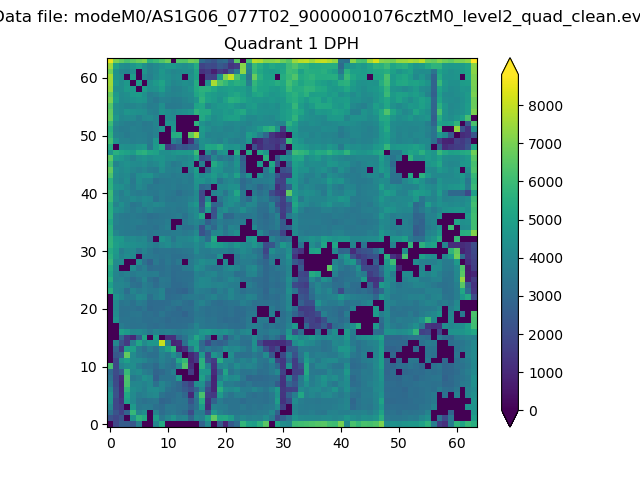 |
Quadrant B |
|---|---|---|---|
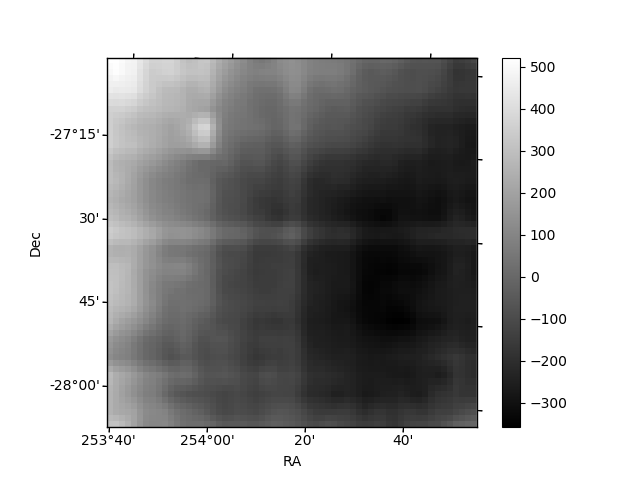
| Quadrant D | 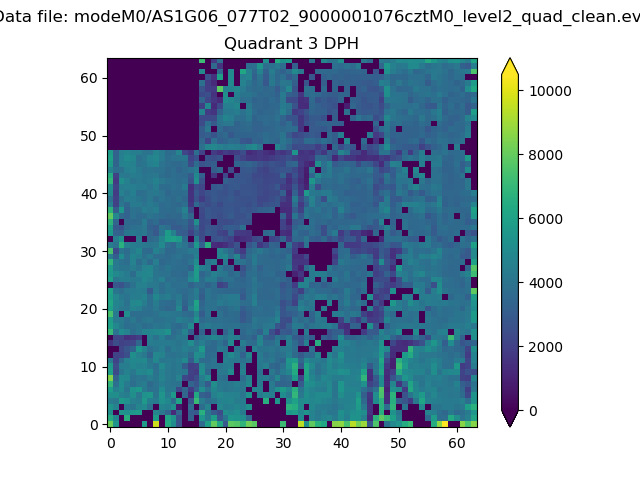 |
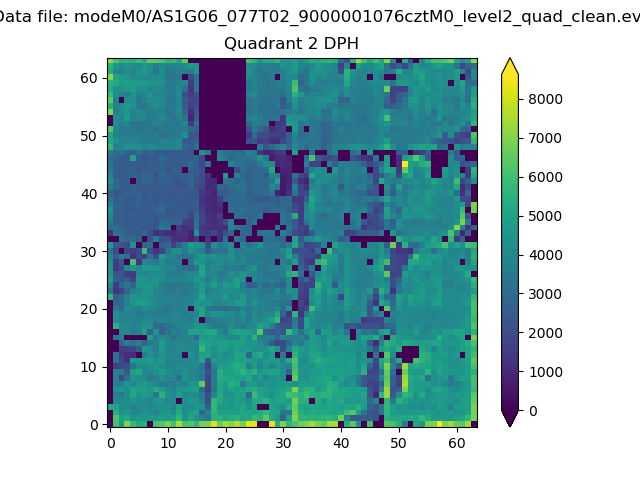 |
Quadrant C |
| Plot type | Count rate plots | Images |
|---|---|---|
| Comparison with Poisson distribution Blue bars denote a histogram of data divided into 1 sec bins. Red curve is a Poisson curve with rate = median count rate of data. |
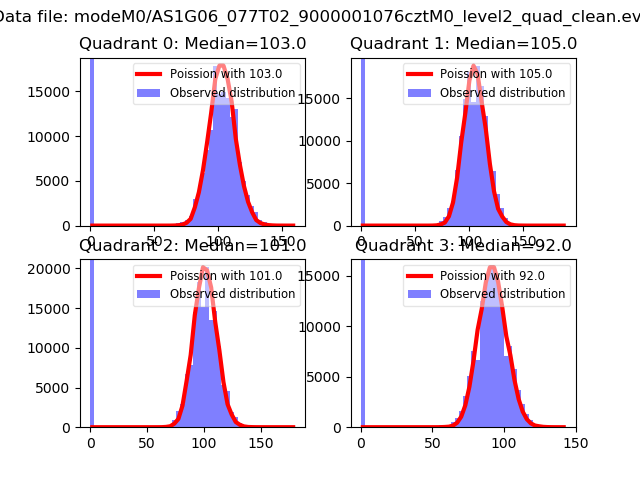 |
 |
| Quadrant-wise count rates Data is divided into 100 sec bins |
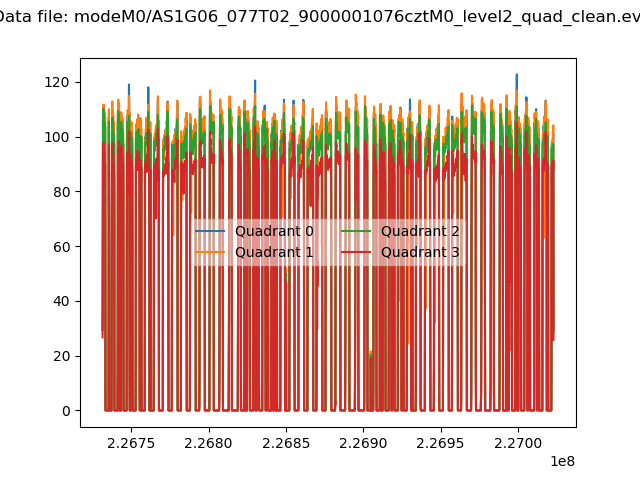 |
|
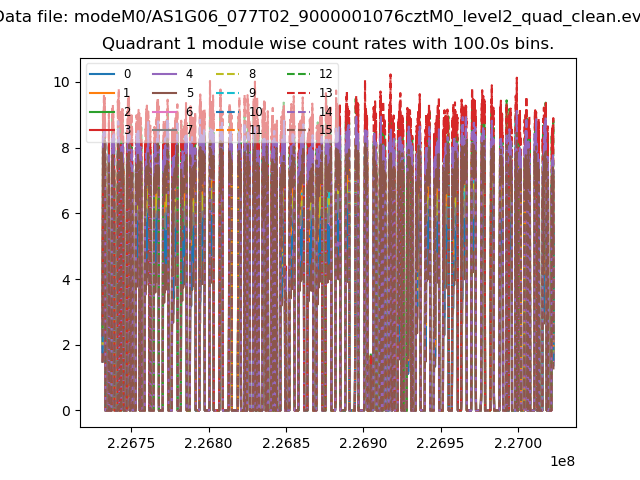
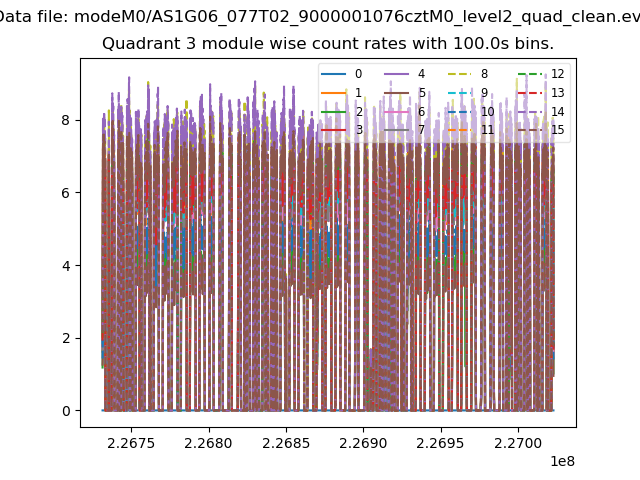
| Module-wise count rates for Quadrant A Data is divided into 100 sec bins |
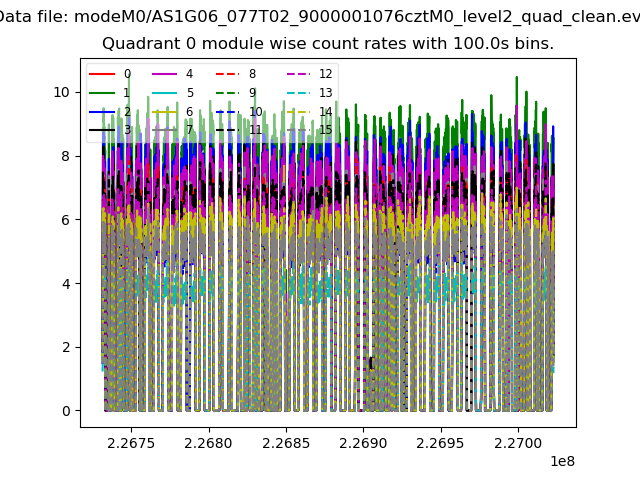 |
 |
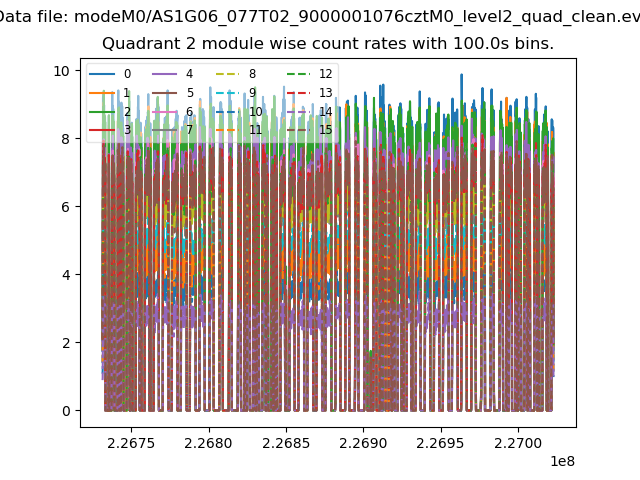
| Module-wise count rates for Quadrant B Data is divided into 100 sec bins |
 |
 |
| Module-wise count rates for Quadrant C Data is divided into 100 sec bins |
 |
 |
| Module-wise count rates for Quadrant D Data is divided into 100 sec bins |
 |
 |
| Parameter | Plot |
|---|---|
| CZT HV Monitor | 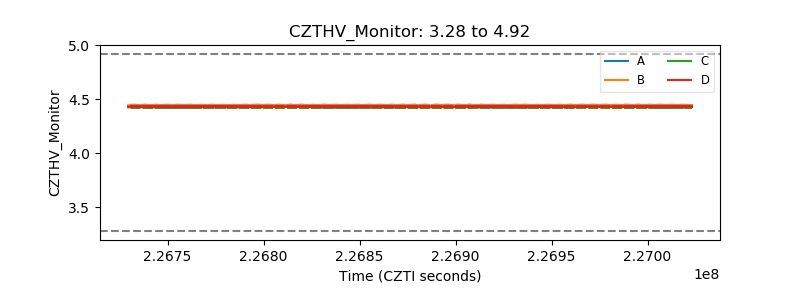 |
| D_VDD | 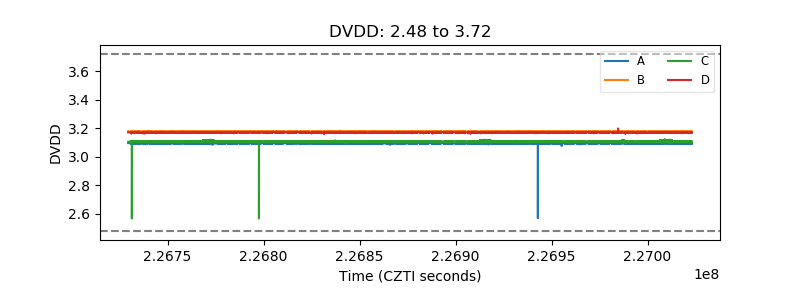 |
| Temperature 1 | 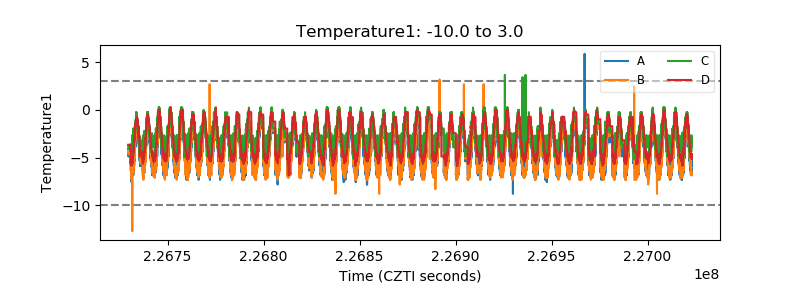 |
| Veto HV Monitor | 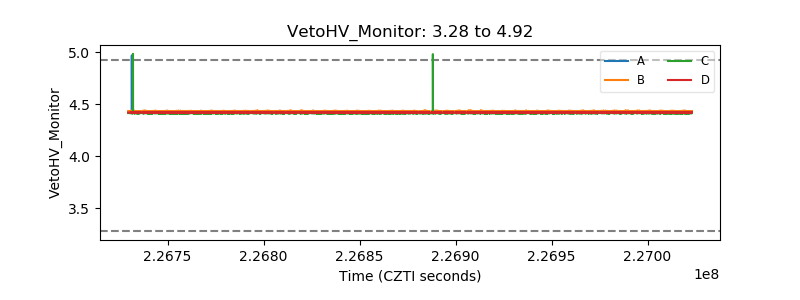 |
| Veto LLD | 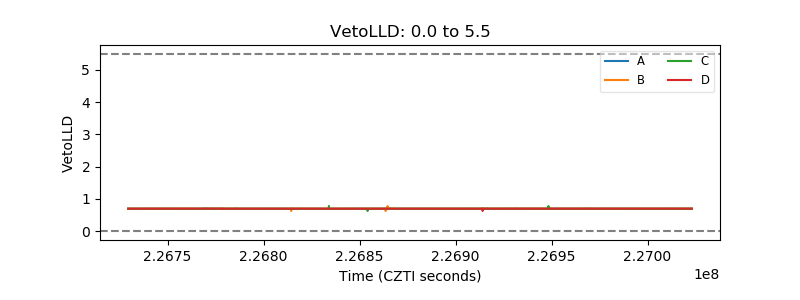 |
| Alpha Counter | 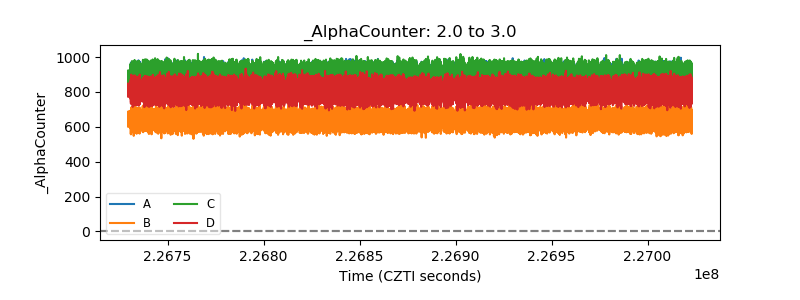 |
| _CPM_Rate | 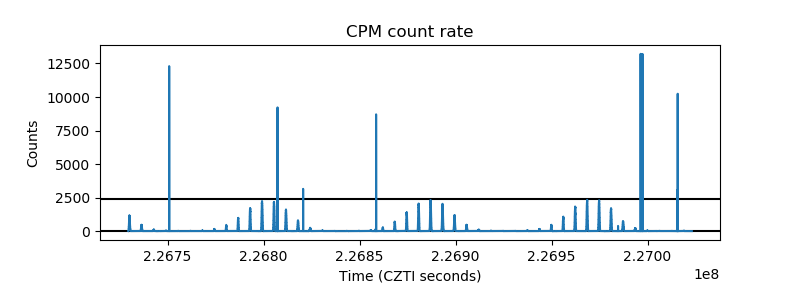 |
| CZT Counter | 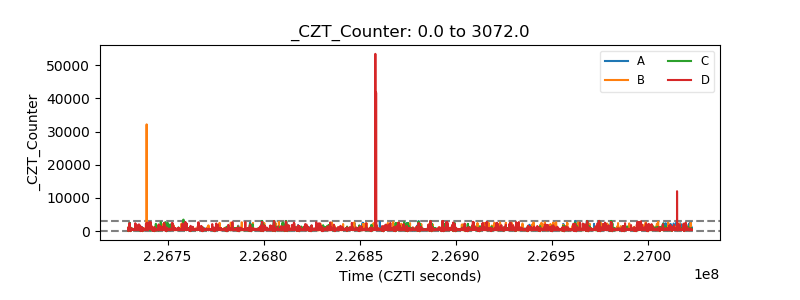 |
| +2.5 Volts monitor | 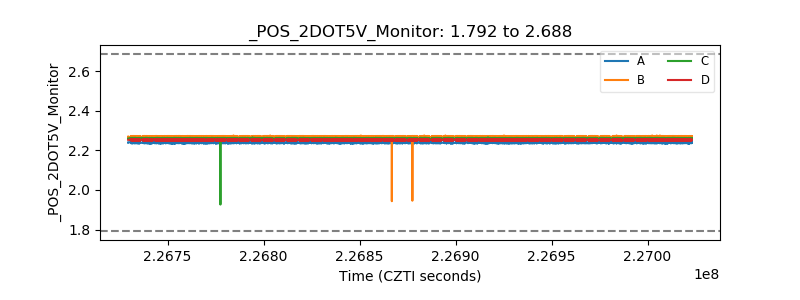 |
| +5 Volts monitor | 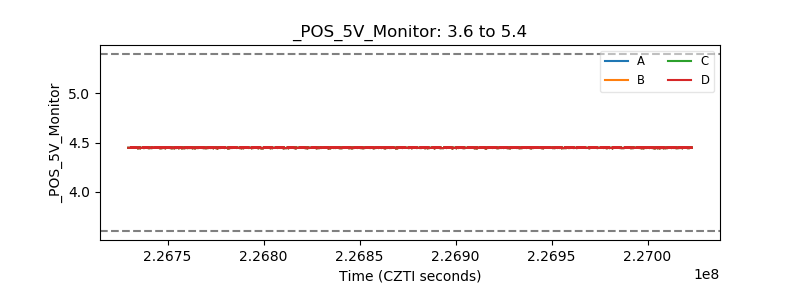 |
| _ROLL_ROT | 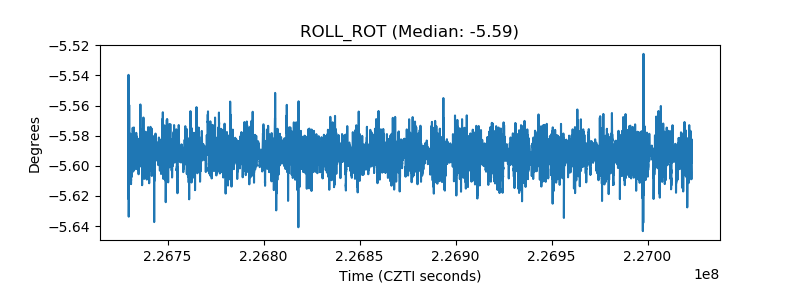 |
| _Roll_DEC | 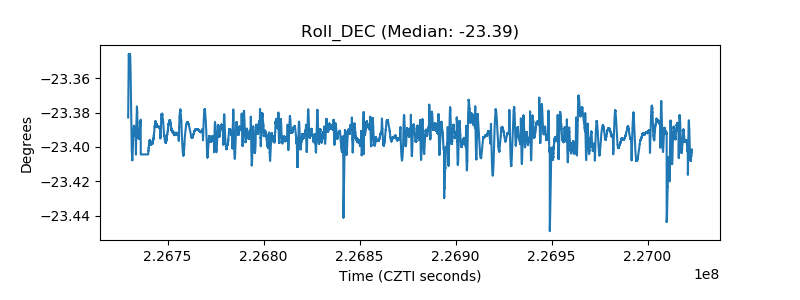 |
| _Roll_RA | 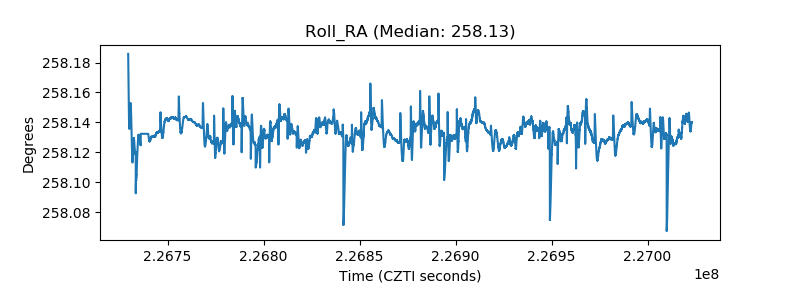 |
| Veto Counter | 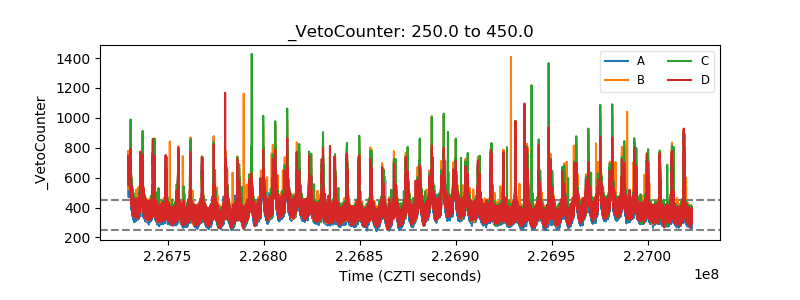 |