| Param | Original file | Final file |
|---|---|---|
| Filename | modeM0/AS1G06_077T02_9000001076_07816cztM0_level2.evt | modeM0/AS1G06_077T02_9000001076_07816cztM0_level2_quad_clean.evt |
| Size (bytes) | 113,077,440 | 35,020,800 |
| Size | 107.8 MB | 33.4 MB |
| Events in quadrant A | 802,683 | 231,680 |
| Events in quadrant B | 841,902 | 239,708 |
| Events in quadrant C | 831,474 | 239,418 |
| Events in quadrant D | 831,156 | 225,638 |
| Mode M9 | |||
|---|---|---|---|
| Quadrant | BADHDUFLAG | Total packets | Discarded packets |
| A | 0 | 12 | 0 |
| B | 0 | 12 | 0 |
| C | 0 | 12 | 0 |
| D | 0 | 12 | 0 |
| Mode M0 | |||
|---|---|---|---|
| Quadrant | BADHDUFLAG | Total packets | Discarded packets |
| A | 0 | 3467 | 2 |
| B | 0 | 3540 | 1 |
| C | 0 | 3495 | 1 |
| D | 0 | 3573 | 1 |
| Mode SS | |||
|---|---|---|---|
| Quadrant | BADHDUFLAG | Total packets | Discarded packets |
| A | 0 | 38 | 0 |
| B | 0 | 38 | 0 |
| C | 0 | 38 | 0 |
| D | 0 | 38 | 0 |
| Quadrant | Total seconds | Saturated seconds | Saturation percentage |
|---|---|---|---|
| A | 1675 | 16 | 0.955224% |
| B | 1675 | 21 | 1.253731% |
| C | 1675 | 9 | 0.537313% |
| D | 1675 | 5 | 0.298507% |
Noise dominated data is calculated using 1-second bins in cleaned event files. If a bin has >2000 counts, and if more than 50% of those come from <1% of pixels, then it is considered to be noise-dominated and hence unusable.
| Quadrant | # 1 sec bins | Bins with >0 counts | Bins with >2000 counts | High rate bins dominated by noise | Noise dominated (total time) | Noise dominated (detector-on time) | Marked lightcurve |
|---|---|---|---|---|---|---|---|
| A | 2940 | 1675 | 0 | 0 | 0.00% | 0.00% | 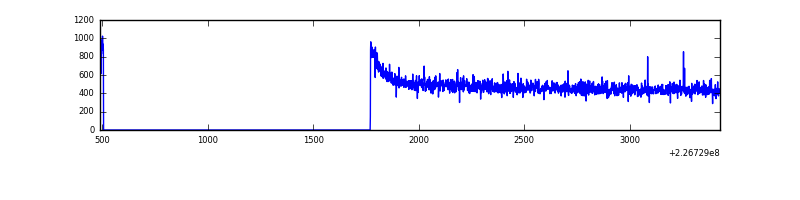 |
| B | 2940 | 1675 | 0 | 0 | 0.00% | 0.00% | 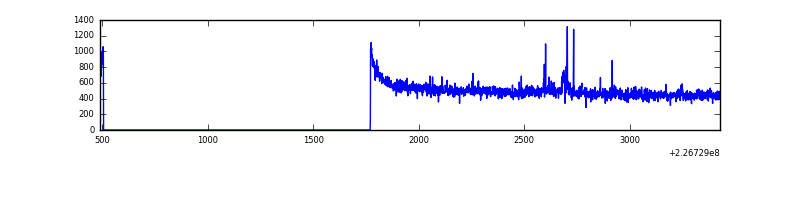 |
| C | 2940 | 1676 | 1 | 1 | 0.03% | 0.06% | 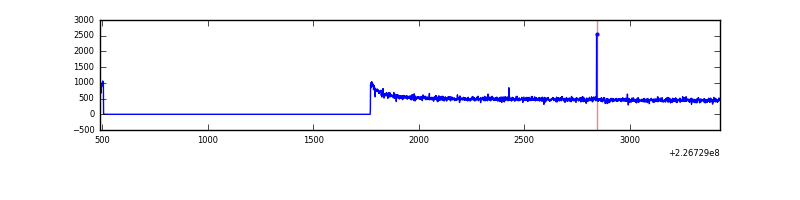 |
| D | 2940 | 1675 | 2 | 2 | 0.07% | 0.12% | 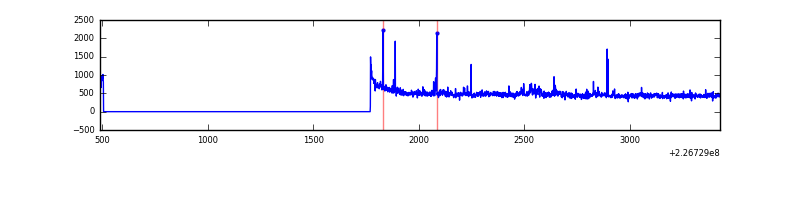 |
Top three noisy pixels from each quadrant. If the there are fewer than three noisy pixels in the level2.evt file, extra rows are filled as -1
| Pixel properties | Quadrant properties | ||||||
|---|---|---|---|---|---|---|---|
| Quadrant | DetID | PixID | Counts | Sigma | Mean | Median | Sigma |
| A | 3 | 1 | 2240 | 47.68 | 207 | 203 | 42.7 |
| A | 0 | 226 | 1893 | 39.56 | 207 | 203 | 42.7 |
| A | 12 | 194 | 1739 | 35.95 | 207 | 203 | 42.7 |
| B | 4 | 173 | 13124 | 309.2 | 212 | 207 | 41.8 |
| B | 12 | 111 | 4092 | 93.0 | 212 | 207 | 41.8 |
| B | 4 | 81 | 3727 | 84.26 | 212 | 207 | 41.8 |
| C | 1 | 16 | 11034 | 217.68 | 209 | 211 | 49.7 |
| C | 12 | 4 | 2891 | 53.9 | 209 | 211 | 49.7 |
| C | 13 | 61 | 1681 | 29.57 | 209 | 211 | 49.7 |
| D | 12 | 221 | 31209 | 595.0 | 205 | 200 | 52.1 |
| D | 13 | 104 | 12068 | 227.72 | 205 | 200 | 52.1 |
| D | 2 | 152 | 5887 | 109.12 | 205 | 200 | 52.1 |
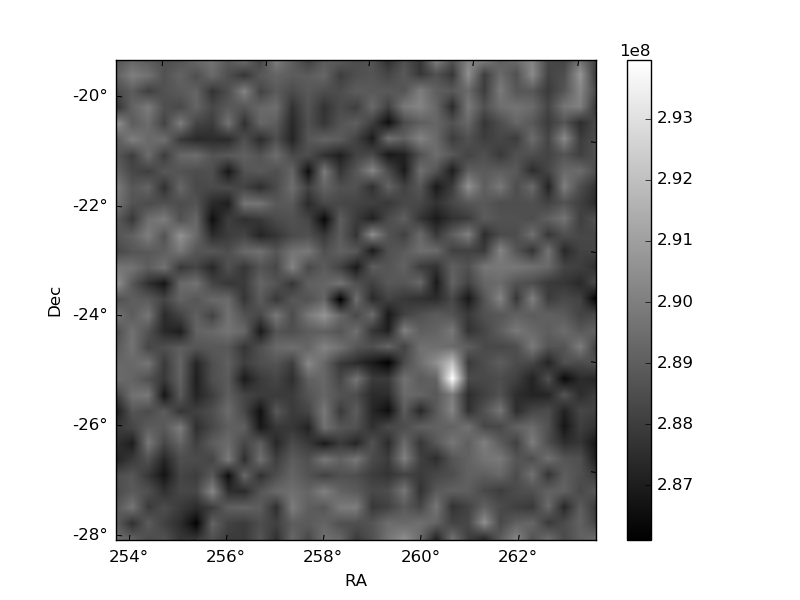
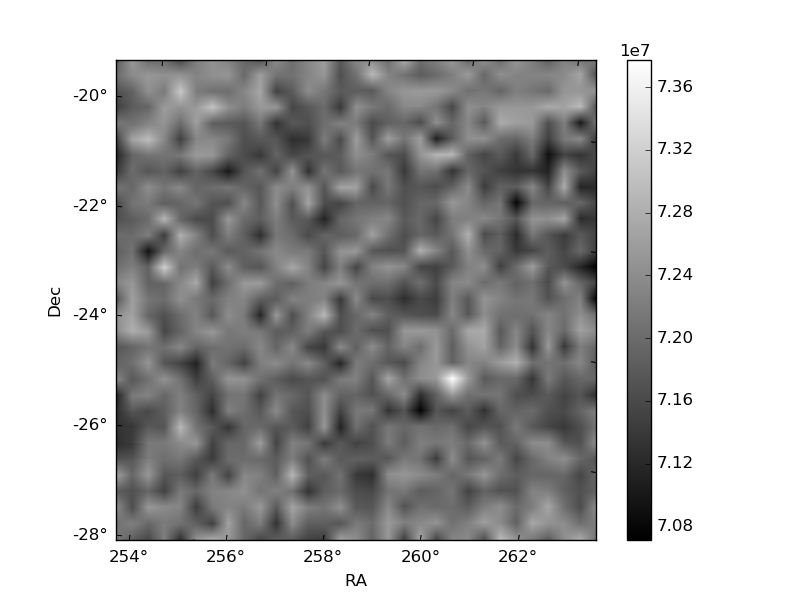
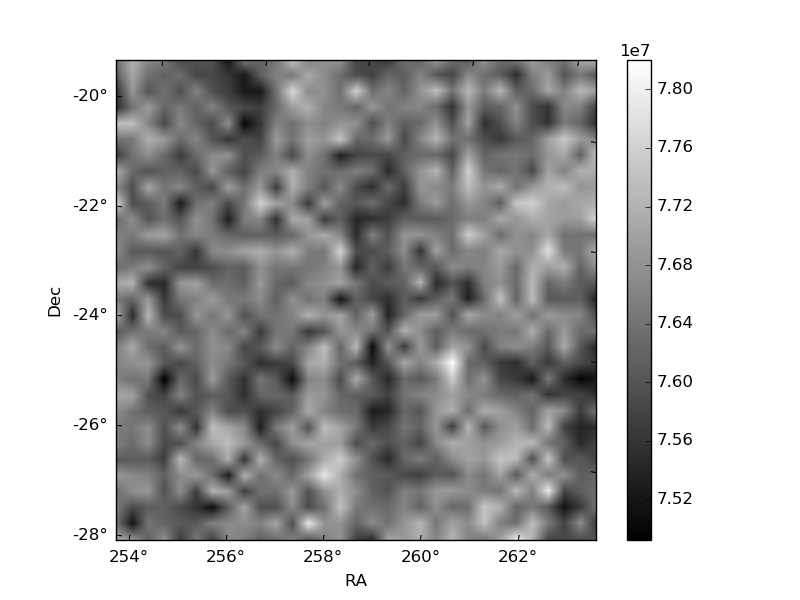
Histogram calculated using DETX and DETY for each event in the final _common_clean file
| Quadrant A | 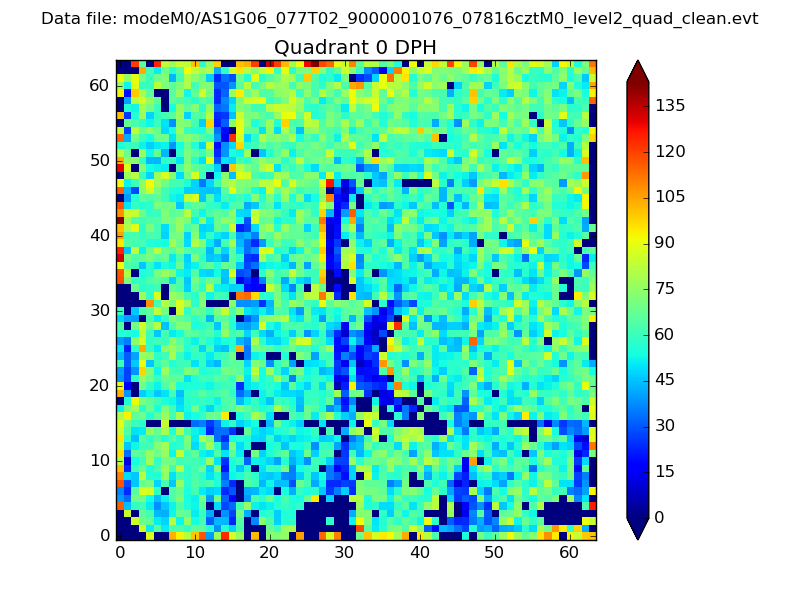 |
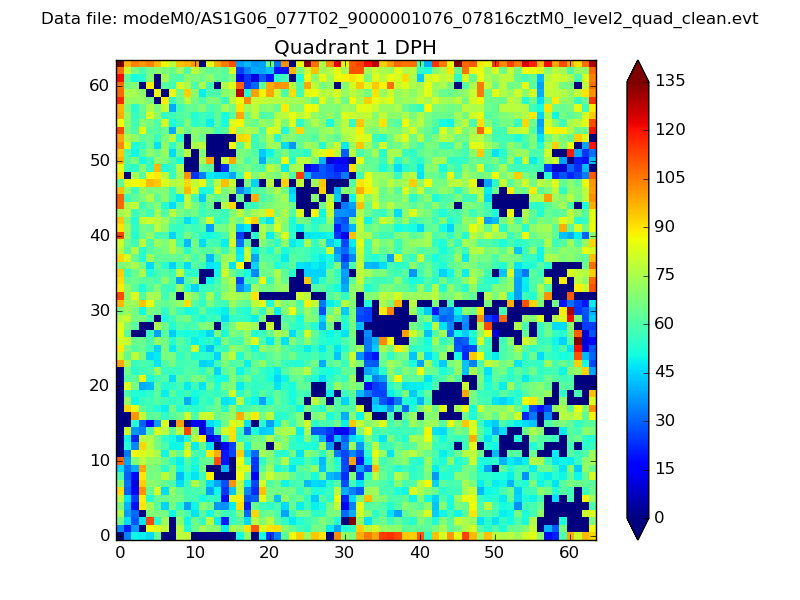 |
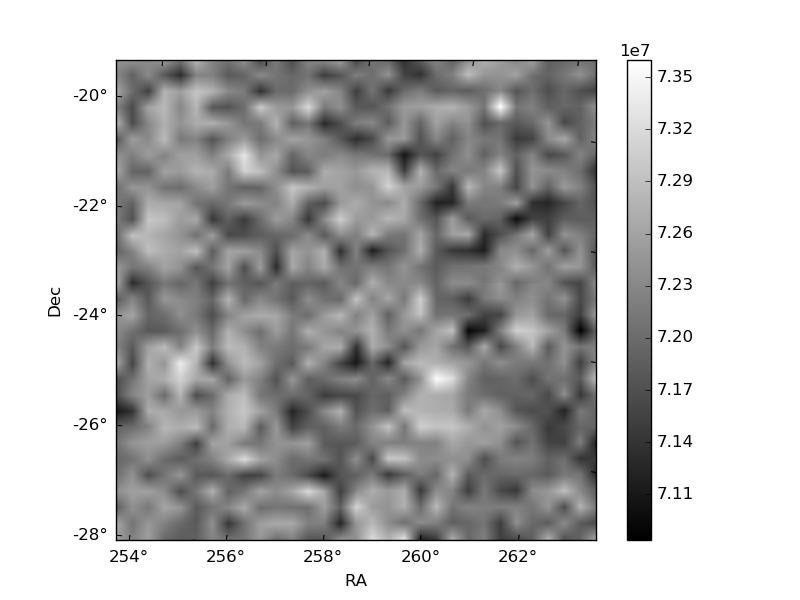
Quadrant B |
|---|---|---|---|
| Quadrant D | 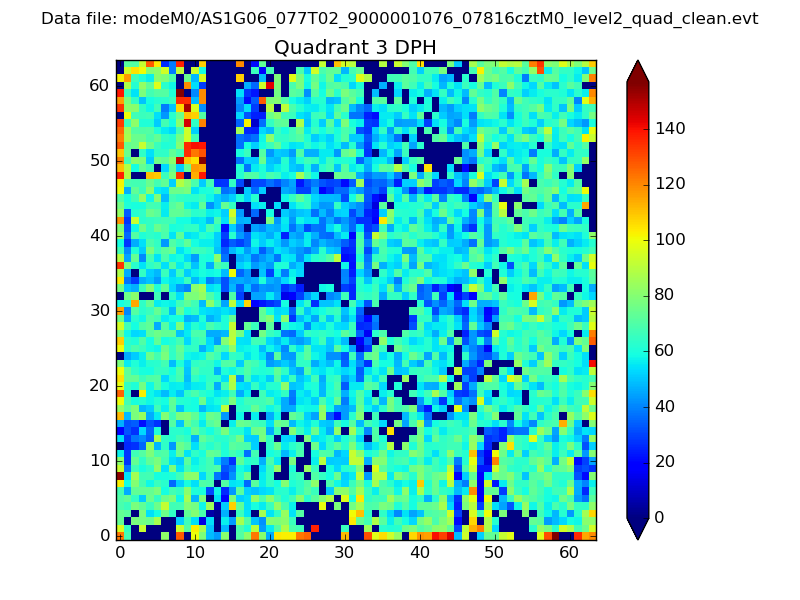 |
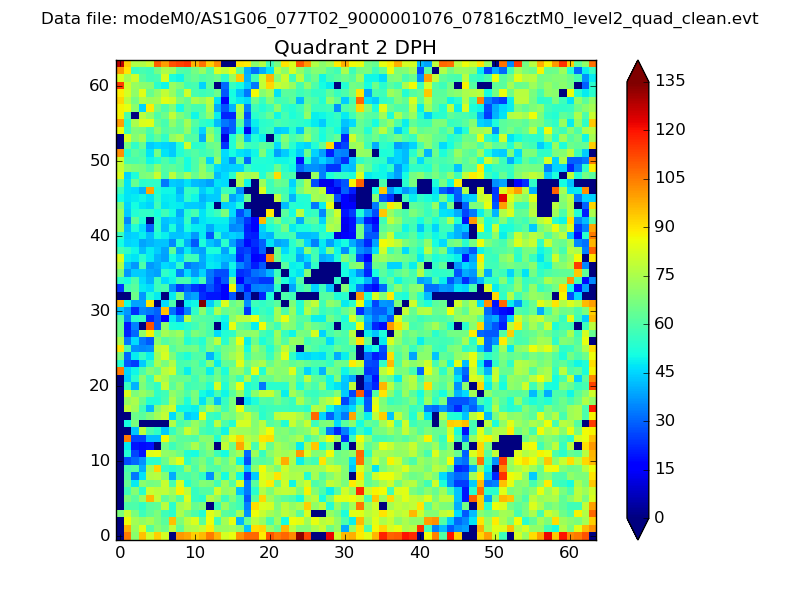 |
Quadrant C |
| Plot type | Count rate plots | Images |
|---|---|---|
| Comparison with Poisson distribution Blue bars denote a histogram of data divided into 1 sec bins. Red curve is a Poisson curve with rate = median count rate of data. |
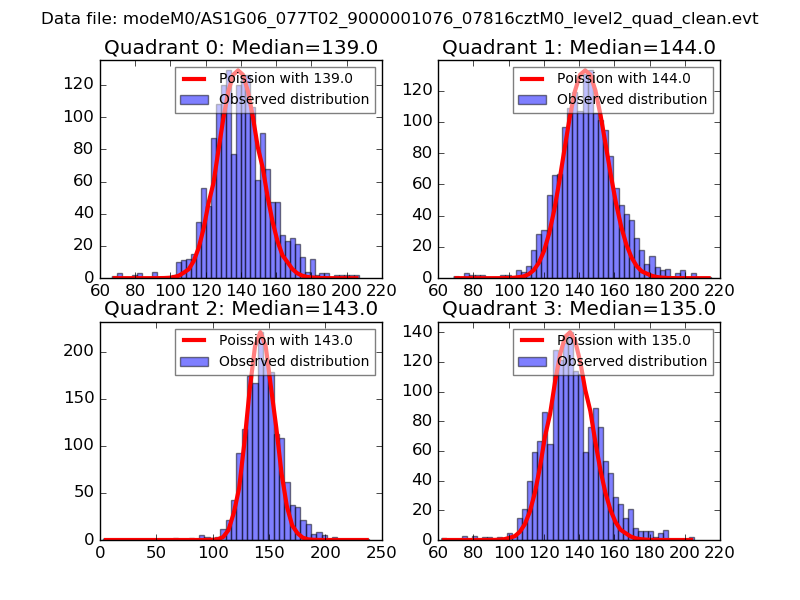 |
 |
| Quadrant-wise count rates Data is divided into 100 sec bins |
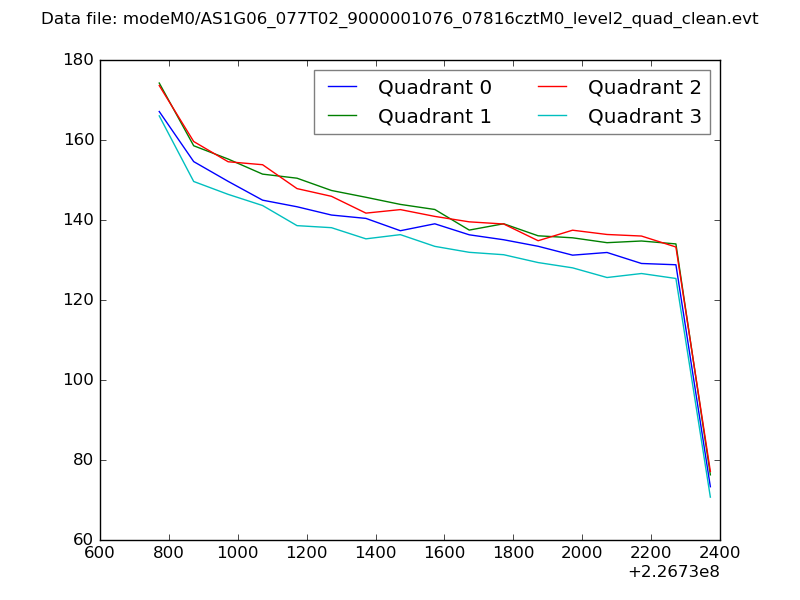 |
|
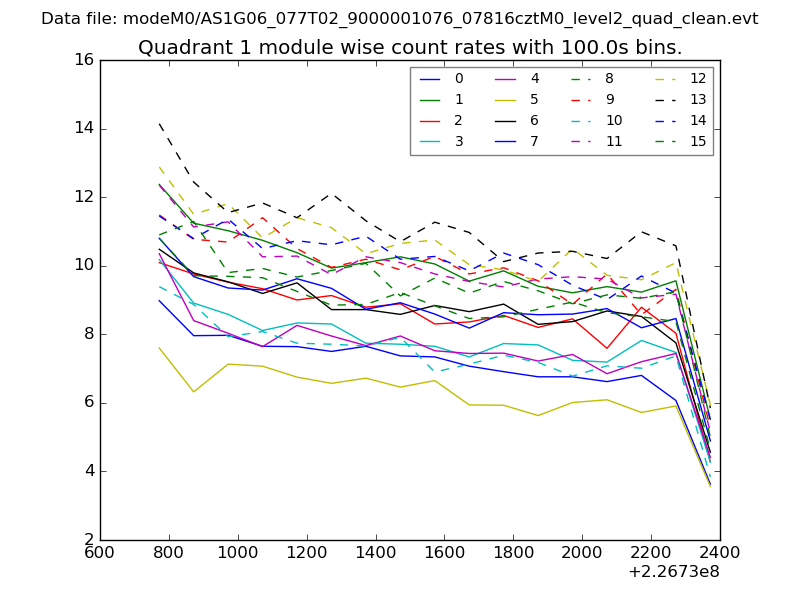
| Module-wise count rates for Quadrant A Data is divided into 100 sec bins |
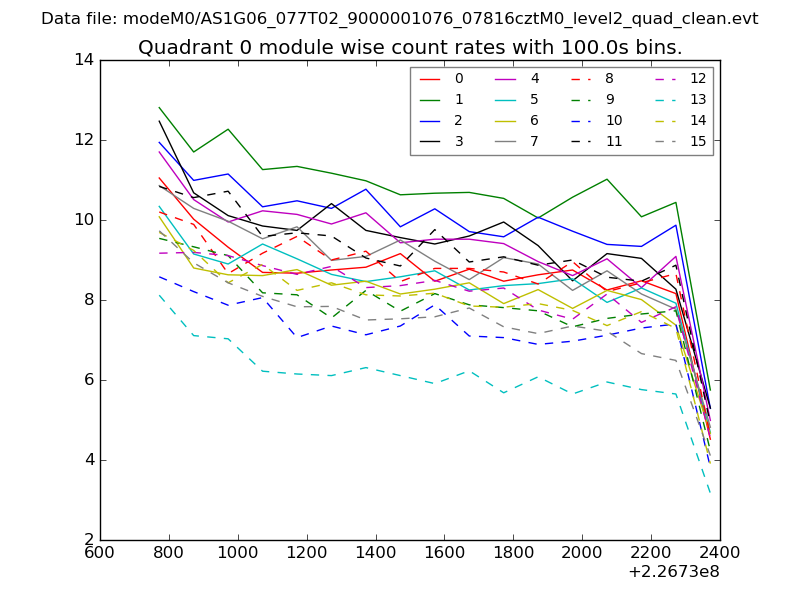 |
 |
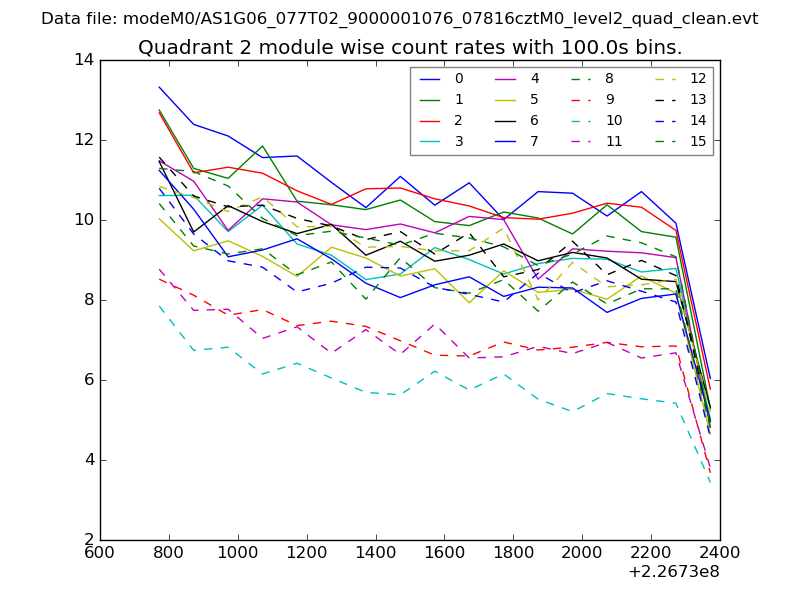
| Module-wise count rates for Quadrant B Data is divided into 100 sec bins |
 |
 |
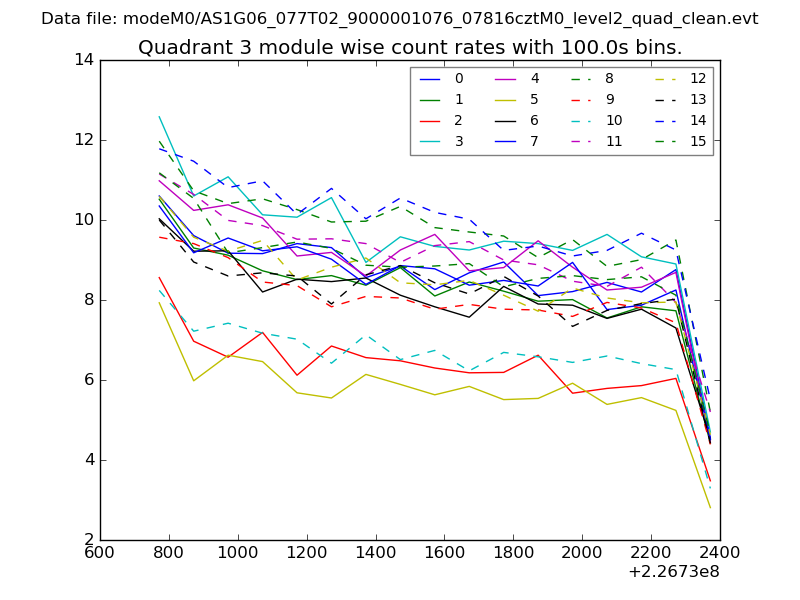
| Module-wise count rates for Quadrant C Data is divided into 100 sec bins |
 |
 |
| Module-wise count rates for Quadrant D Data is divided into 100 sec bins |
 |
 |
| Parameter | Plot |
|---|---|
| CZT HV Monitor | 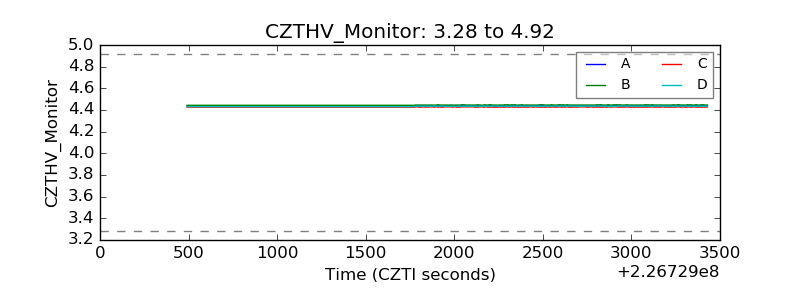 |
| D_VDD | 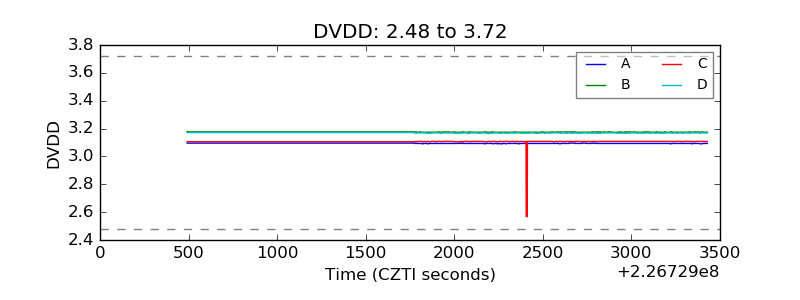 |
| Temperature 1 | 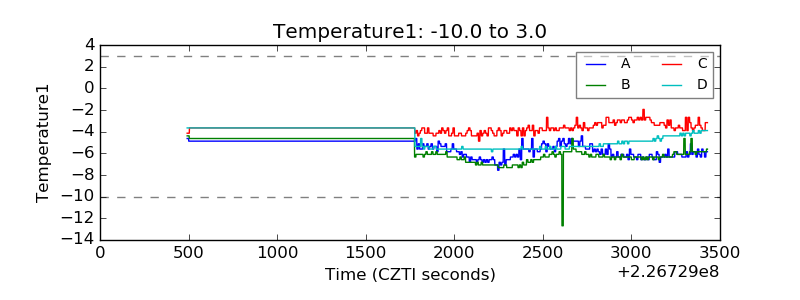 |
| Veto HV Monitor | 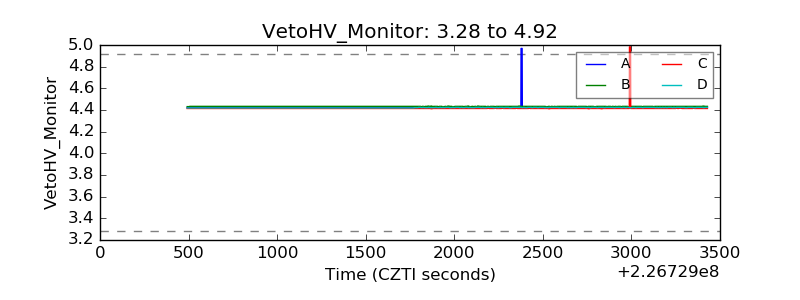 |
| Veto LLD | 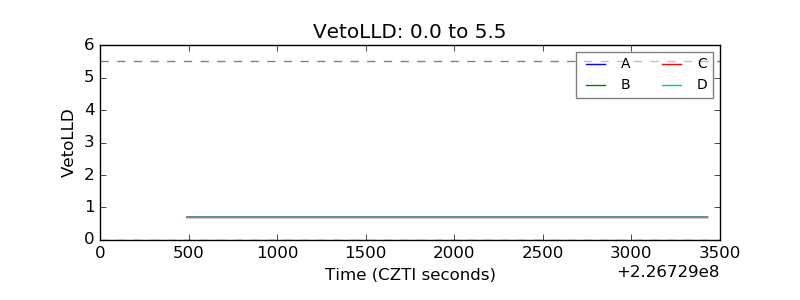 |
| Alpha Counter | 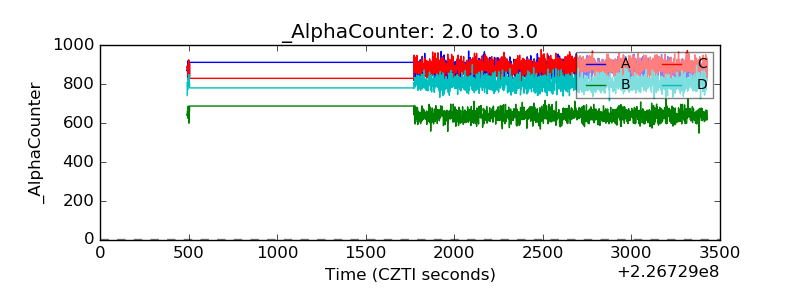 |
| _CPM_Rate | 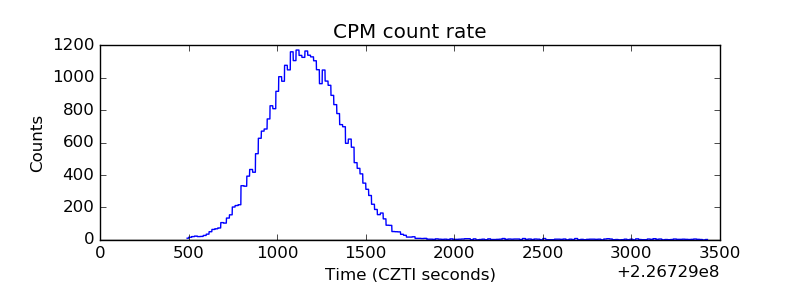 |
| CZT Counter | 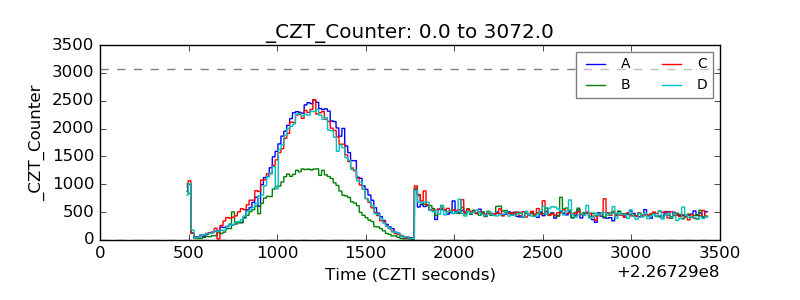 |
| +2.5 Volts monitor |  |
| +5 Volts monitor |  |
| _ROLL_ROT | 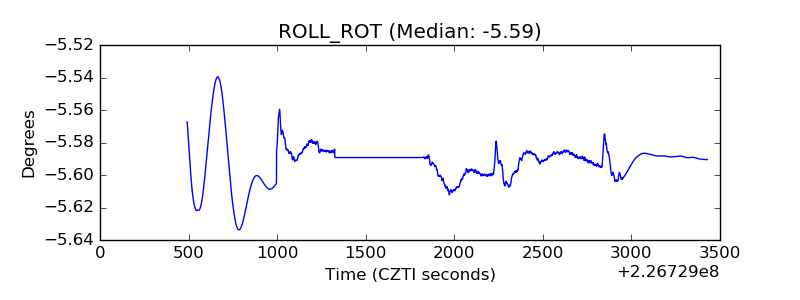 |
| _Roll_DEC | 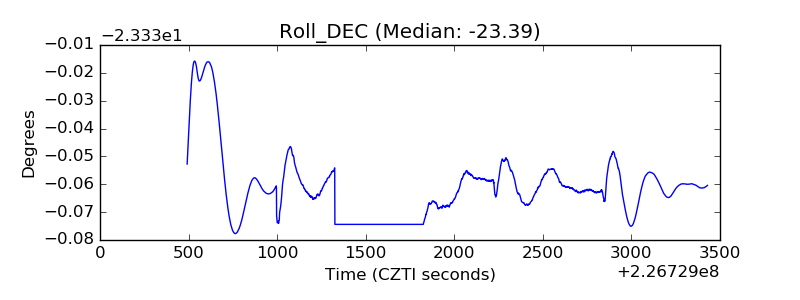 |
| _Roll_RA | 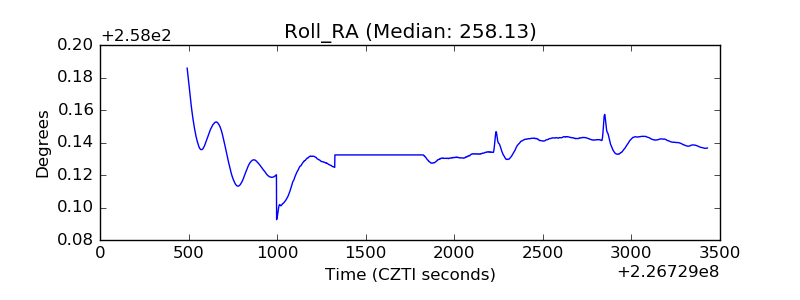 |
| Veto Counter | 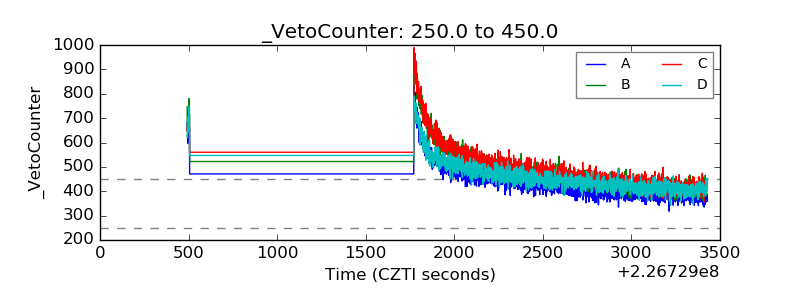 |