| Param | Original file | Final file |
|---|---|---|
| Filename | modeM0/AS1G06_077T02_9000001076_07817cztM0_level2.evt | modeM0/AS1G06_077T02_9000001076_07817cztM0_level2_quad_clean.evt |
| Size (bytes) | 114,647,040 | 36,561,600 |
| Size | 109.3 MB | 34.9 MB |
| Events in quadrant A | 813,691 | 241,800 |
| Events in quadrant B | 852,867 | 250,565 |
| Events in quadrant C | 842,889 | 250,170 |
| Events in quadrant D | 840,289 | 235,585 |
| Mode M0 | |||
|---|---|---|---|
| Quadrant | BADHDUFLAG | Total packets | Discarded packets |
| A | 0 | 3562 | 1 |
| B | 0 | 3629 | 0 |
| C | 0 | 3585 | 0 |
| D | 0 | 3665 | 0 |
| Mode SS | |||
|---|---|---|---|
| Quadrant | BADHDUFLAG | Total packets | Discarded packets |
| A | 0 | 34 | 0 |
| B | 0 | 34 | 0 |
| C | 0 | 34 | 0 |
| D | 0 | 34 | 0 |
| Quadrant | Total seconds | Saturated seconds | Saturation percentage |
|---|---|---|---|
| A | 1761 | 0 | 0.000000% |
| B | 1761 | 2 | 0.113572% |
| C | 1761 | 2 | 0.113572% |
| D | 1761 | 2 | 0.113572% |
Noise dominated data is calculated using 1-second bins in cleaned event files. If a bin has >2000 counts, and if more than 50% of those come from <1% of pixels, then it is considered to be noise-dominated and hence unusable.
| Quadrant | # 1 sec bins | Bins with >0 counts | Bins with >2000 counts | High rate bins dominated by noise | Noise dominated (total time) | Noise dominated (detector-on time) | Marked lightcurve |
|---|---|---|---|---|---|---|---|
| A | 1761 | 1761 | 0 | 0 | 0.00% | 0.00% | 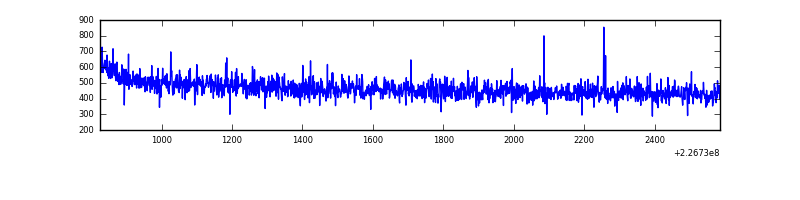 |
| B | 1761 | 1761 | 0 | 0 | 0.00% | 0.00% | 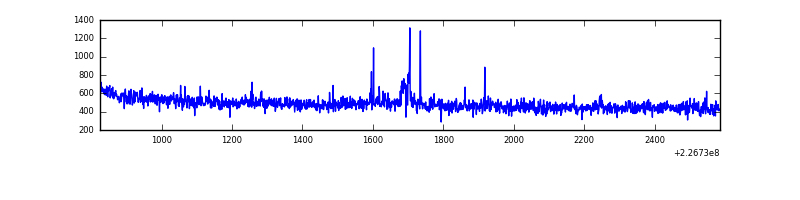 |
| C | 1761 | 1761 | 1 | 1 | 0.06% | 0.06% | 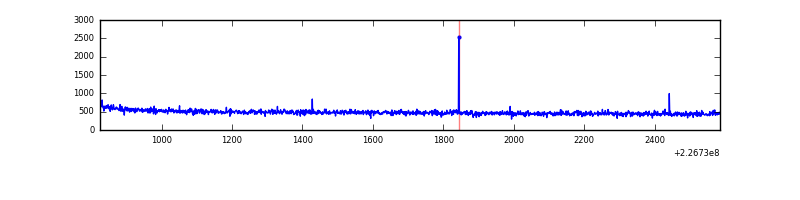 |
| D | 1761 | 1761 | 2 | 2 | 0.11% | 0.11% | 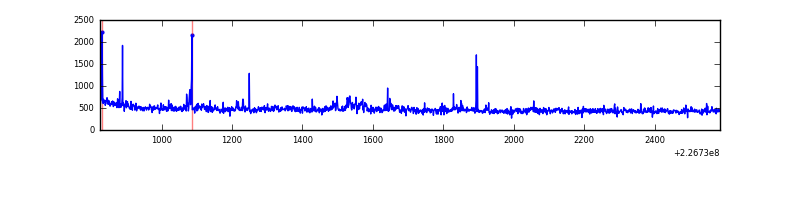 |
Top three noisy pixels from each quadrant. If the there are fewer than three noisy pixels in the level2.evt file, extra rows are filled as -1
| Pixel properties | Quadrant properties | ||||||
|---|---|---|---|---|---|---|---|
| Quadrant | DetID | PixID | Counts | Sigma | Mean | Median | Sigma |
| A | 3 | 1 | 2137 | 44.75 | 210 | 206 | 43.1 |
| A | 0 | 226 | 1927 | 39.89 | 210 | 206 | 43.1 |
| A | 12 | 194 | 1777 | 36.41 | 210 | 206 | 43.1 |
| B | 4 | 173 | 13471 | 314.41 | 215 | 210 | 42.2 |
| B | 12 | 111 | 4073 | 91.59 | 215 | 210 | 42.2 |
| B | 11 | 111 | 3134 | 69.33 | 215 | 210 | 42.2 |
| C | 1 | 16 | 10579 | 206.64 | 212 | 214 | 50.2 |
| C | 12 | 4 | 3642 | 68.34 | 212 | 214 | 50.2 |
| C | 13 | 61 | 1731 | 30.24 | 212 | 214 | 50.2 |
| D | 12 | 221 | 30619 | 579.08 | 208 | 202 | 52.5 |
| D | 13 | 104 | 12068 | 225.91 | 208 | 202 | 52.5 |
| D | 2 | 152 | 5346 | 97.93 | 208 | 202 | 52.5 |
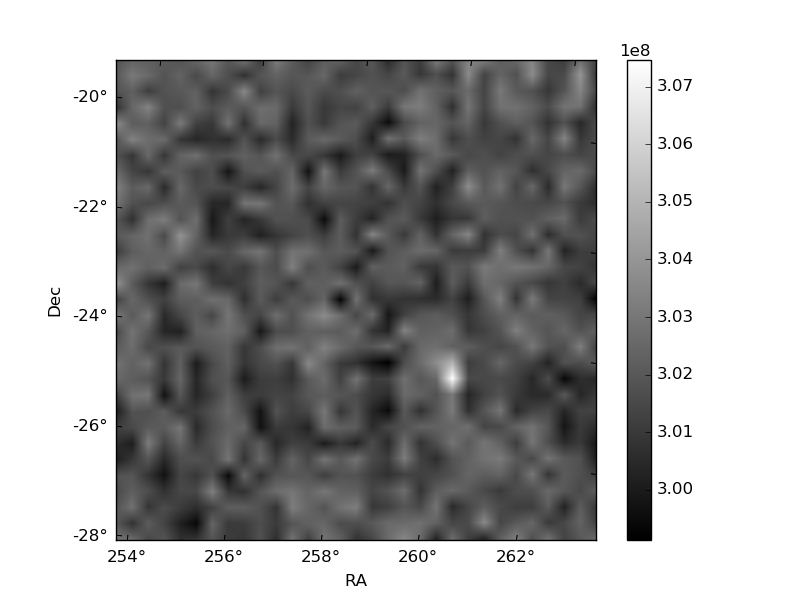
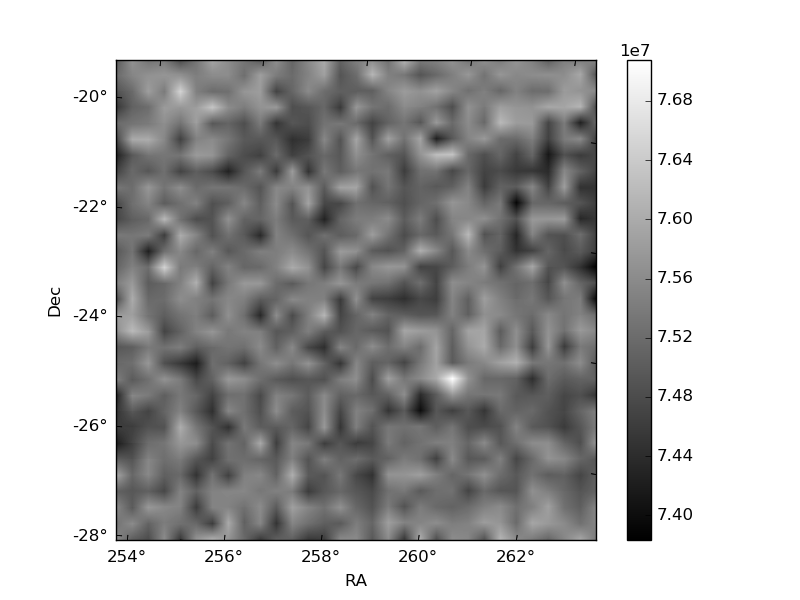
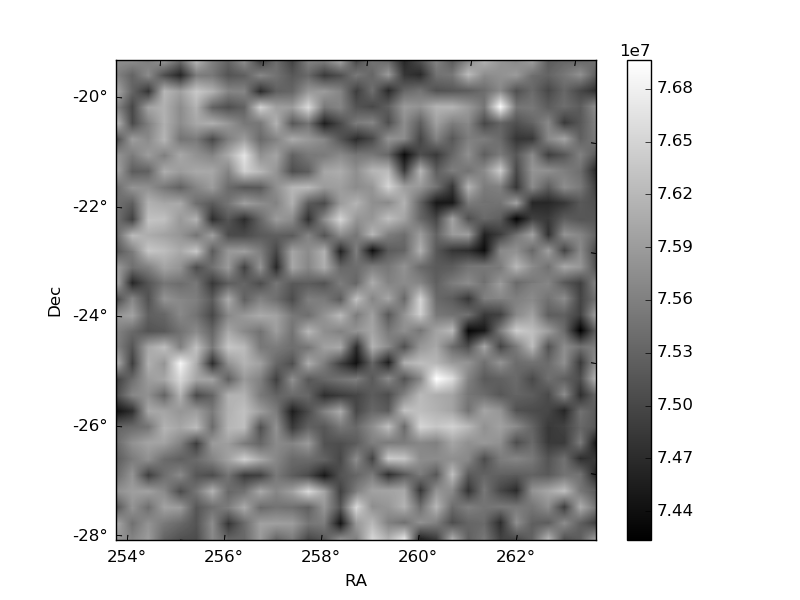
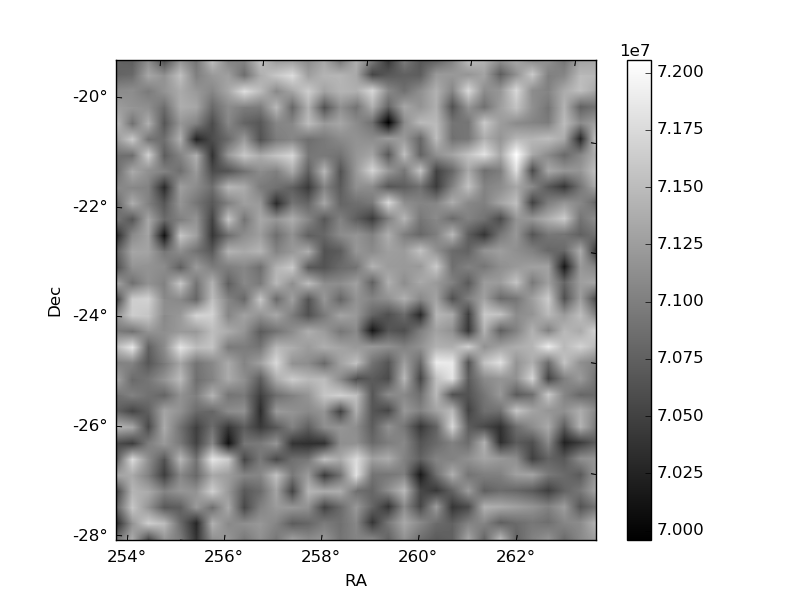
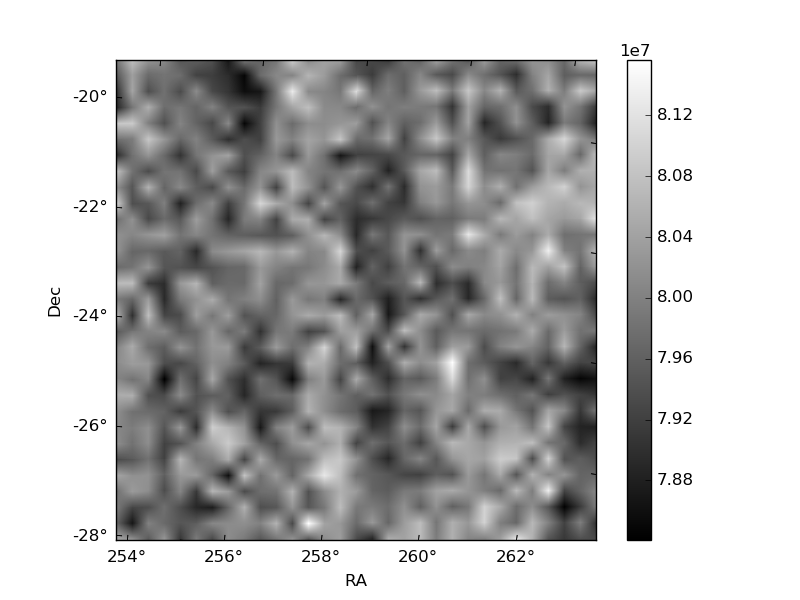
Histogram calculated using DETX and DETY for each event in the final _common_clean file
| Quadrant A | 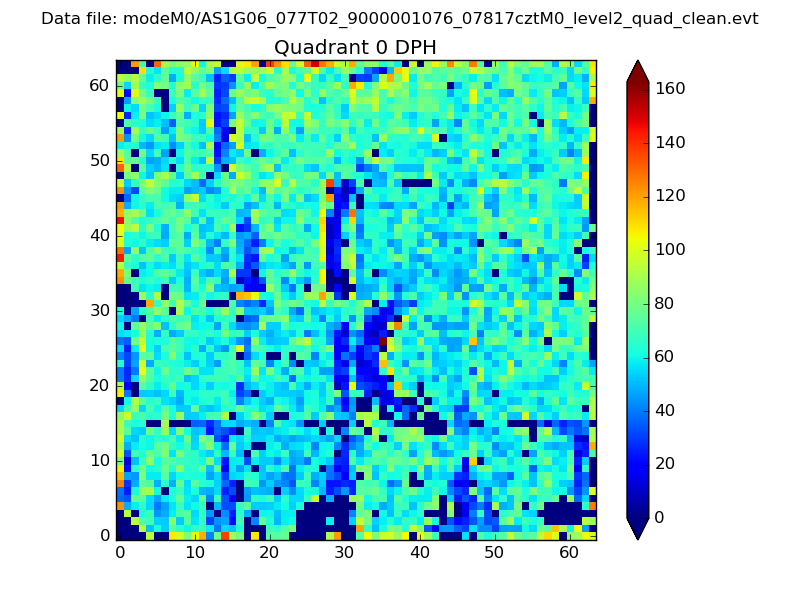 |
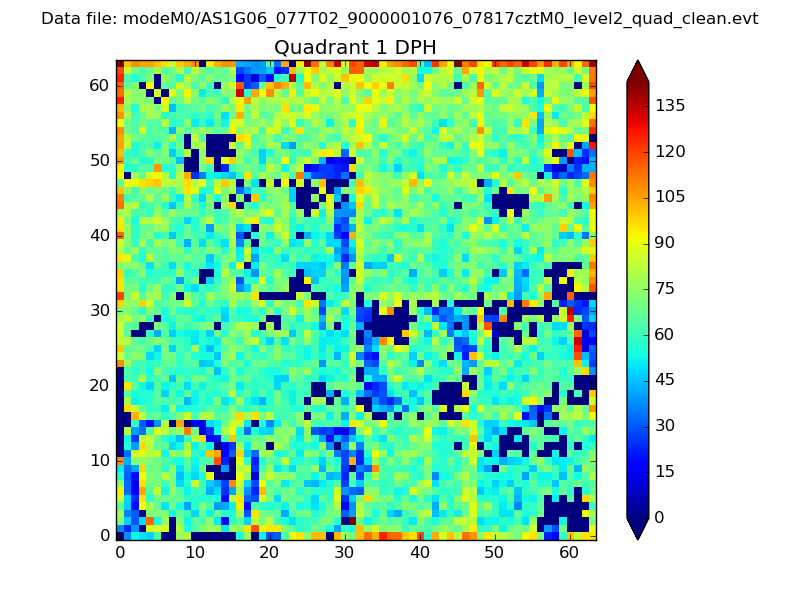 |
Quadrant B |
|---|---|---|---|
| Quadrant D | 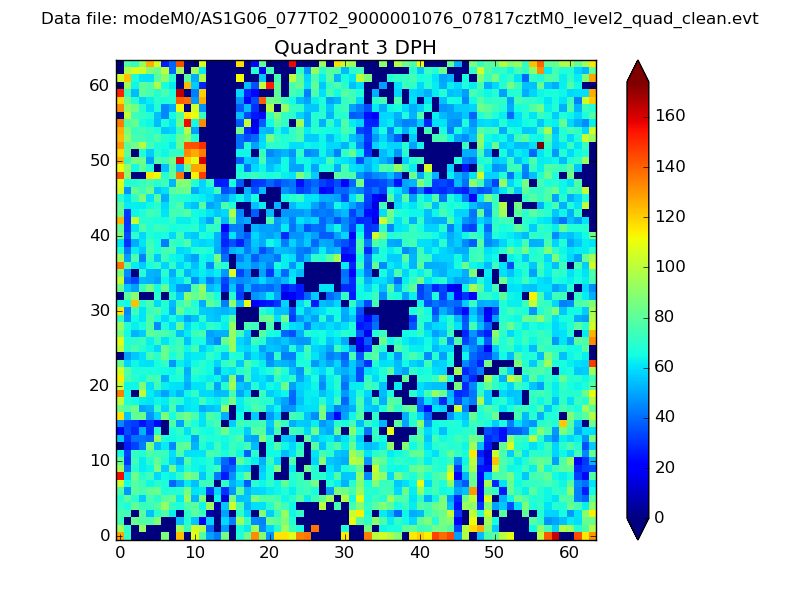 |
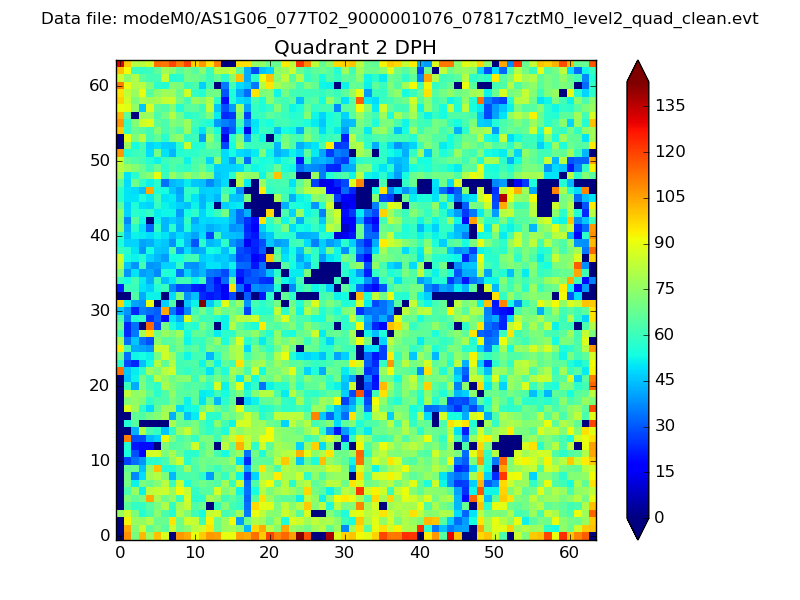 |
Quadrant C |
| Plot type | Count rate plots | Images |
|---|---|---|
| Comparison with Poisson distribution Blue bars denote a histogram of data divided into 1 sec bins. Red curve is a Poisson curve with rate = median count rate of data. |
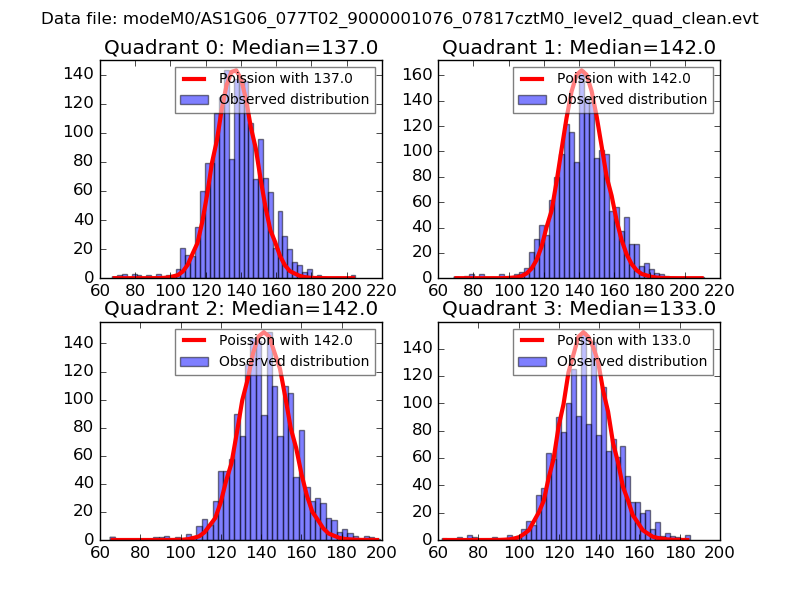 |
 |
| Quadrant-wise count rates Data is divided into 100 sec bins |
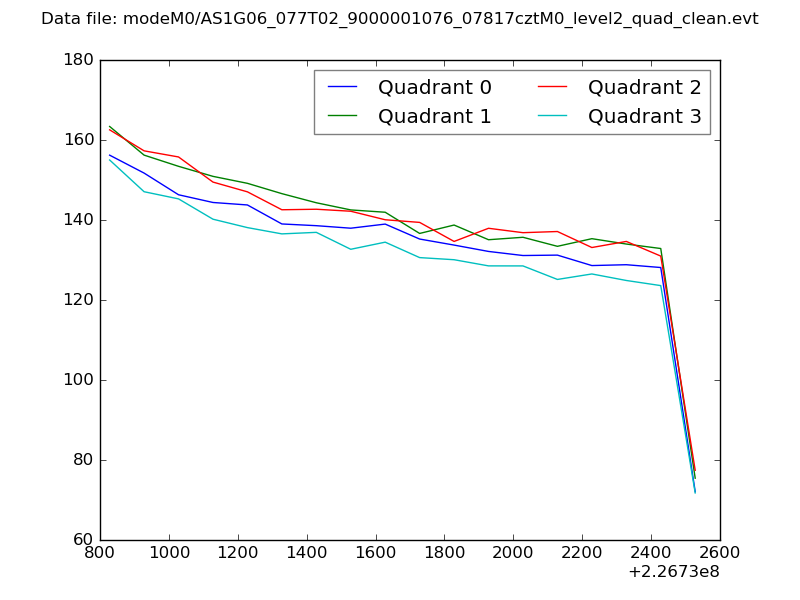 |
|
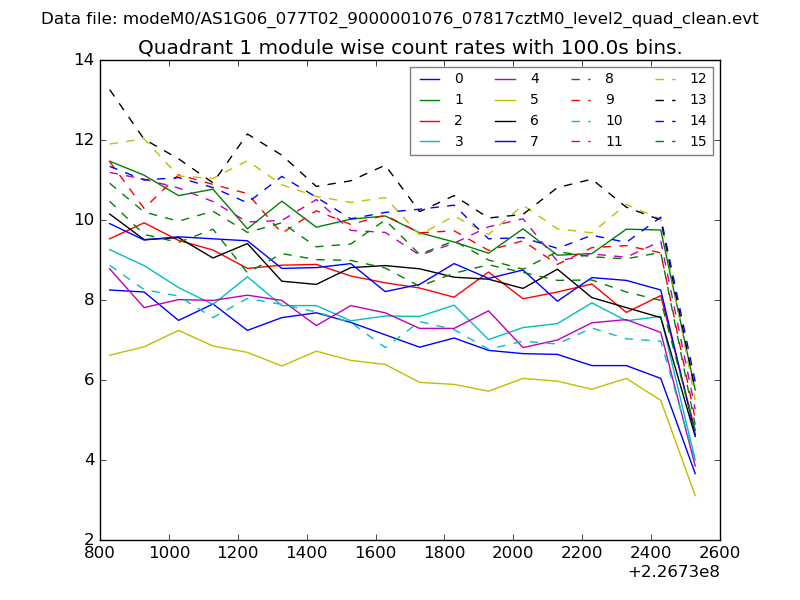
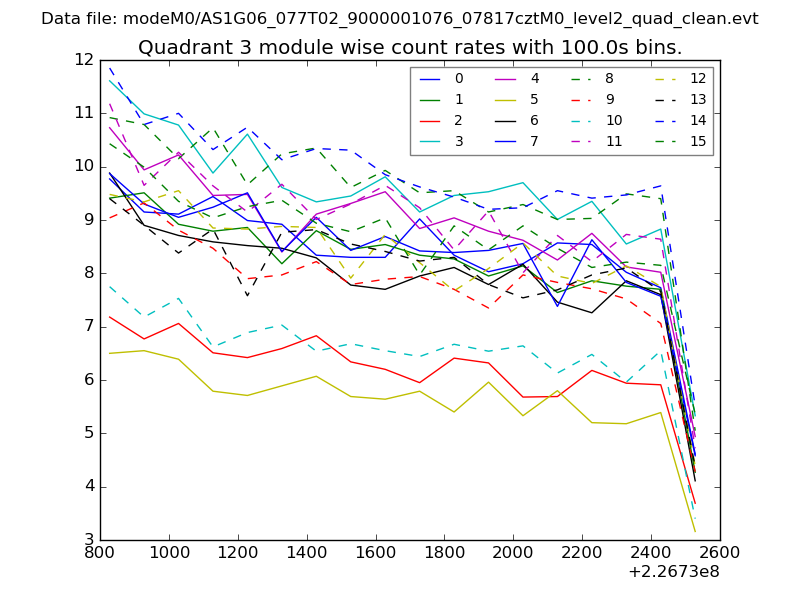
| Module-wise count rates for Quadrant A Data is divided into 100 sec bins |
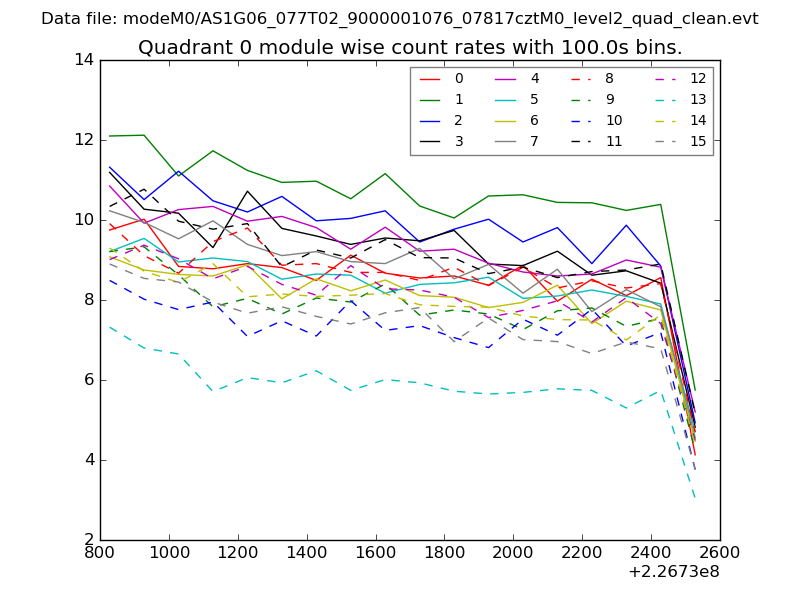 |
 |
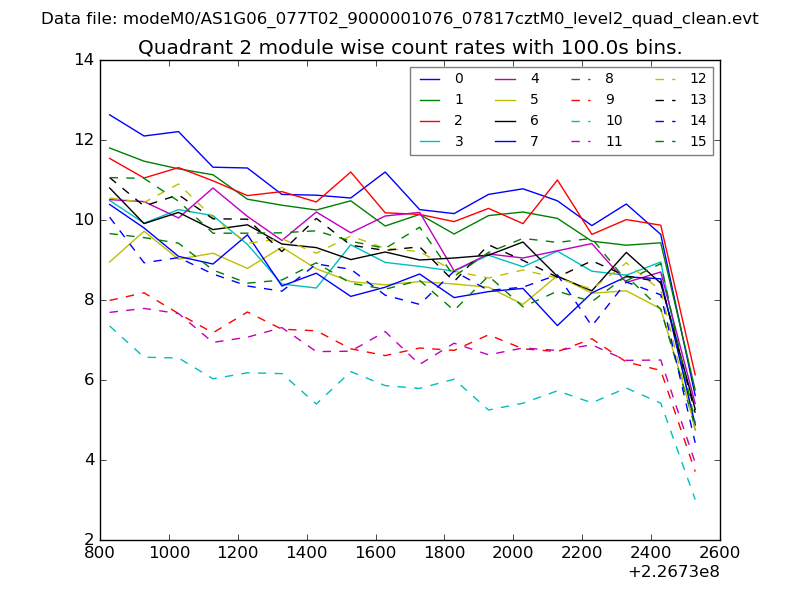
| Module-wise count rates for Quadrant B Data is divided into 100 sec bins |
 |
 |
| Module-wise count rates for Quadrant C Data is divided into 100 sec bins |
 |
 |
| Module-wise count rates for Quadrant D Data is divided into 100 sec bins |
 |
 |
| Parameter | Plot |
|---|---|
| CZT HV Monitor | 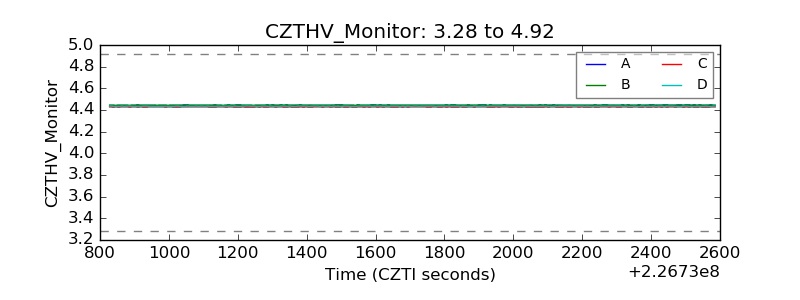 |
| D_VDD | 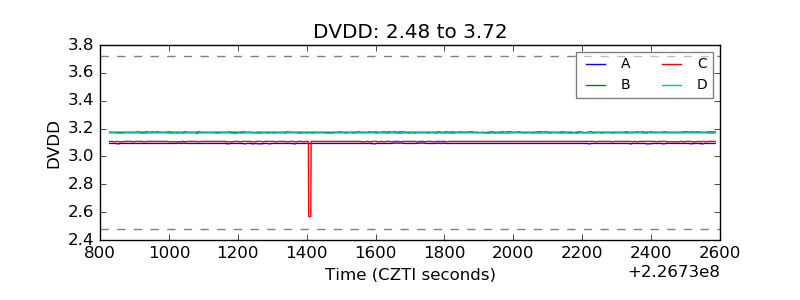 |
| Temperature 1 | 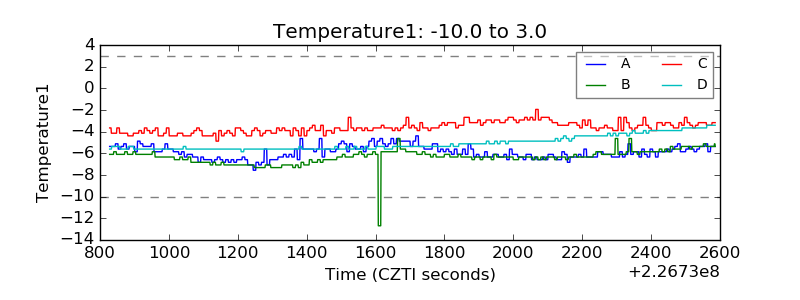 |
| Veto HV Monitor | 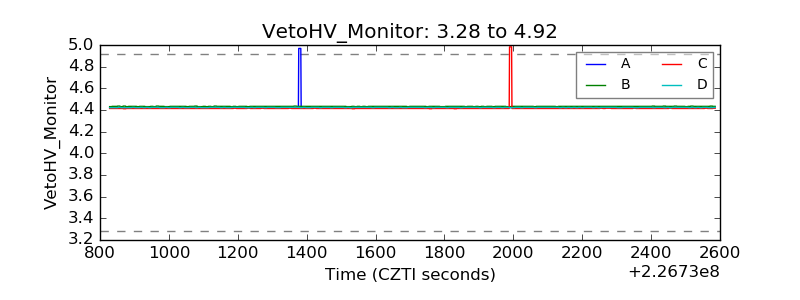 |
| Veto LLD | 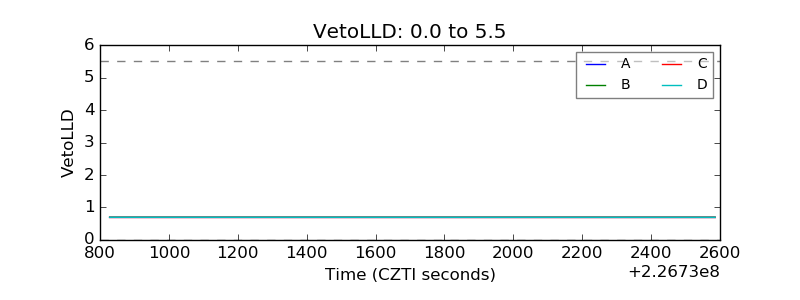 |
| Alpha Counter | 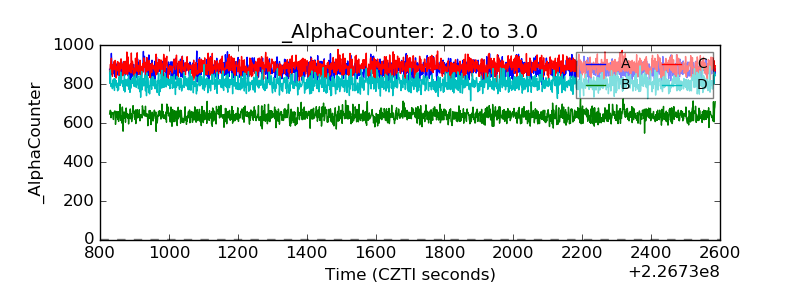 |
| _CPM_Rate | 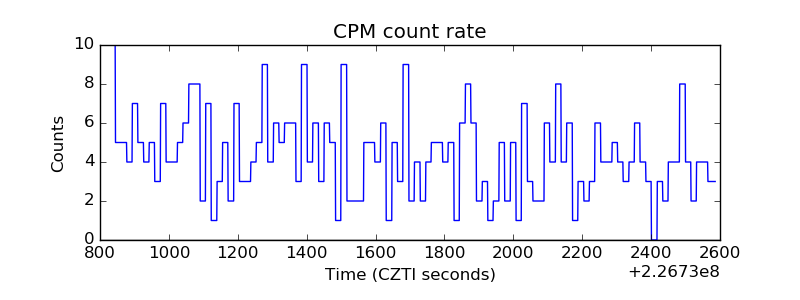 |
| CZT Counter | 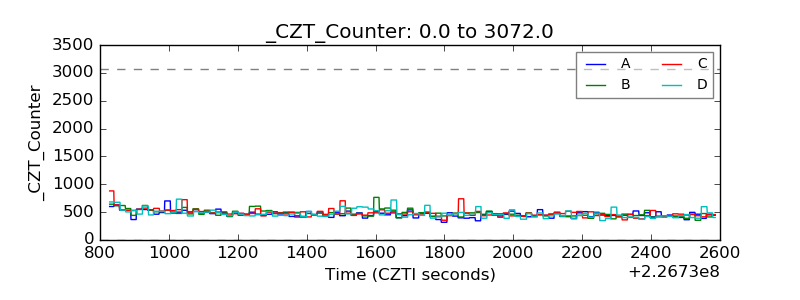 |
| +2.5 Volts monitor |  |
| +5 Volts monitor | 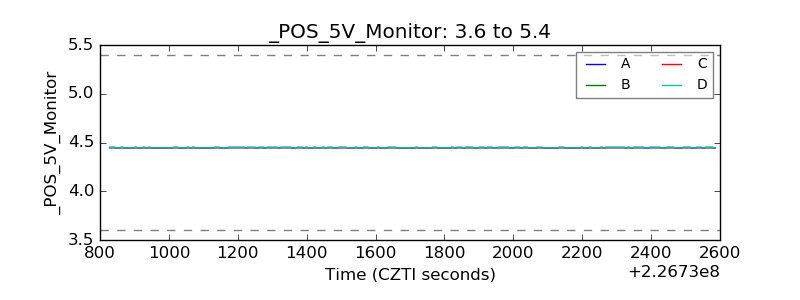 |
| _ROLL_ROT | 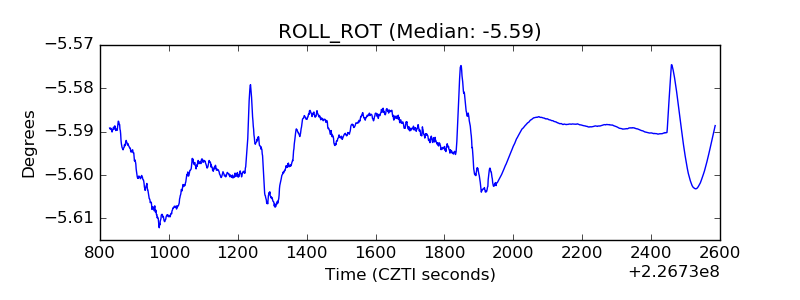 |
| _Roll_DEC | 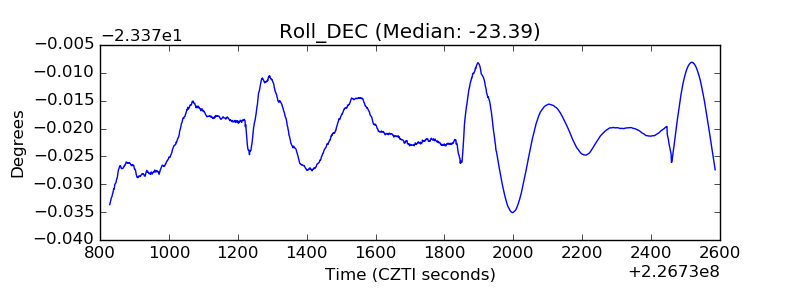 |
| _Roll_RA | 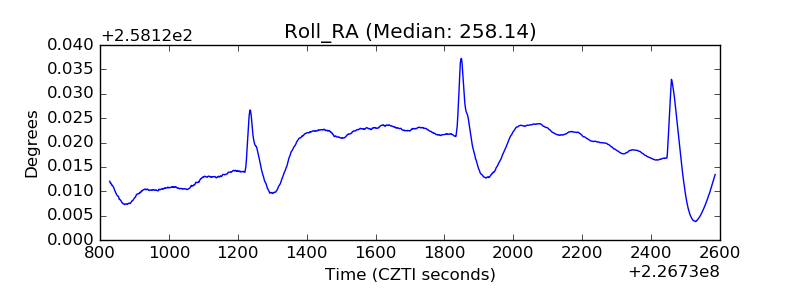 |
| Veto Counter | 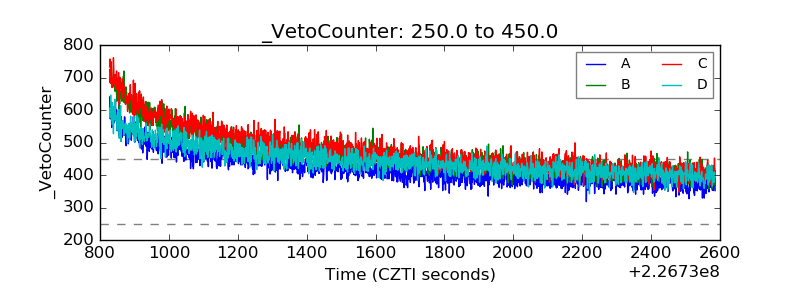 |