| Param | Original file | Final file |
|---|---|---|
| Filename | modeM0/AS1G06_077T02_9000001076_07819cztM0_level2.evt | modeM0/AS1G06_077T02_9000001076_07819cztM0_level2_quad_clean.evt |
| Size (bytes) | 482,636,160 | 83,361,600 |
| Size | 460.3 MB | 79.5 MB |
| Events in quadrant A | 3,057,221 | 516,590 |
| Events in quadrant B | 3,433,299 | 531,644 |
| Events in quadrant C | 3,767,018 | 514,909 |
| Events in quadrant D | 3,911,020 | 501,073 |
| Mode M9 | |||
|---|---|---|---|
| Quadrant | BADHDUFLAG | Total packets | Discarded packets |
| A | 0 | 4 | 0 |
| B | 0 | 4 | 0 |
| C | 0 | 4 | 0 |
| D | 0 | 4 | 0 |
| Mode M0 | |||
|---|---|---|---|
| Quadrant | BADHDUFLAG | Total packets | Discarded packets |
| A | 0 | 13578 | 2 |
| B | 0 | 14419 | 1 |
| C | 0 | 15677 | 3 |
| D | 0 | 16111 | 1 |
| Mode SS | |||
|---|---|---|---|
| Quadrant | BADHDUFLAG | Total packets | Discarded packets |
| A | 0 | 134 | 0 |
| B | 0 | 134 | 0 |
| C | 0 | 134 | 0 |
| D | 0 | 134 | 0 |
| Quadrant | Total seconds | Saturated seconds | Saturation percentage |
|---|---|---|---|
| A | 6594 | 139 | 2.107977% |
| B | 6594 | 195 | 2.957234% |
| C | 6593 | 302 | 4.580616% |
| D | 6594 | 213 | 3.230209% |
Noise dominated data is calculated using 1-second bins in cleaned event files. If a bin has >2000 counts, and if more than 50% of those come from <1% of pixels, then it is considered to be noise-dominated and hence unusable.
| Quadrant | # 1 sec bins | Bins with >0 counts | Bins with >2000 counts | High rate bins dominated by noise | Noise dominated (total time) | Noise dominated (detector-on time) | Marked lightcurve |
|---|---|---|---|---|---|---|---|
| A | 7059 | 6594 | 6 | 6 | 0.08% | 0.09% | 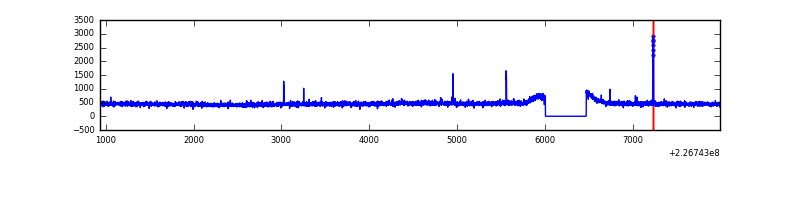 |
| B | 7059 | 6594 | 35 | 35 | 0.50% | 0.53% | 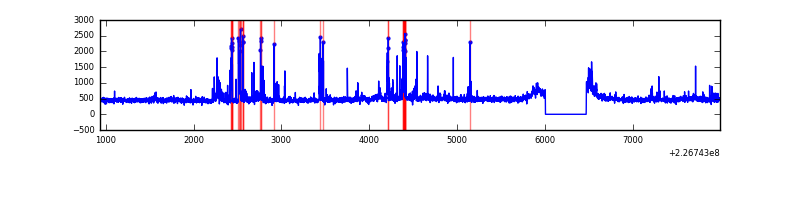 |
| C | 7059 | 6593 | 158 | 158 | 2.24% | 2.40% | 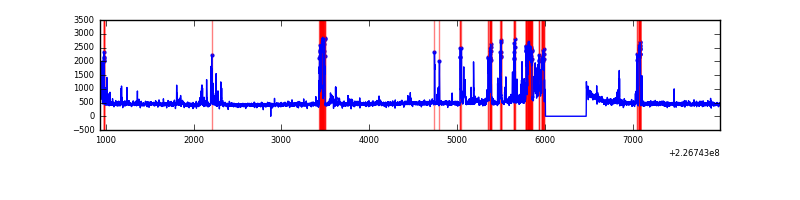 |
| D | 7059 | 6594 | 83 | 83 | 1.18% | 1.26% | 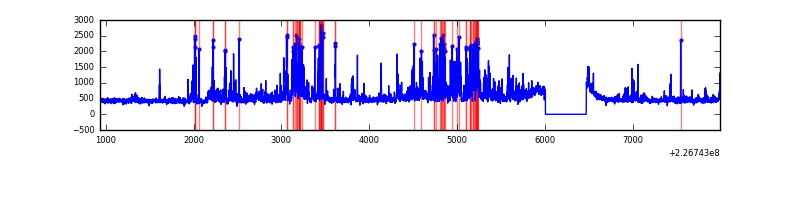 |
Top three noisy pixels from each quadrant. If the there are fewer than three noisy pixels in the level2.evt file, extra rows are filled as -1
| Pixel properties | Quadrant properties | ||||||
|---|---|---|---|---|---|---|---|
| Quadrant | DetID | PixID | Counts | Sigma | Mean | Median | Sigma |
| A | 0 | 128 | 36654 | 227.69 | 780 | 763 | 157.6 |
| A | 15 | 174 | 9549 | 55.74 | 780 | 763 | 157.6 |
| A | 0 | 226 | 7303 | 41.49 | 780 | 763 | 157.6 |
| B | 10 | 246 | 232313 | 1559.2 | 784 | 763 | 148.5 |
| B | 4 | 239 | 60976 | 405.46 | 784 | 763 | 148.5 |
| B | 0 | 219 | 50495 | 334.88 | 784 | 763 | 148.5 |
| C | 9 | 54 | 757153 | 4366.26 | 749 | 753 | 173.2 |
| C | 1 | 16 | 46020 | 261.3 | 749 | 753 | 173.2 |
| C | 14 | 234 | 33519 | 189.14 | 749 | 753 | 173.2 |
| D | 2 | 152 | 645460 | 3455.2 | 765 | 743 | 186.6 |
| D | 7 | 71 | 118012 | 628.47 | 765 | 743 | 186.6 |
| D | 5 | 233 | 67531 | 357.93 | 765 | 743 | 186.6 |
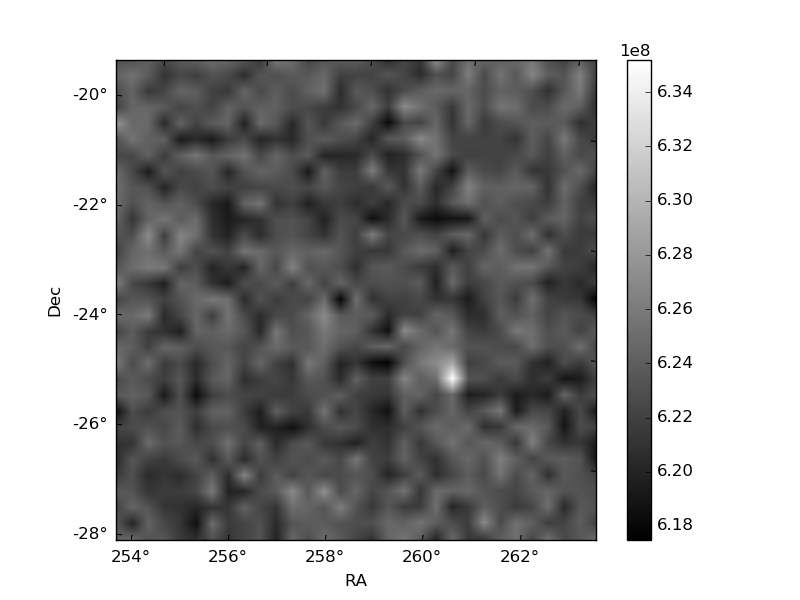
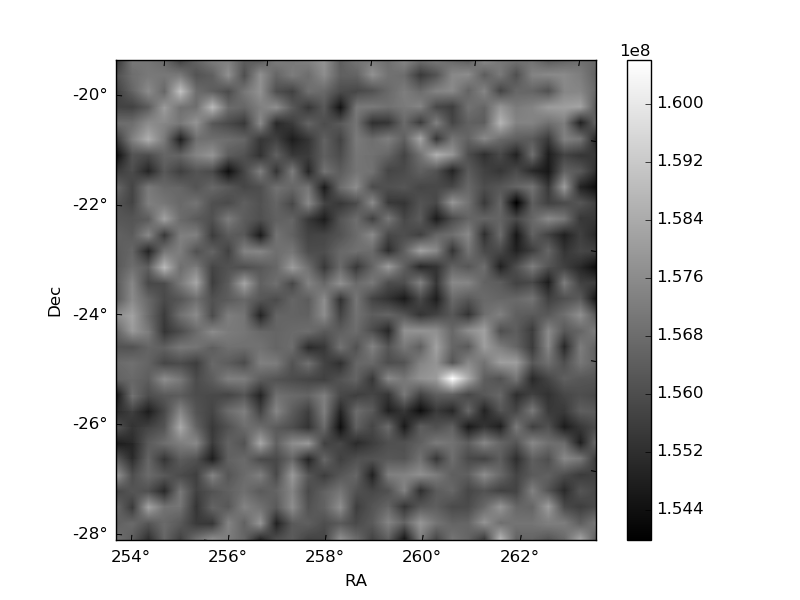
Histogram calculated using DETX and DETY for each event in the final _common_clean file
| Quadrant A | 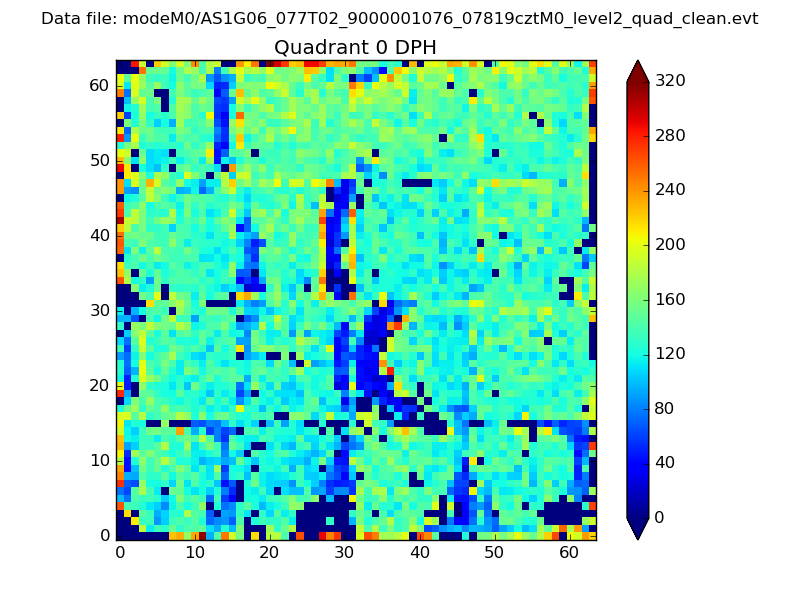 |
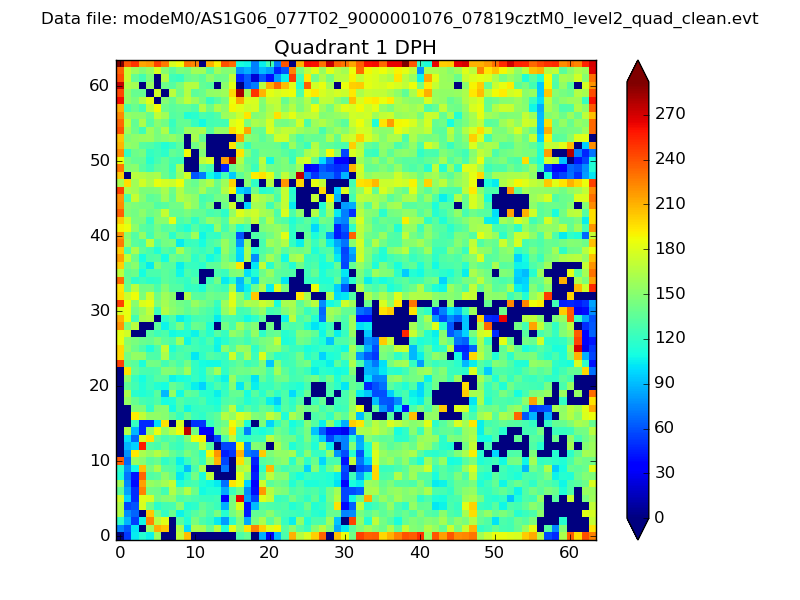 |
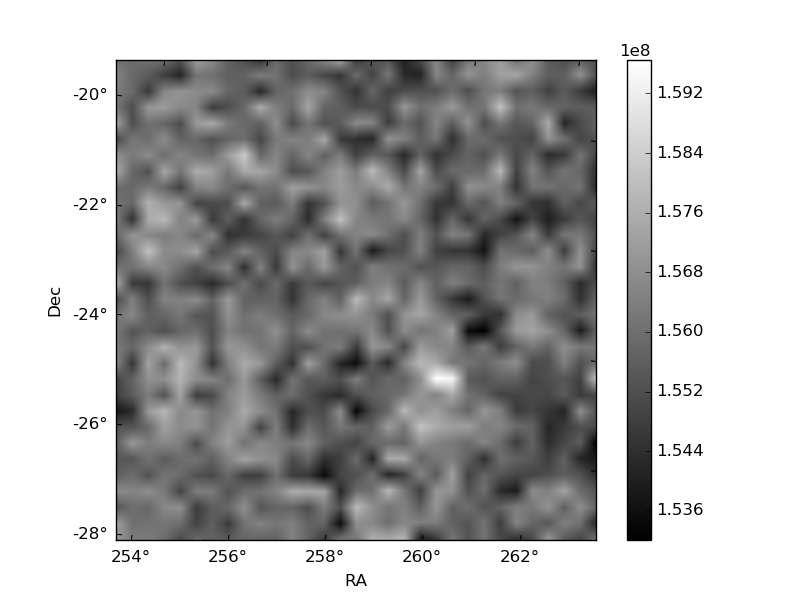
Quadrant B |
|---|---|---|---|
| Quadrant D | 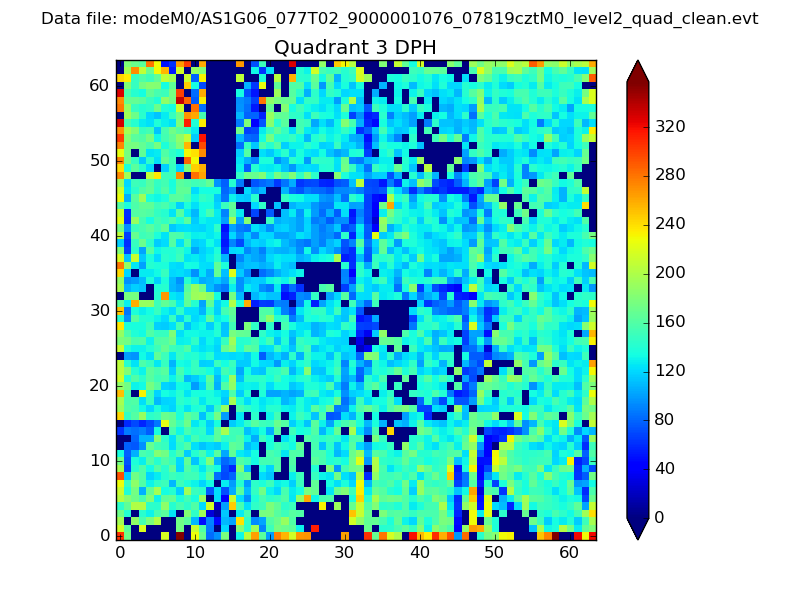 |
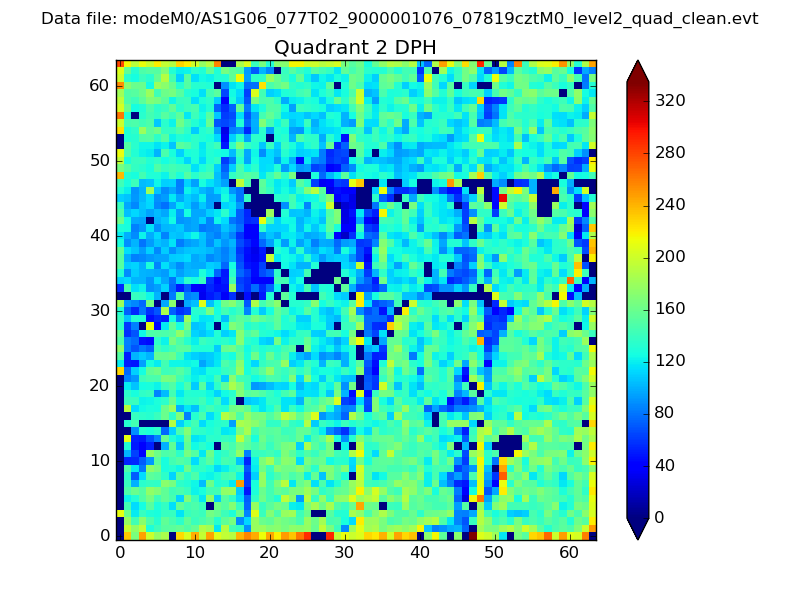 |
Quadrant C |
| Plot type | Count rate plots | Images |
|---|---|---|
| Comparison with Poisson distribution Blue bars denote a histogram of data divided into 1 sec bins. Red curve is a Poisson curve with rate = median count rate of data. |
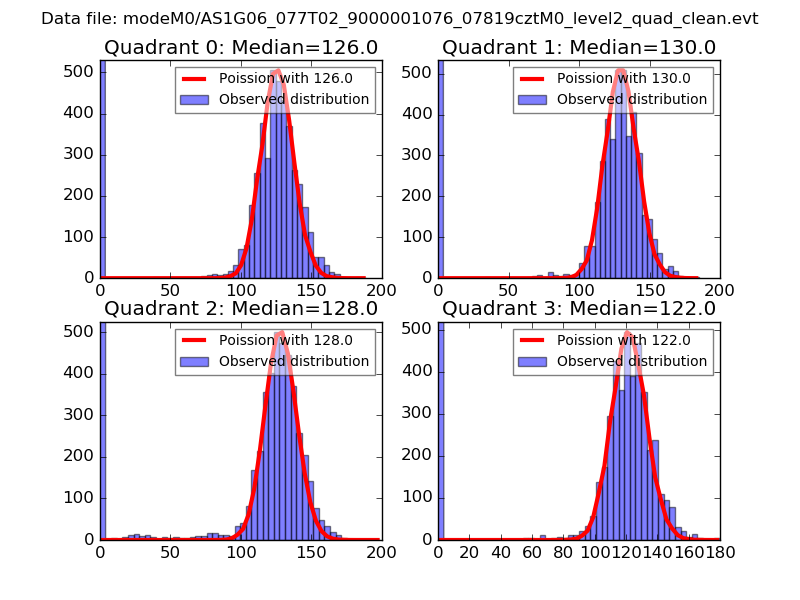 |
 |
| Quadrant-wise count rates Data is divided into 100 sec bins |
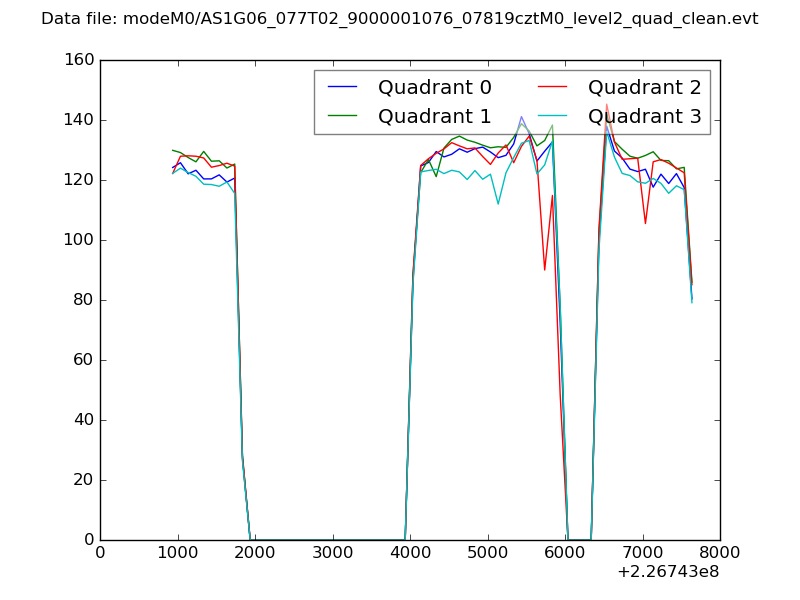 |
|
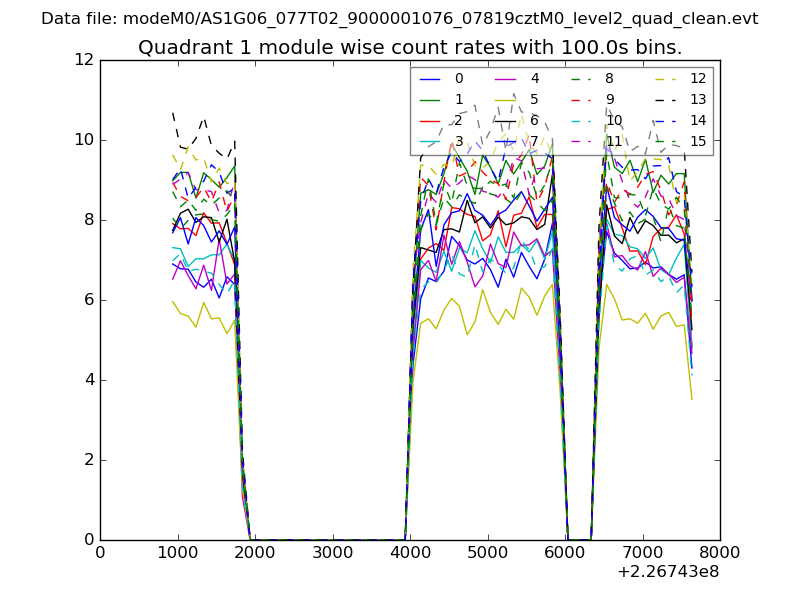
| Module-wise count rates for Quadrant A Data is divided into 100 sec bins |
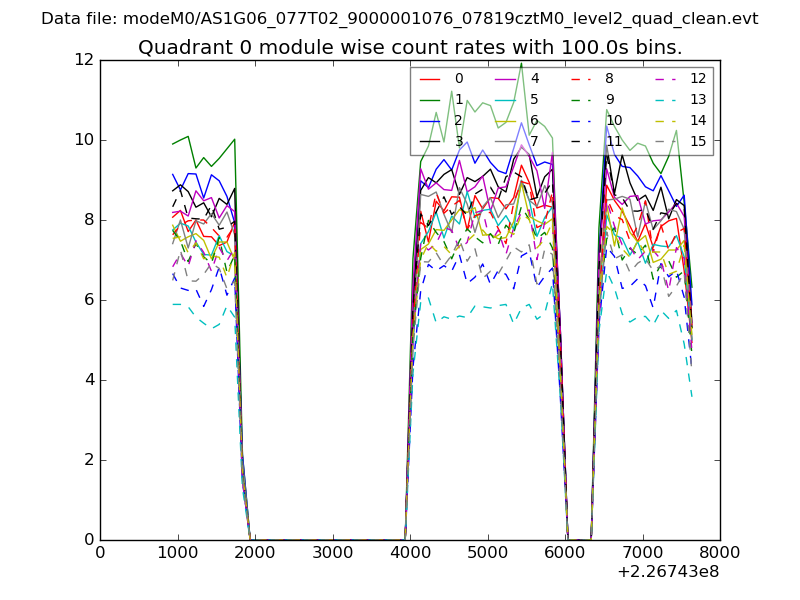 |
 |
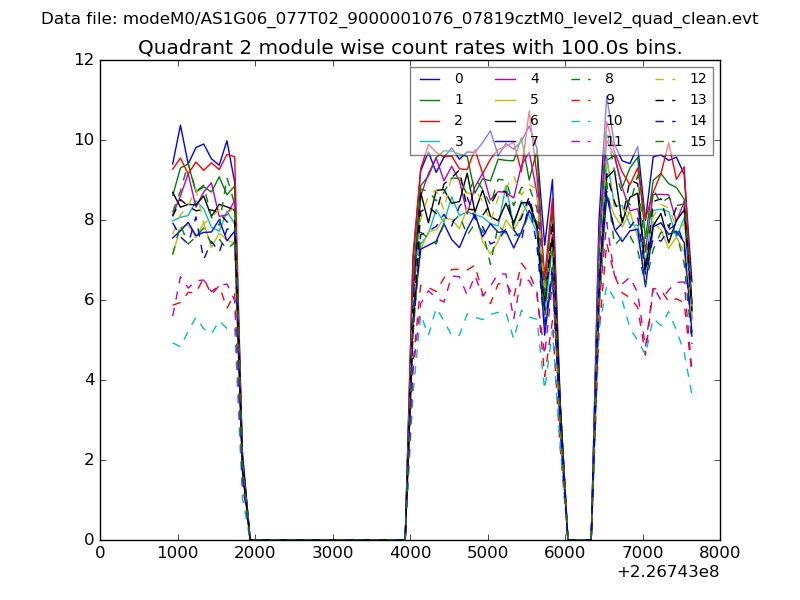
| Module-wise count rates for Quadrant B Data is divided into 100 sec bins |
 |
 |
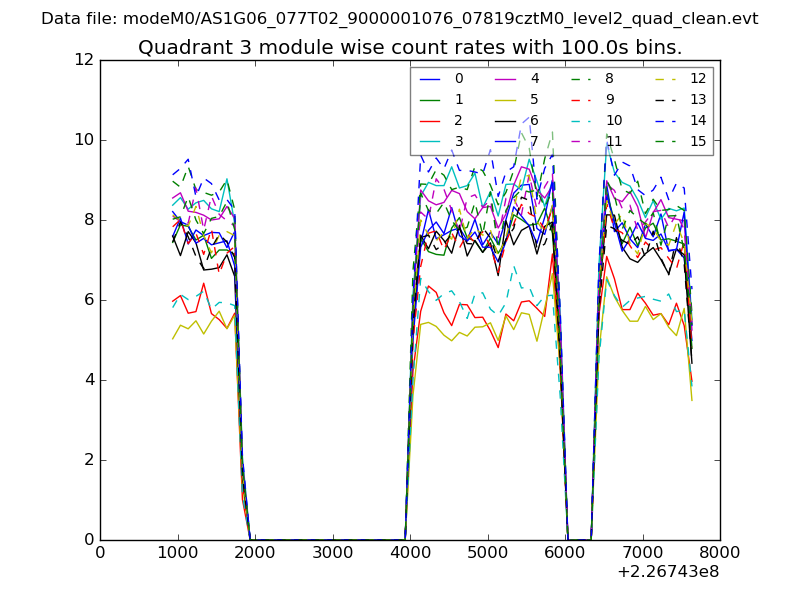
| Module-wise count rates for Quadrant C Data is divided into 100 sec bins |
 |
 |
| Module-wise count rates for Quadrant D Data is divided into 100 sec bins |
 |
 |
| Parameter | Plot |
|---|---|
| CZT HV Monitor | 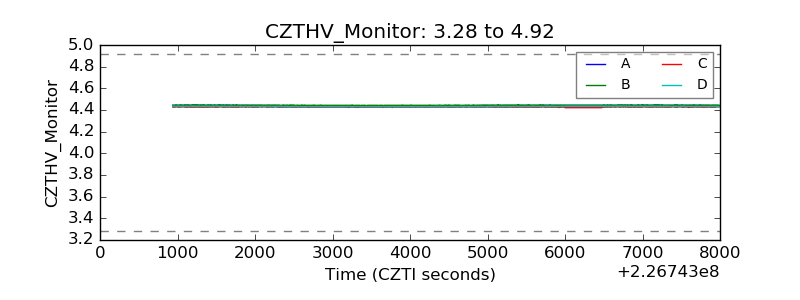 |
| D_VDD | 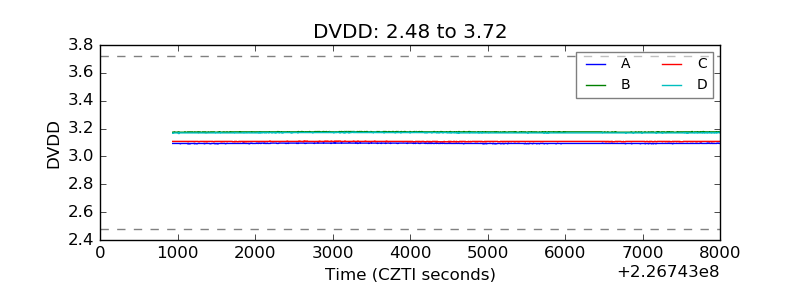 |
| Temperature 1 | 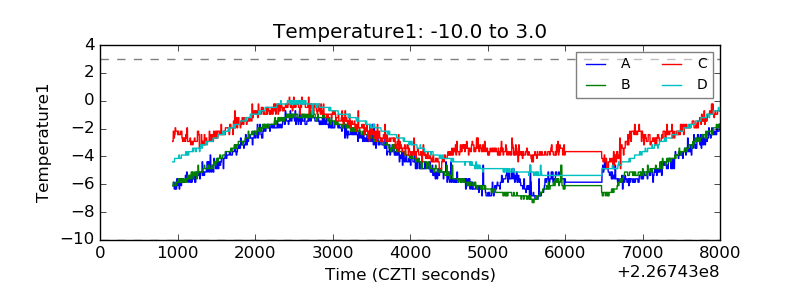 |
| Veto HV Monitor | 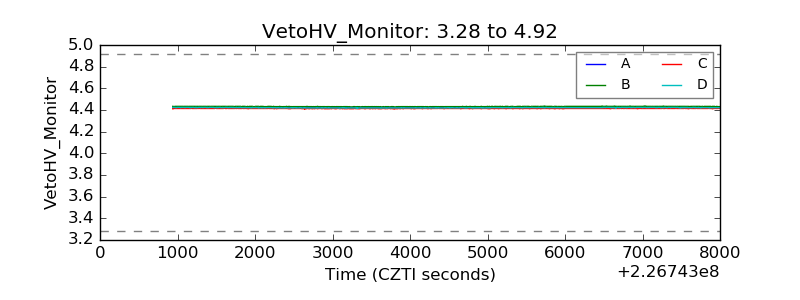 |
| Veto LLD | 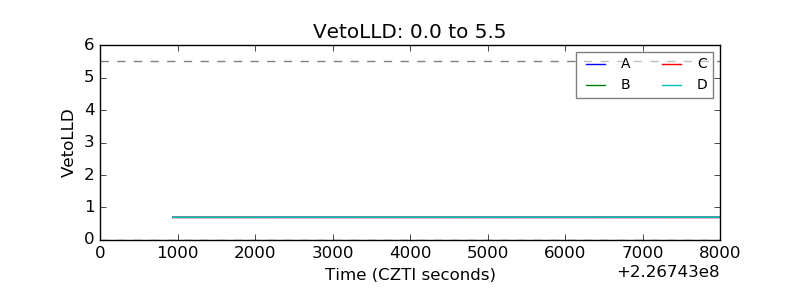 |
| Alpha Counter | 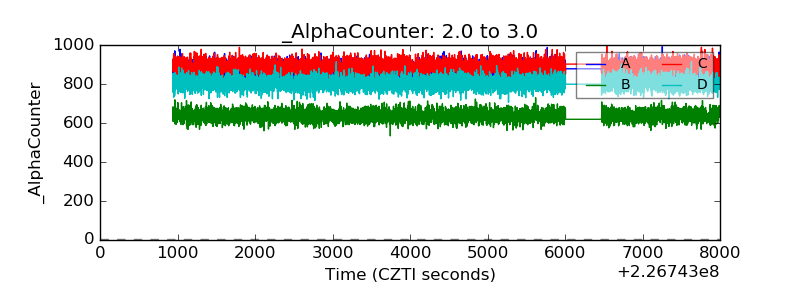 |
| _CPM_Rate | 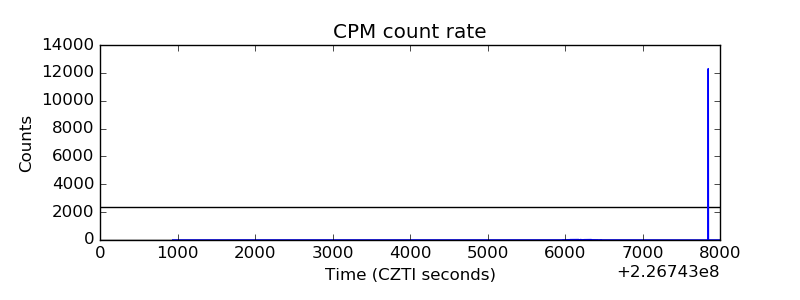 |
| CZT Counter | 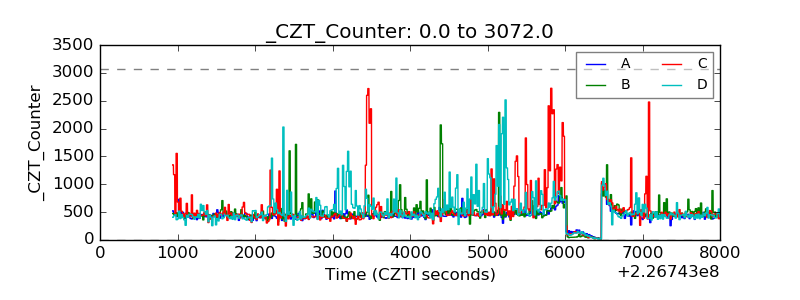 |
| +2.5 Volts monitor |  |
| +5 Volts monitor |  |
| _ROLL_ROT | 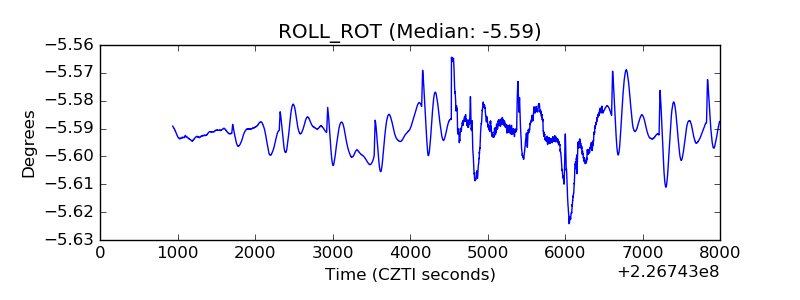 |
| _Roll_DEC | 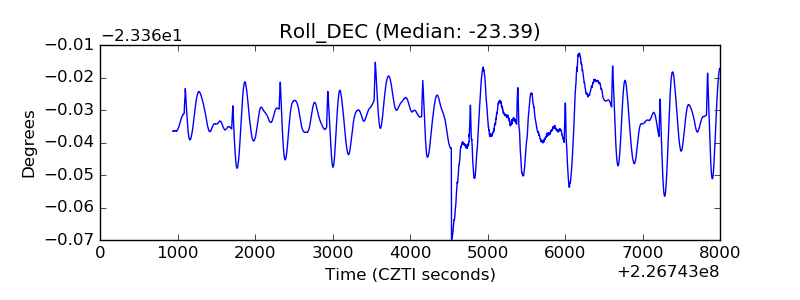 |
| _Roll_RA | 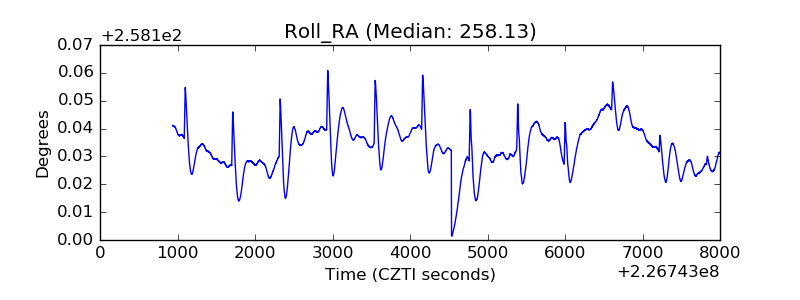 |
| Veto Counter | 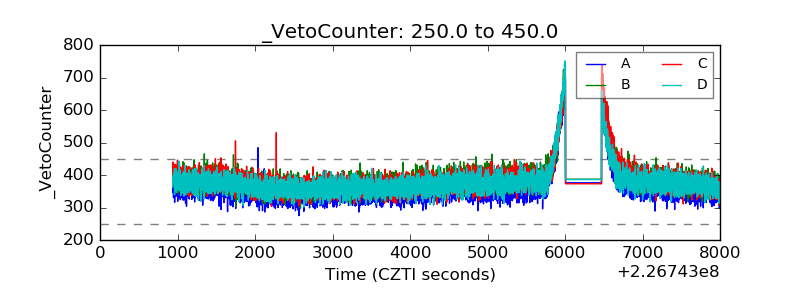 |