| Param | Original file | Final file |
|---|---|---|
| Filename | modeM0/AS1G06_077T02_9000001076_07820cztM0_level2.evt | modeM0/AS1G06_077T02_9000001076_07820cztM0_level2_quad_clean.evt |
| Size (bytes) | 555,615,360 | 93,435,840 |
| Size | 529.9 MB | 89.1 MB |
| Events in quadrant A | 3,717,767 | 565,480 |
| Events in quadrant B | 4,067,548 | 584,476 |
| Events in quadrant C | 3,919,966 | 585,637 |
| Events in quadrant D | 4,593,086 | 552,593 |
| Mode M0 | |||
|---|---|---|---|
| Quadrant | BADHDUFLAG | Total packets | Discarded packets |
| A | 0 | 16522 | 128 |
| B | 0 | 17228 | 174 |
| C | 0 | 17082 | 131 |
| D | 0 | 19090 | 182 |
| Mode SS | |||
|---|---|---|---|
| Quadrant | BADHDUFLAG | Total packets | Discarded packets |
| A | 0 | 158 | 2 |
| B | 0 | 158 | 0 |
| C | 0 | 158 | 0 |
| D | 0 | 158 | 0 |
| Quadrant | Total seconds | Saturated seconds | Saturation percentage |
|---|---|---|---|
| A | 7775 | 339 | 4.360129% |
| B | 7768 | 357 | 4.595778% |
| C | 7777 | 288 | 3.703227% |
| D | 7765 | 477 | 6.142949% |
Noise dominated data is calculated using 1-second bins in cleaned event files. If a bin has >2000 counts, and if more than 50% of those come from <1% of pixels, then it is considered to be noise-dominated and hence unusable.
| Quadrant | # 1 sec bins | Bins with >0 counts | Bins with >2000 counts | High rate bins dominated by noise | Noise dominated (total time) | Noise dominated (detector-on time) | Marked lightcurve |
|---|---|---|---|---|---|---|---|
| A | 7838 | 7806 | 6 | 6 | 0.08% | 0.08% | 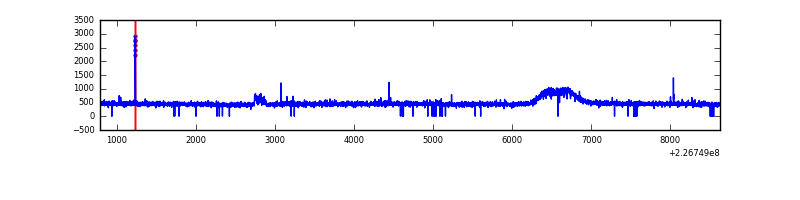 |
| B | 7838 | 7803 | 17 | 17 | 0.22% | 0.22% | 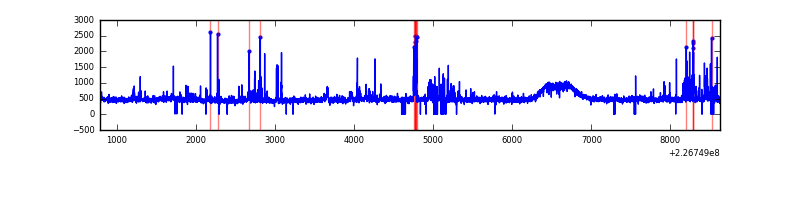 |
| C | 7839 | 7808 | 38 | 38 | 0.48% | 0.49% | 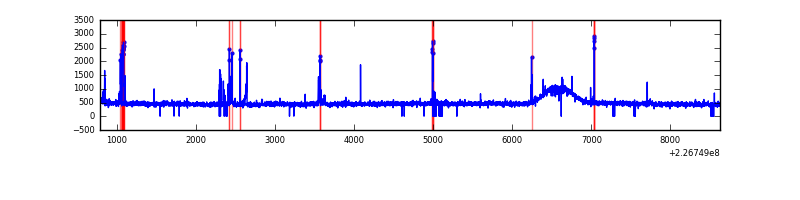 |
| D | 7839 | 7809 | 142 | 142 | 1.81% | 1.82% | 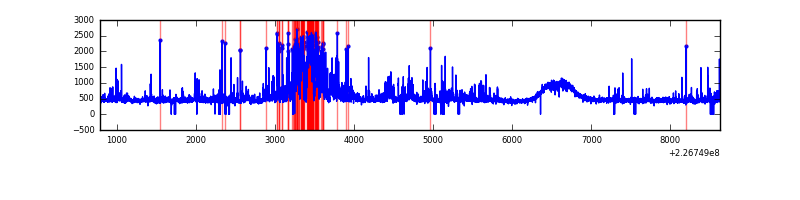 |
Top three noisy pixels from each quadrant. If the there are fewer than three noisy pixels in the level2.evt file, extra rows are filled as -1
| Pixel properties | Quadrant properties | ||||||
|---|---|---|---|---|---|---|---|
| Quadrant | DetID | PixID | Counts | Sigma | Mean | Median | Sigma |
| A | 0 | 128 | 51477 | 259.15 | 945 | 924 | 195.1 |
| A | 13 | 14 | 15639 | 75.43 | 945 | 924 | 195.1 |
| A | 0 | 226 | 8760 | 40.17 | 945 | 924 | 195.1 |
| B | 10 | 246 | 191493 | 1038.87 | 951 | 928 | 183.4 |
| B | 4 | 239 | 70853 | 381.2 | 951 | 928 | 183.4 |
| B | 0 | 219 | 65675 | 352.97 | 951 | 928 | 183.4 |
| C | 9 | 54 | 235270 | 1082.97 | 932 | 934 | 216.4 |
| C | 1 | 16 | 35872 | 161.46 | 932 | 934 | 216.4 |
| C | 12 | 4 | 9725 | 40.63 | 932 | 934 | 216.4 |
| D | 5 | 233 | 380832 | 1675.71 | 923 | 898 | 226.7 |
| D | 2 | 152 | 259526 | 1140.69 | 923 | 898 | 226.7 |
| D | 13 | 104 | 209151 | 918.51 | 923 | 898 | 226.7 |
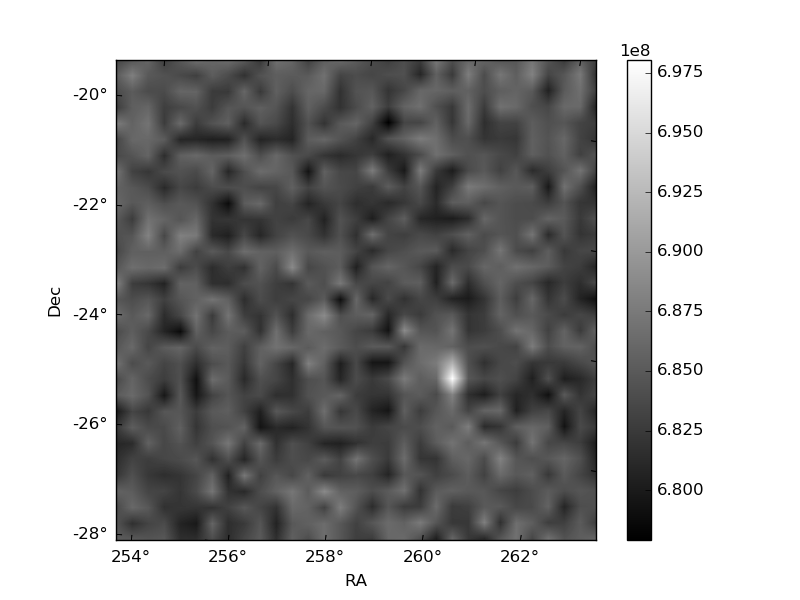
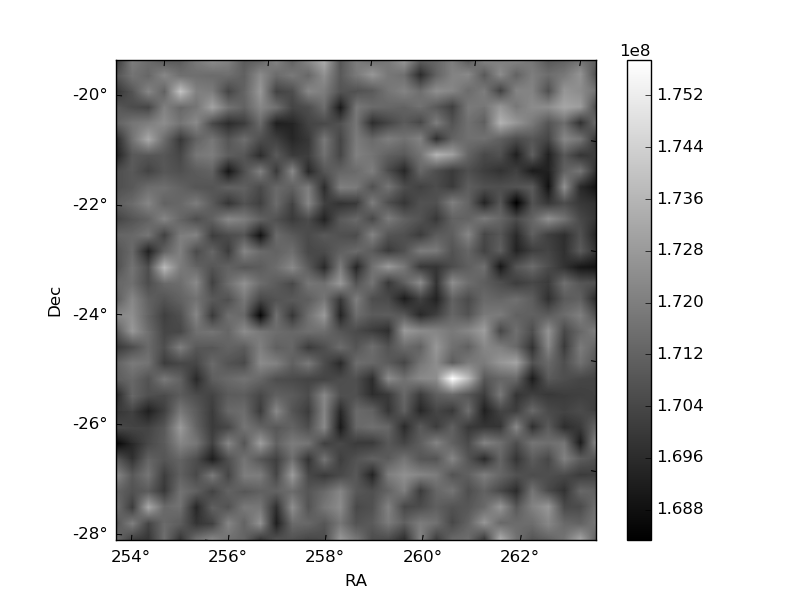
Histogram calculated using DETX and DETY for each event in the final _common_clean file
| Quadrant A | 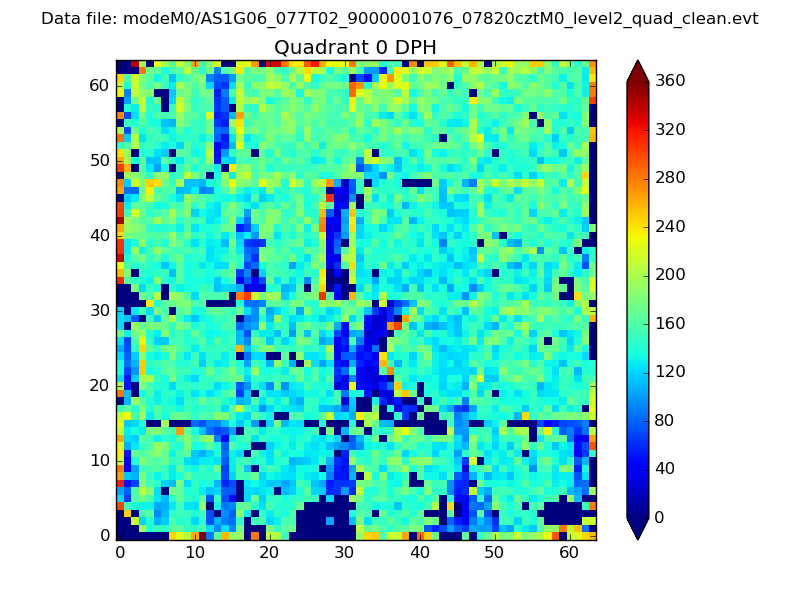 |
 |
Quadrant B |
|---|---|---|---|
| Quadrant D | 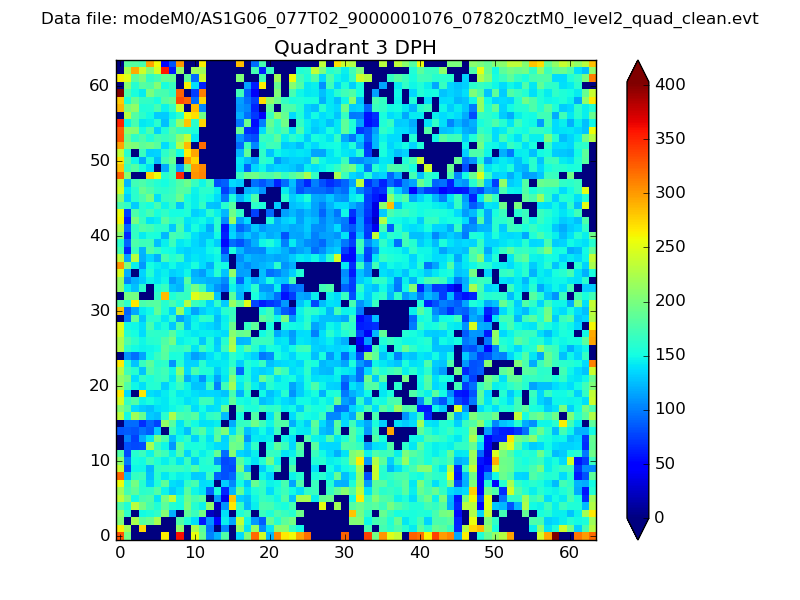 |
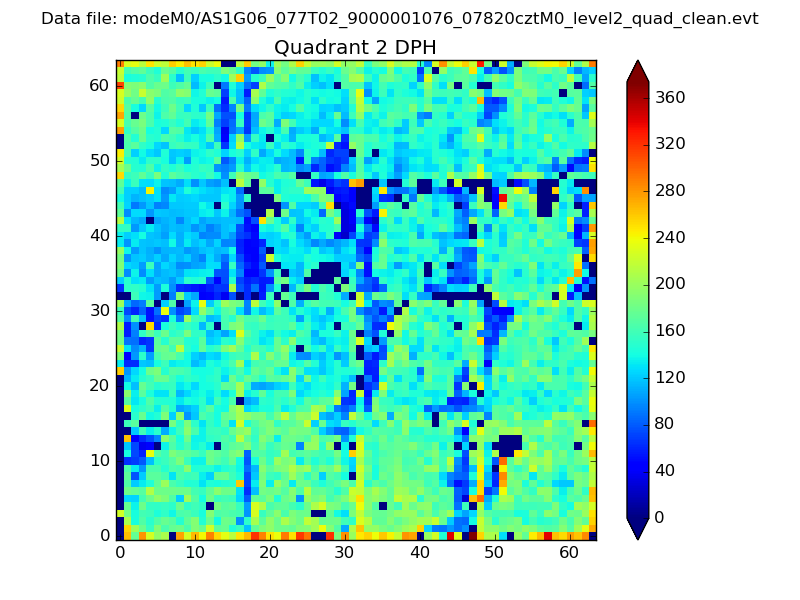 |
Quadrant C |
| Plot type | Count rate plots | Images |
|---|---|---|
| Comparison with Poisson distribution Blue bars denote a histogram of data divided into 1 sec bins. Red curve is a Poisson curve with rate = median count rate of data. |
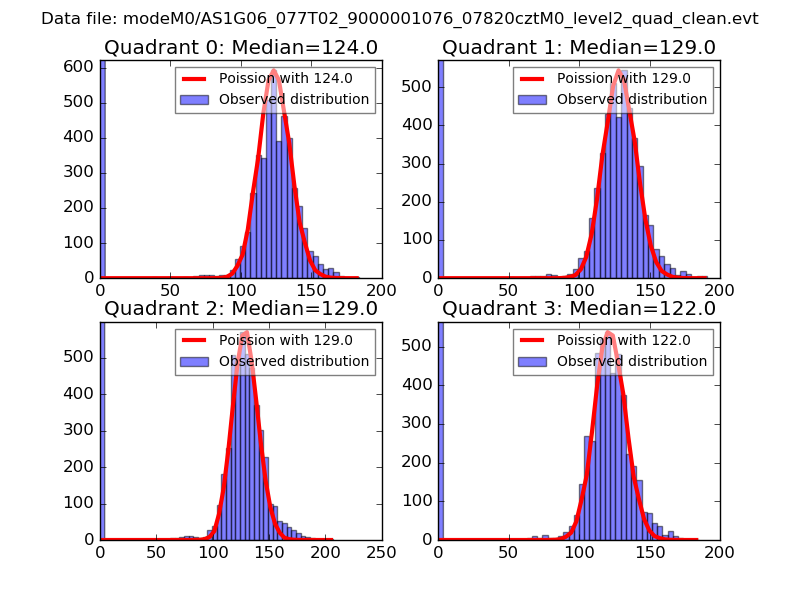 |
 |
| Quadrant-wise count rates Data is divided into 100 sec bins |
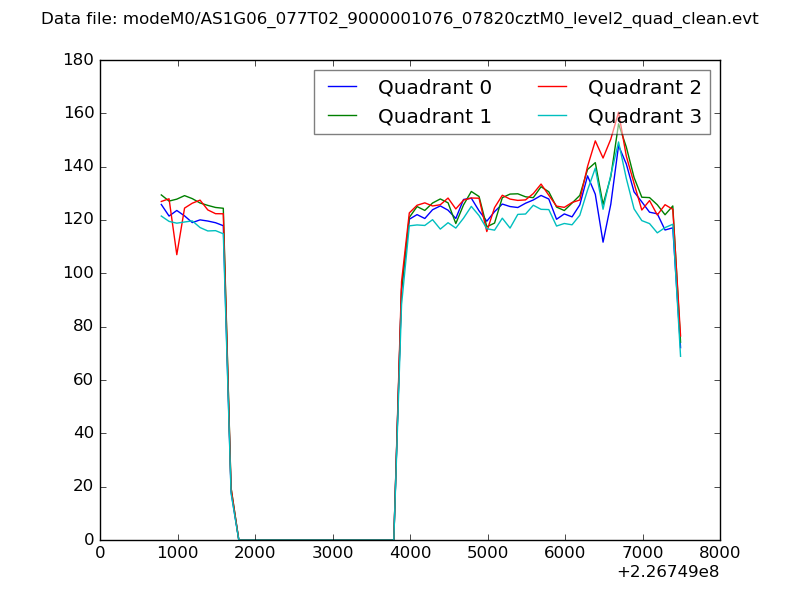 |
|
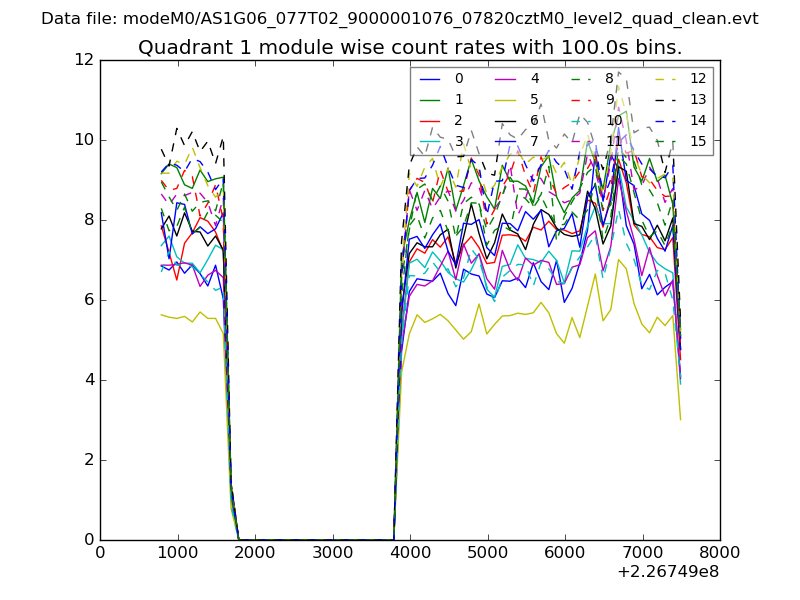
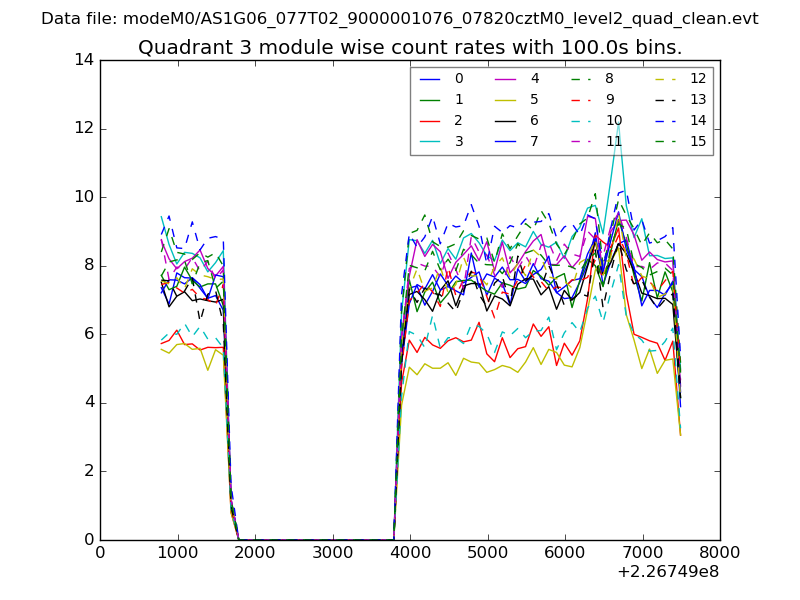
| Module-wise count rates for Quadrant A Data is divided into 100 sec bins |
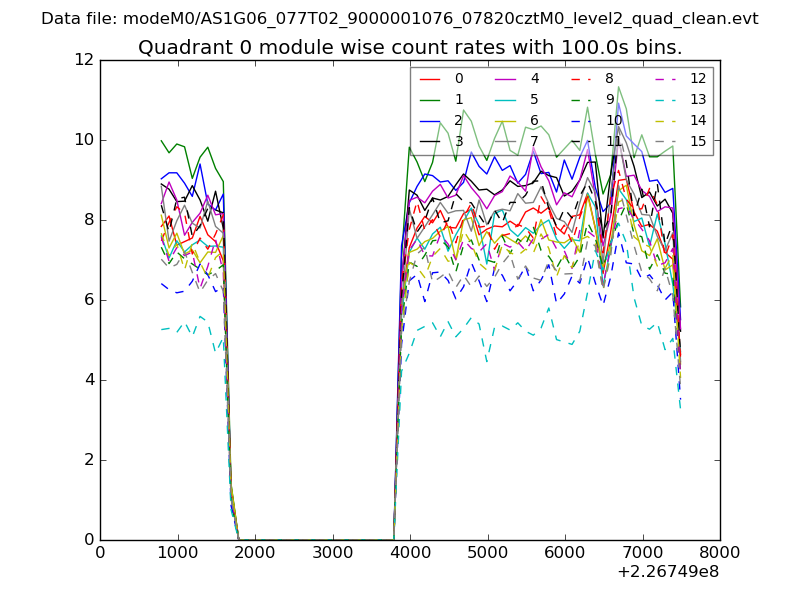 |
 |
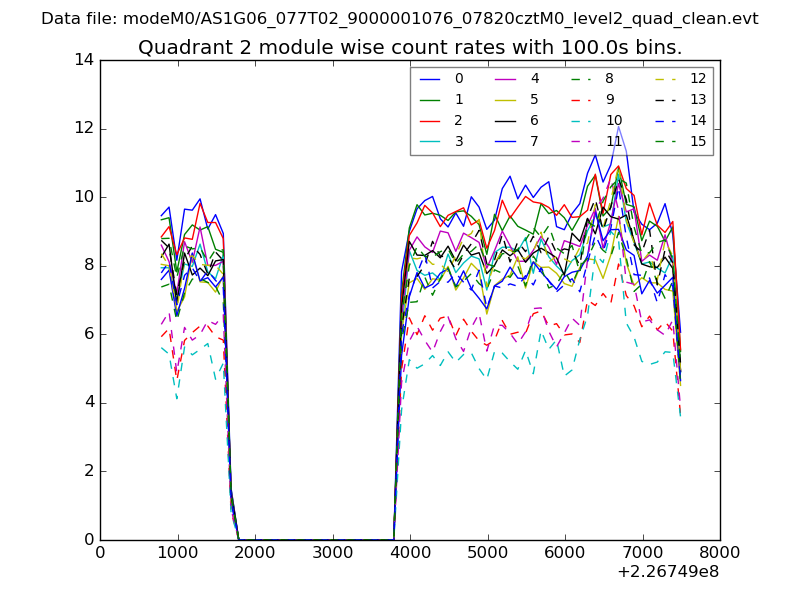
| Module-wise count rates for Quadrant B Data is divided into 100 sec bins |
 |
 |
| Module-wise count rates for Quadrant C Data is divided into 100 sec bins |
 |
 |
| Module-wise count rates for Quadrant D Data is divided into 100 sec bins |
 |
 |
| Parameter | Plot |
|---|---|
| CZT HV Monitor | 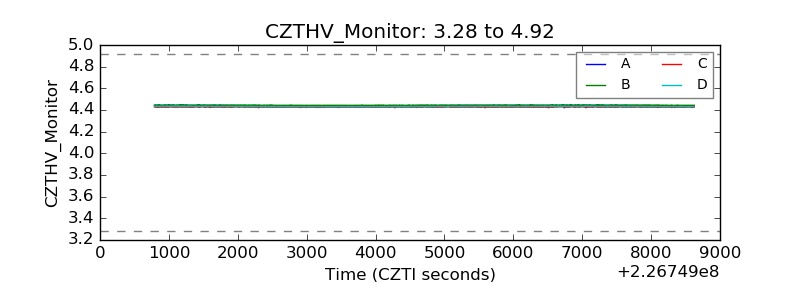 |
| D_VDD | 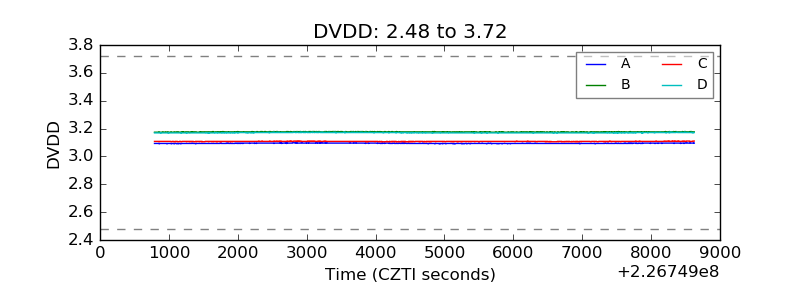 |
| Temperature 1 | 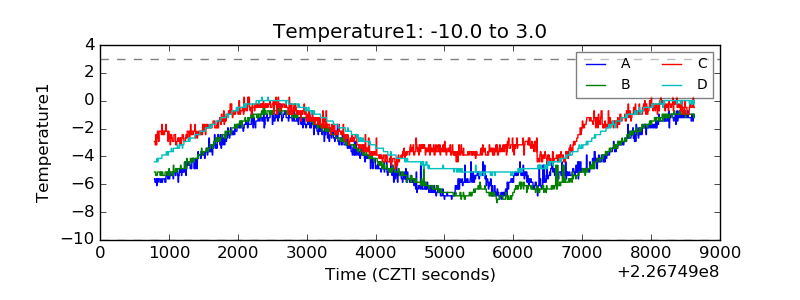 |
| Veto HV Monitor | 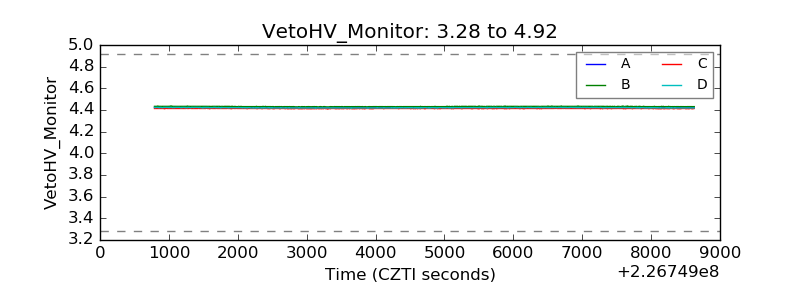 |
| Veto LLD | 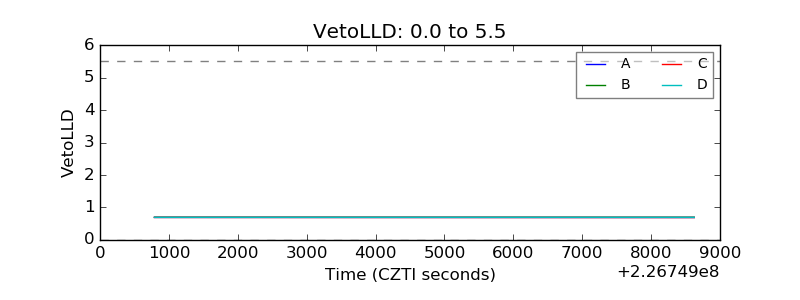 |
| Alpha Counter | 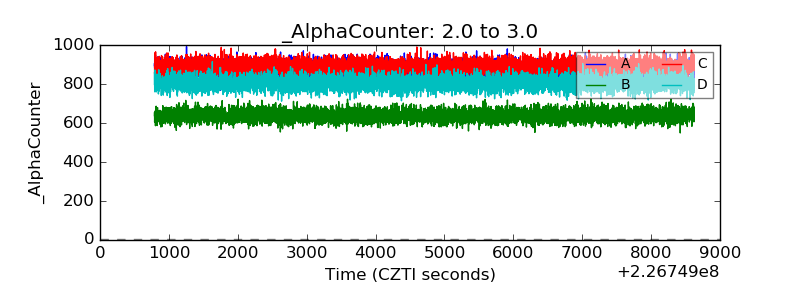 |
| _CPM_Rate | 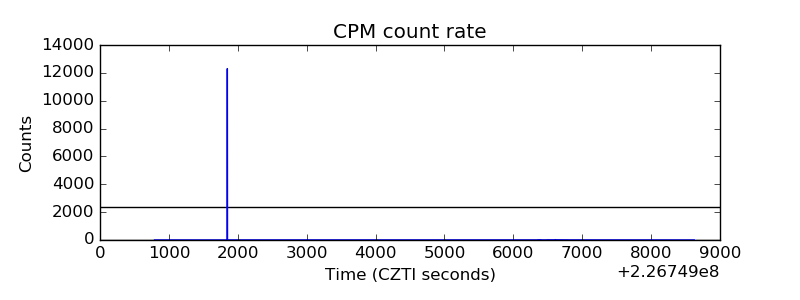 |
| CZT Counter | 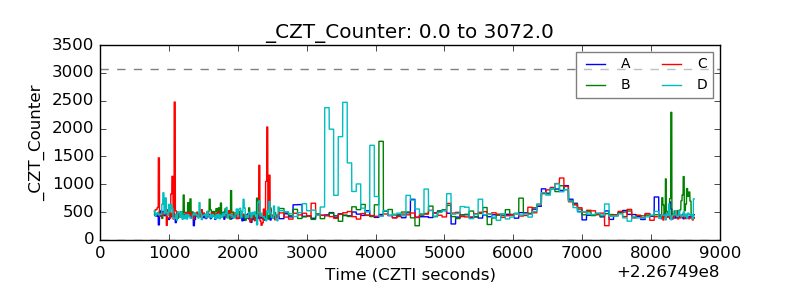 |
| +2.5 Volts monitor |  |
| +5 Volts monitor | 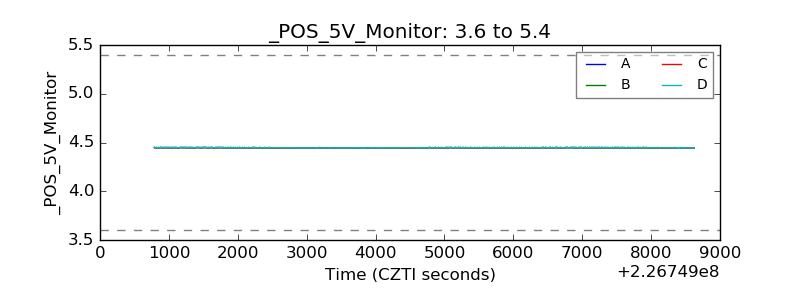 |
| _ROLL_ROT | 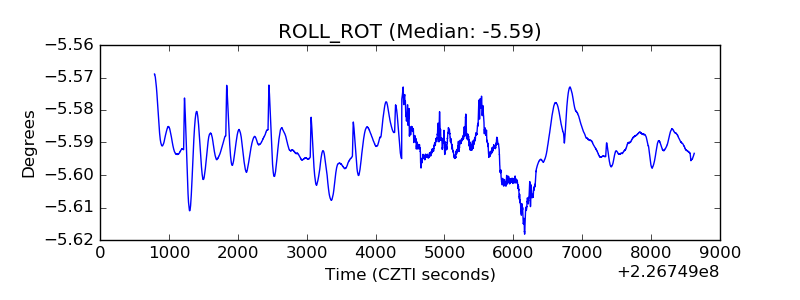 |
| _Roll_DEC | 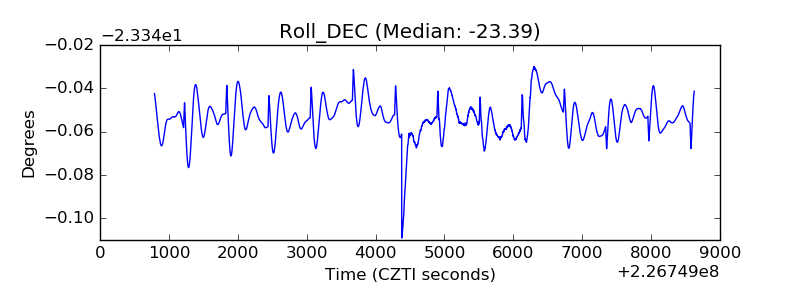 |
| _Roll_RA | 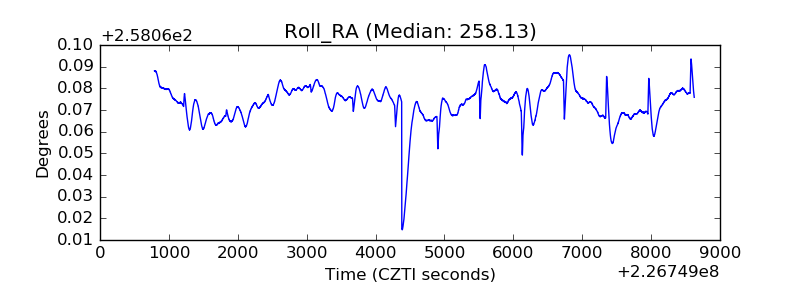 |
| Veto Counter | 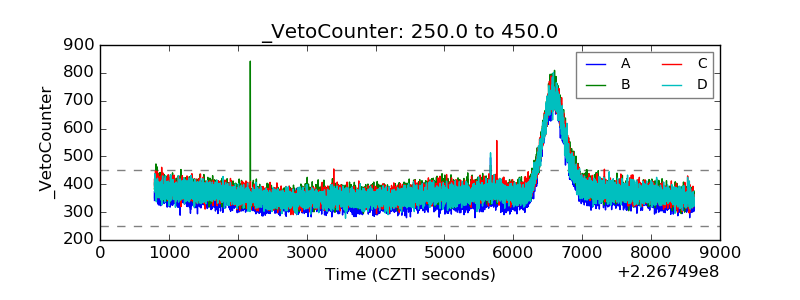 |