| Param | Original file | Final file |
|---|---|---|
| Filename | modeM0/AS1G06_077T02_9000001076_07821cztM0_level2.evt | modeM0/AS1G06_077T02_9000001076_07821cztM0_level2_quad_clean.evt |
| Size (bytes) | 128,865,600 | 8,406,720 |
| Size | 122.9 MB | 8.0 MB |
| Events in quadrant A | 858,956 | 27,304 |
| Events in quadrant B | 993,367 | 28,634 |
| Events in quadrant C | 847,152 | 28,787 |
| Events in quadrant D | 1,068,147 | 27,291 |
| Mode M0 | |||
|---|---|---|---|
| Quadrant | BADHDUFLAG | Total packets | Discarded packets |
| A | 0 | 3915 | 1 |
| B | 0 | 4233 | 0 |
| C | 0 | 3910 | 0 |
| D | 0 | 4521 | 0 |
| Mode SS | |||
|---|---|---|---|
| Quadrant | BADHDUFLAG | Total packets | Discarded packets |
| A | 0 | 38 | 0 |
| B | 0 | 38 | 0 |
| C | 0 | 38 | 0 |
| D | 0 | 38 | 0 |
| Quadrant | Total seconds | Saturated seconds | Saturation percentage |
|---|---|---|---|
| A | 1948 | 0 | 0.000000% |
| B | 1948 | 7 | 0.359343% |
| C | 1948 | 0 | 0.000000% |
| D | 1948 | 18 | 0.924025% |
Noise dominated data is calculated using 1-second bins in cleaned event files. If a bin has >2000 counts, and if more than 50% of those come from <1% of pixels, then it is considered to be noise-dominated and hence unusable.
| Quadrant | # 1 sec bins | Bins with >0 counts | Bins with >2000 counts | High rate bins dominated by noise | Noise dominated (total time) | Noise dominated (detector-on time) | Marked lightcurve |
|---|---|---|---|---|---|---|---|
| A | 1947 | 1947 | 0 | 0 | 0.00% | 0.00% | 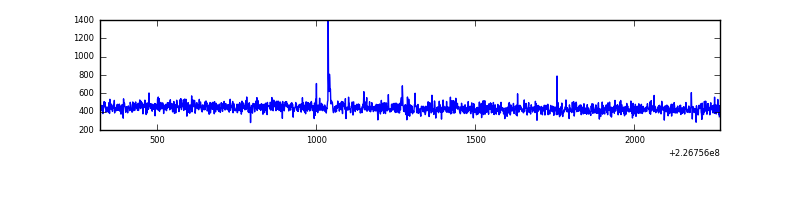 |
| B | 1947 | 1947 | 7 | 7 | 0.36% | 0.36% | 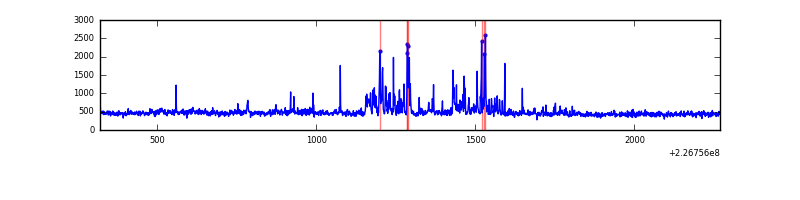 |
| C | 1948 | 1948 | 0 | 0 | 0.00% | 0.00% | 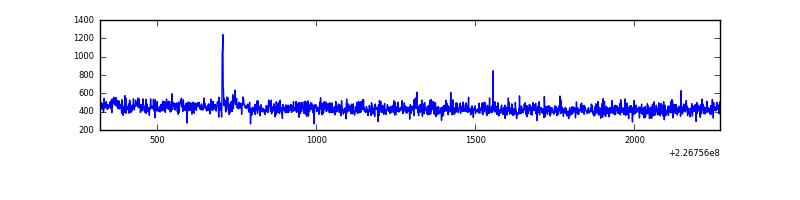 |
| D | 1948 | 1948 | 14 | 14 | 0.72% | 0.72% | 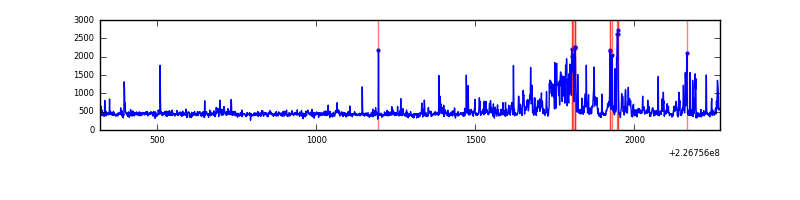 |
Top three noisy pixels from each quadrant. If the there are fewer than three noisy pixels in the level2.evt file, extra rows are filled as -1
| Pixel properties | Quadrant properties | ||||||
|---|---|---|---|---|---|---|---|
| Quadrant | DetID | PixID | Counts | Sigma | Mean | Median | Sigma |
| A | 13 | 14 | 5923 | 122.39 | 220 | 216 | 46.6 |
| A | 15 | 174 | 4395 | 89.62 | 220 | 216 | 46.6 |
| A | 12 | 194 | 2120 | 40.83 | 220 | 216 | 46.6 |
| B | 10 | 246 | 100542 | 2283.69 | 218 | 213 | 43.9 |
| B | 0 | 219 | 16929 | 380.49 | 218 | 213 | 43.9 |
| B | 0 | 214 | 14723 | 330.28 | 218 | 213 | 43.9 |
| C | 9 | 54 | 12475 | 242.06 | 212 | 213 | 50.7 |
| C | 1 | 16 | 4411 | 82.87 | 212 | 213 | 50.7 |
| C | 13 | 61 | 1693 | 29.22 | 212 | 213 | 50.7 |
| D | 2 | 152 | 137078 | 2476.78 | 214 | 207 | 55.3 |
| D | 2 | 136 | 37310 | 671.41 | 214 | 207 | 55.3 |
| D | 7 | 71 | 23125 | 414.72 | 214 | 207 | 55.3 |
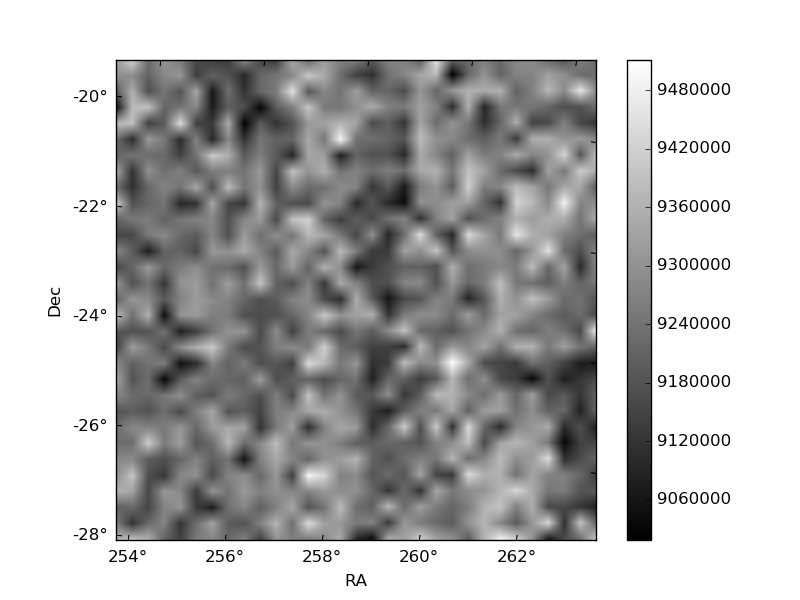
Histogram calculated using DETX and DETY for each event in the final _common_clean file
| Quadrant A | 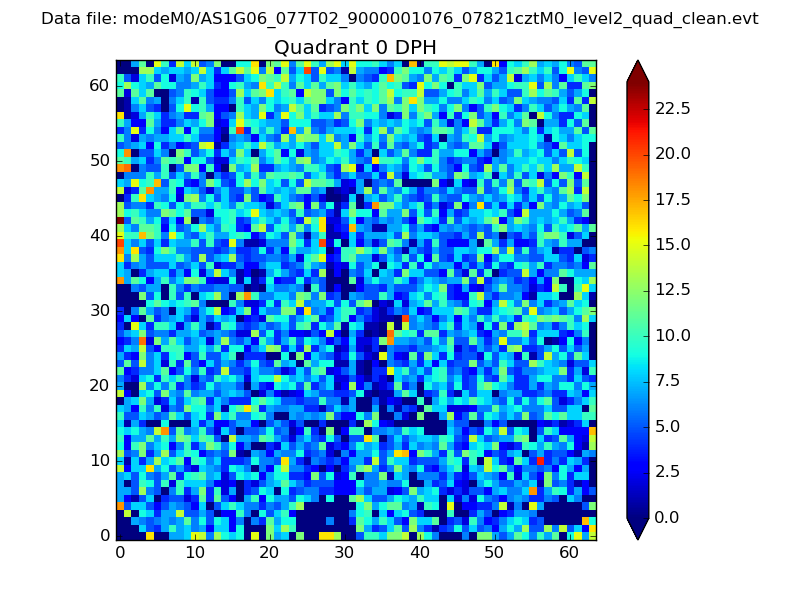 |
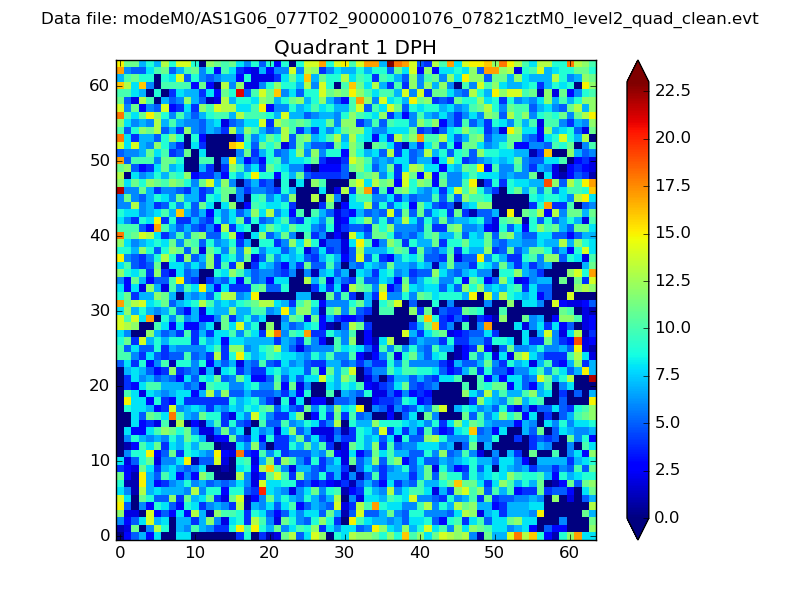 |
Quadrant B |
|---|---|---|---|
| Quadrant D | 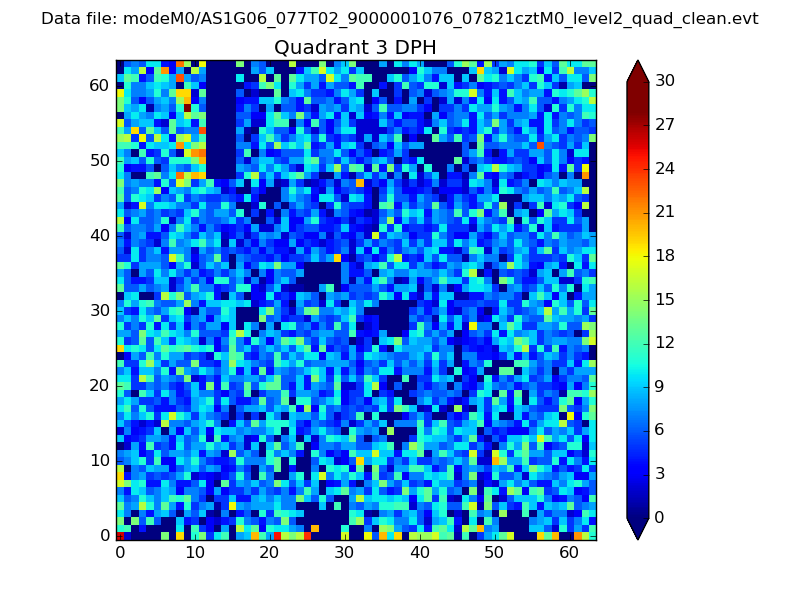 |
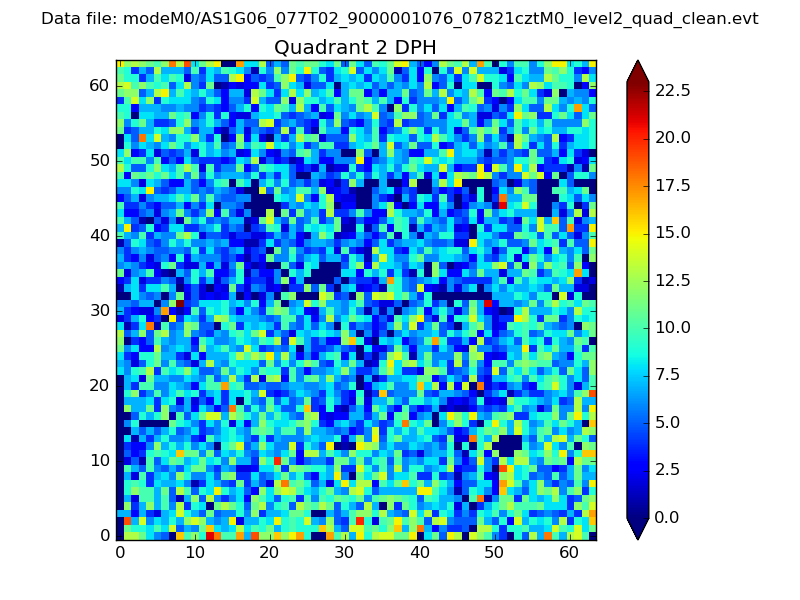 |
Quadrant C |
| Plot type | Count rate plots | Images |
|---|---|---|
| Comparison with Poisson distribution Blue bars denote a histogram of data divided into 1 sec bins. Red curve is a Poisson curve with rate = median count rate of data. |
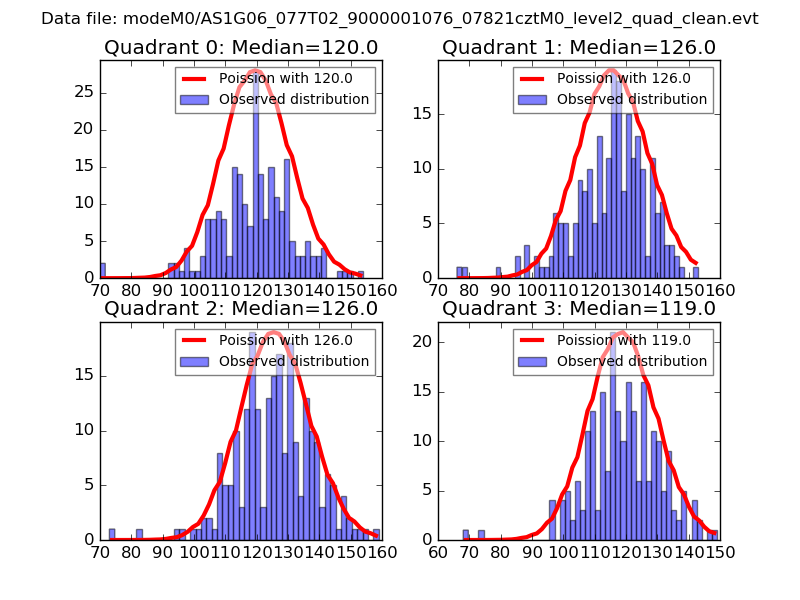 |
 |
| Quadrant-wise count rates Data is divided into 100 sec bins |
 |
|
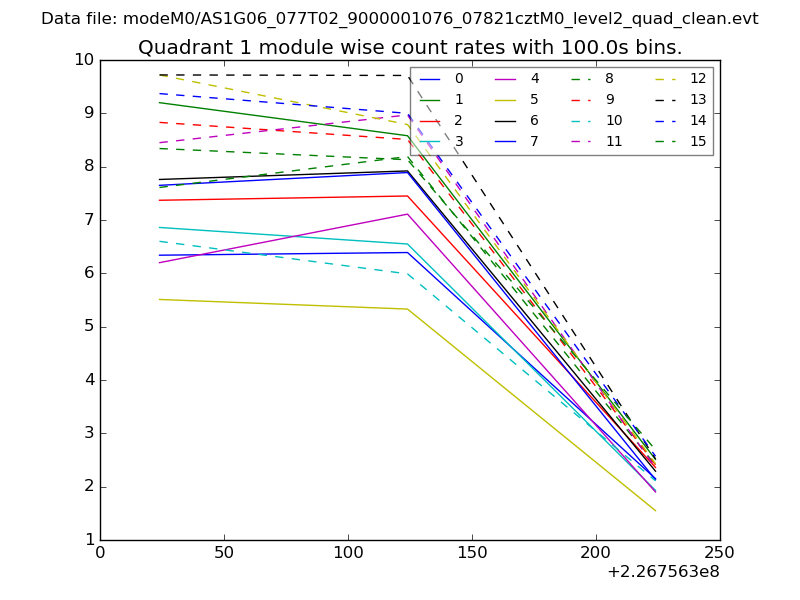
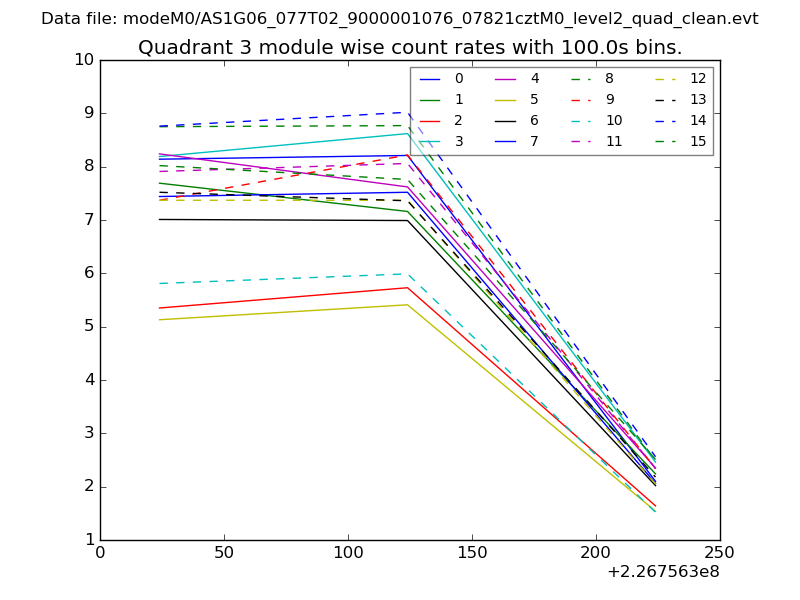
| Module-wise count rates for Quadrant A Data is divided into 100 sec bins |
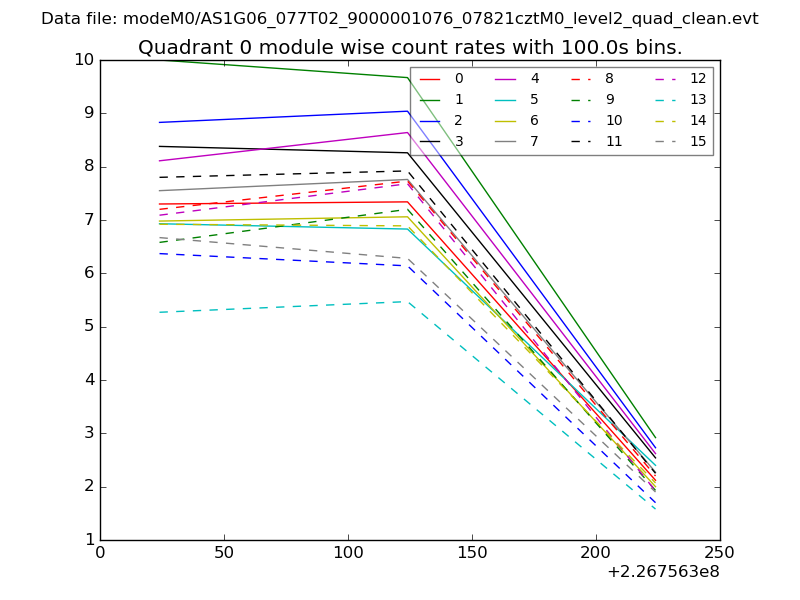 |
 |
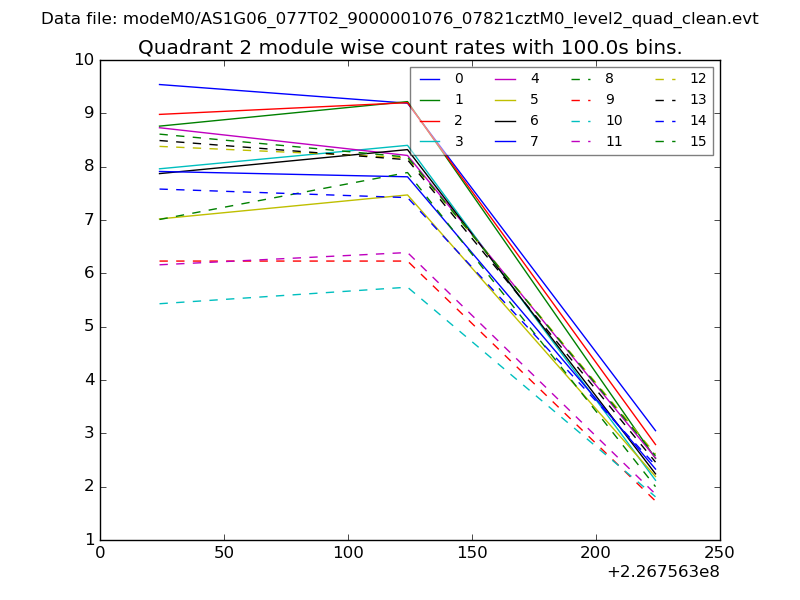
| Module-wise count rates for Quadrant B Data is divided into 100 sec bins |
 |
 |
| Module-wise count rates for Quadrant C Data is divided into 100 sec bins |
 |
 |
| Module-wise count rates for Quadrant D Data is divided into 100 sec bins |
 |
 |
| Parameter | Plot |
|---|---|
| CZT HV Monitor | 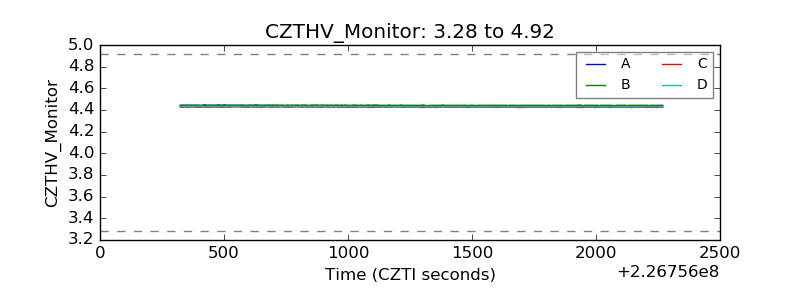 |
| D_VDD | 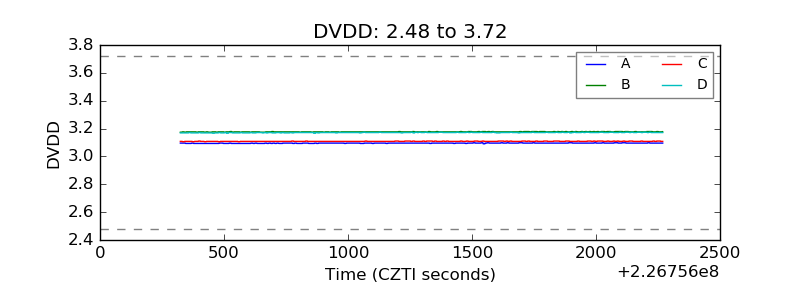 |
| Temperature 1 | 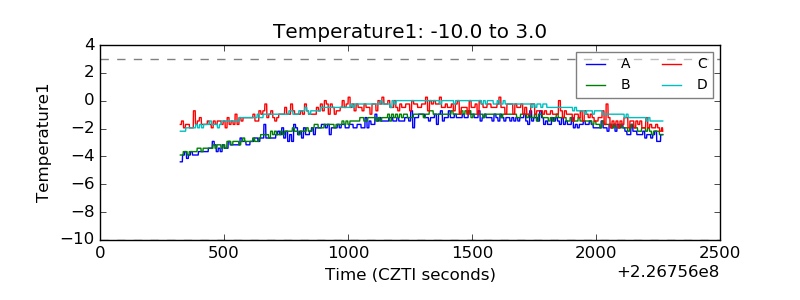 |
| Veto HV Monitor | 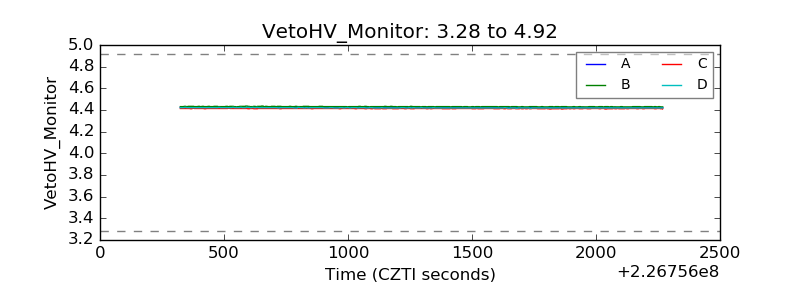 |
| Veto LLD | 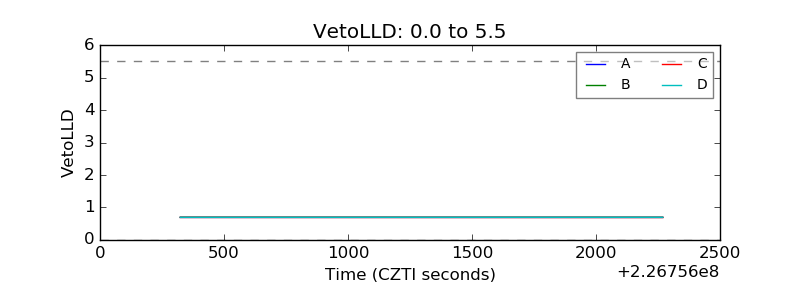 |
| Alpha Counter | 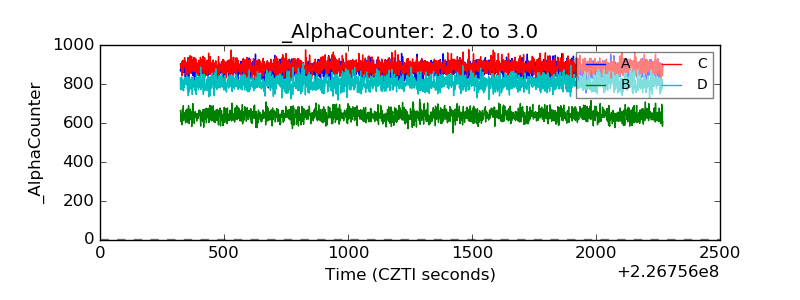 |
| _CPM_Rate | 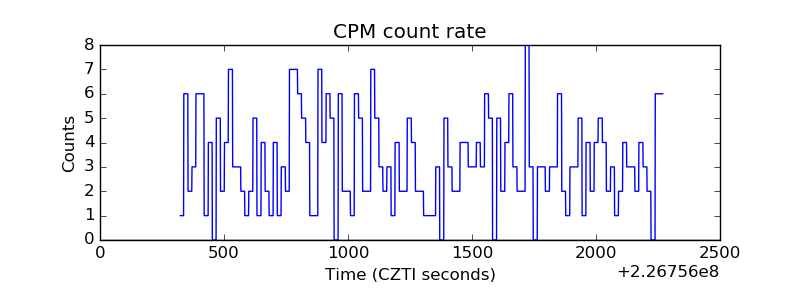 |
| CZT Counter | 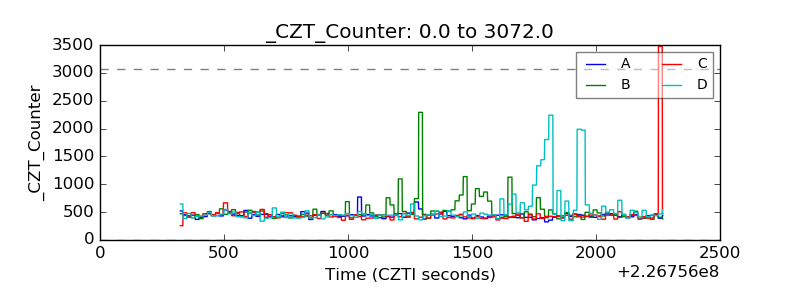 |
| +2.5 Volts monitor |  |
| +5 Volts monitor |  |
| _ROLL_ROT | 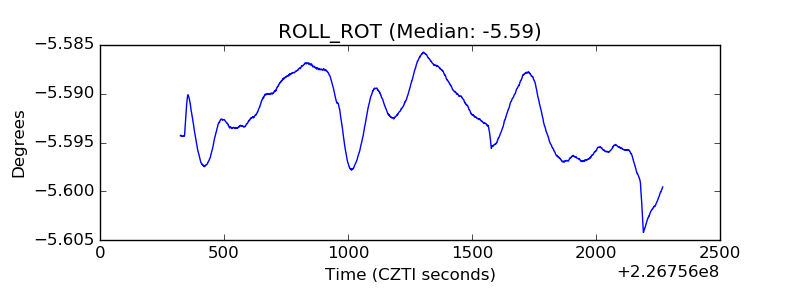 |
| _Roll_DEC | 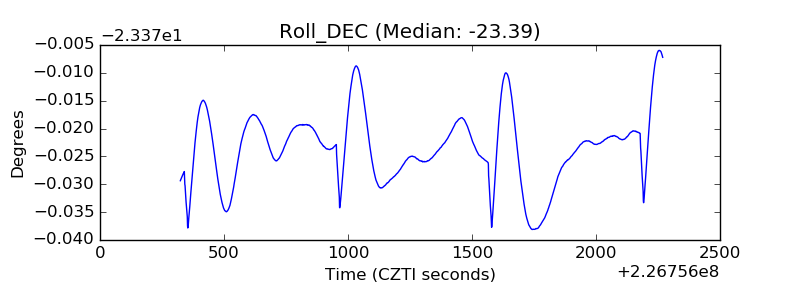 |
| _Roll_RA | 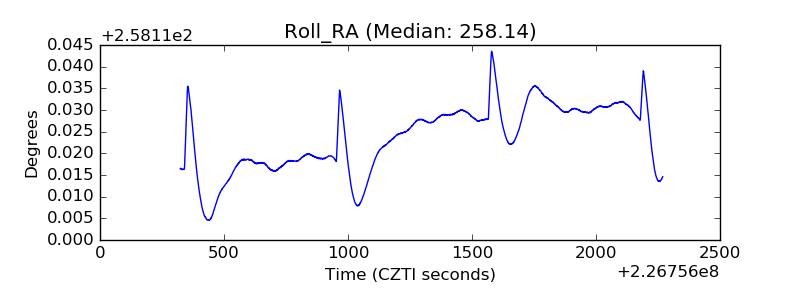 |
| Veto Counter | 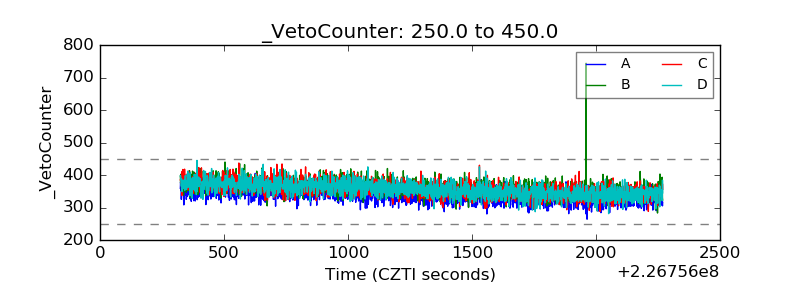 |