| Param | Original file | Final file |
|---|---|---|
| Filename | modeM0/AS1G06_077T02_9000001076_07824cztM0_level2.evt | modeM0/AS1G06_077T02_9000001076_07824cztM0_level2_quad_clean.evt |
| Size (bytes) | 1,289,036,160 | 248,978,880 |
| Size | 1.2 GB | 237.4 MB |
| Events in quadrant A | 8,882,764 | 1,547,893 |
| Events in quadrant B | 9,568,768 | 1,574,908 |
| Events in quadrant C | 8,928,653 | 1,574,198 |
| Events in quadrant D | 10,332,885 | 1,494,433 |
| Mode M9 | |||
|---|---|---|---|
| Quadrant | BADHDUFLAG | Total packets | Discarded packets |
| A | 0 | 14 | 0 |
| B | 0 | 14 | 0 |
| C | 0 | 14 | 0 |
| D | 0 | 14 | 0 |
| Mode M0 | |||
|---|---|---|---|
| Quadrant | BADHDUFLAG | Total packets | Discarded packets |
| A | 0 | 40251 | 112 |
| B | 0 | 41379 | 138 |
| C | 0 | 40307 | 110 |
| D | 0 | 44472 | 105 |
| Mode SS | |||
|---|---|---|---|
| Quadrant | BADHDUFLAG | Total packets | Discarded packets |
| A | 0 | 398 | 2 |
| B | 0 | 398 | 0 |
| C | 0 | 398 | 0 |
| D | 0 | 398 | 0 |
| Quadrant | Total seconds | Saturated seconds | Saturation percentage |
|---|---|---|---|
| A | 19589 | 250 | 1.276226% |
| B | 19582 | 337 | 1.720968% |
| C | 19591 | 148 | 0.755449% |
| D | 19596 | 308 | 1.571749% |
Noise dominated data is calculated using 1-second bins in cleaned event files. If a bin has >2000 counts, and if more than 50% of those come from <1% of pixels, then it is considered to be noise-dominated and hence unusable.
| Quadrant | # 1 sec bins | Bins with >0 counts | Bins with >2000 counts | High rate bins dominated by noise | Noise dominated (total time) | Noise dominated (detector-on time) | Marked lightcurve |
|---|---|---|---|---|---|---|---|
| A | 20980 | 19621 | 2 | 2 | 0.01% | 0.01% | 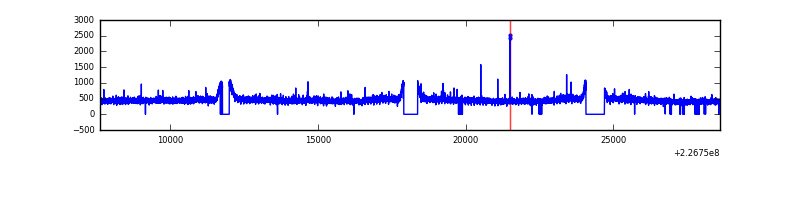 |
| B | 20980 | 19612 | 66 | 66 | 0.31% | 0.34% | 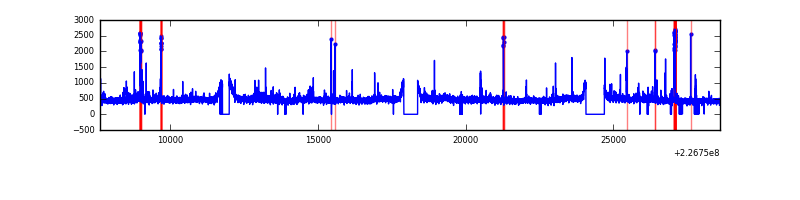 |
| C | 20980 | 19626 | 0 | 0 | 0.00% | 0.00% | 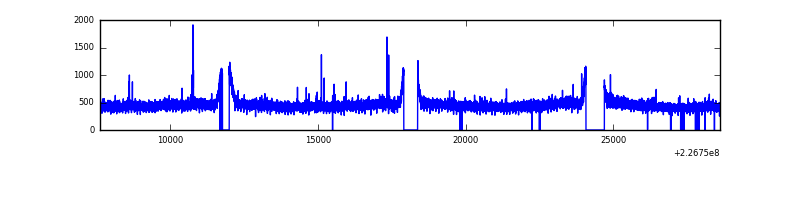 |
| D | 20980 | 19623 | 139 | 139 | 0.66% | 0.71% |  |
Top three noisy pixels from each quadrant. If the there are fewer than three noisy pixels in the level2.evt file, extra rows are filled as -1
| Pixel properties | Quadrant properties | ||||||
|---|---|---|---|---|---|---|---|
| Quadrant | DetID | PixID | Counts | Sigma | Mean | Median | Sigma |
| A | 13 | 14 | 26086 | 51.7 | 2291 | 2247 | 461.1 |
| A | 0 | 226 | 21914 | 42.65 | 2291 | 2247 | 461.1 |
| A | 12 | 194 | 19944 | 38.38 | 2291 | 2247 | 461.1 |
| B | 4 | 239 | 262448 | 590.08 | 2315 | 2266 | 440.9 |
| B | 0 | 219 | 124041 | 276.18 | 2315 | 2266 | 440.9 |
| B | 0 | 214 | 54900 | 119.37 | 2315 | 2266 | 440.9 |
| C | 1 | 16 | 49875 | 91.4 | 2254 | 2269 | 520.8 |
| C | 9 | 54 | 47783 | 87.39 | 2254 | 2269 | 520.8 |
| C | 13 | 61 | 17205 | 28.68 | 2254 | 2269 | 520.8 |
| D | 2 | 152 | 675112 | 1224.7 | 2238 | 2171 | 549.5 |
| D | 1 | 52 | 435176 | 788.03 | 2238 | 2171 | 549.5 |
| D | 7 | 71 | 180254 | 324.1 | 2238 | 2171 | 549.5 |
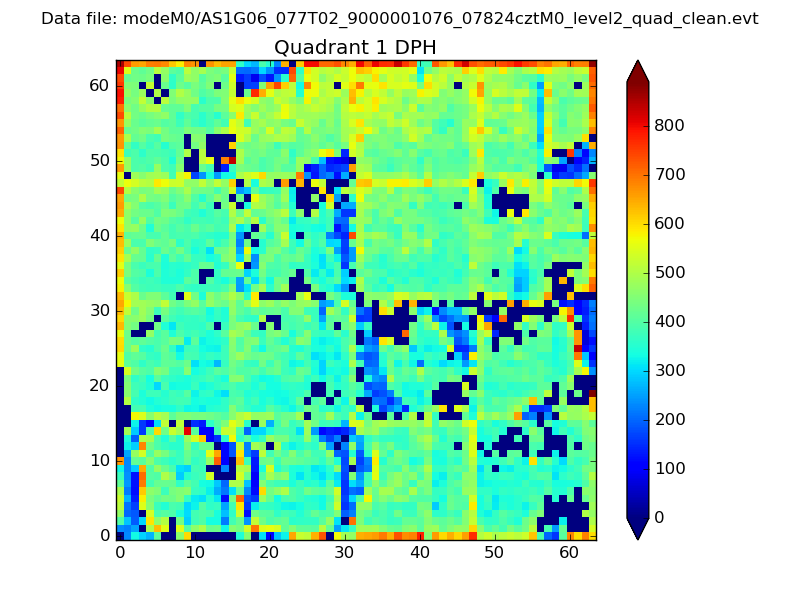
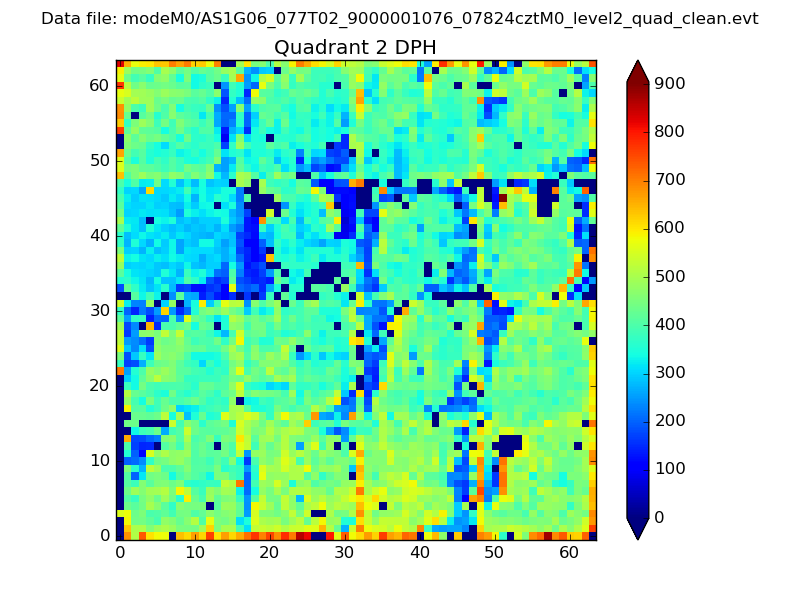
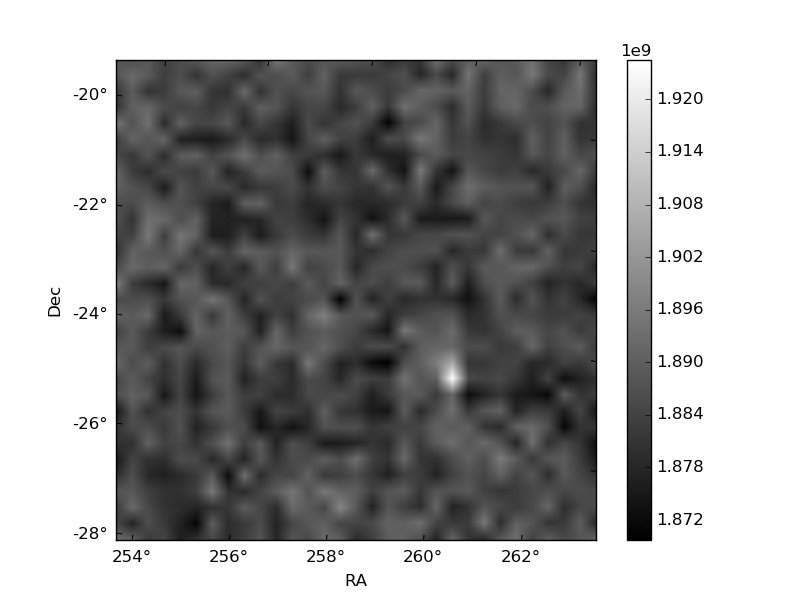
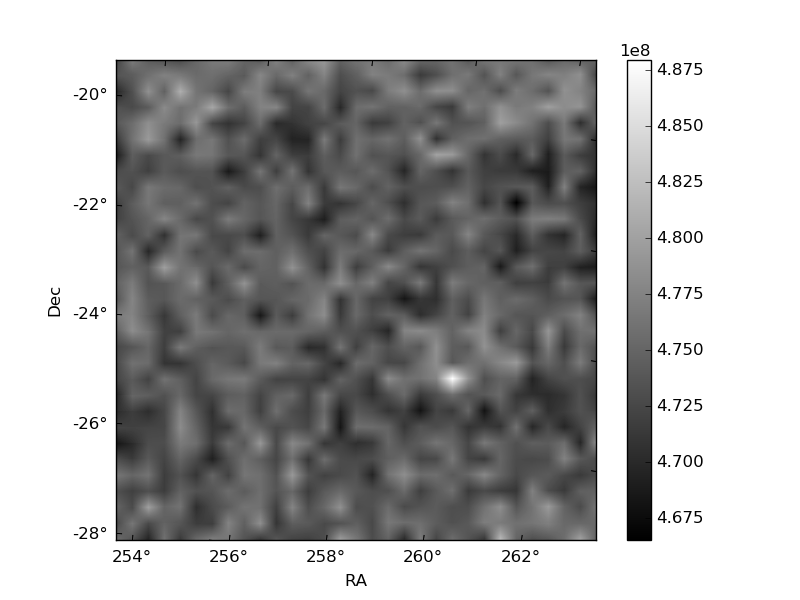
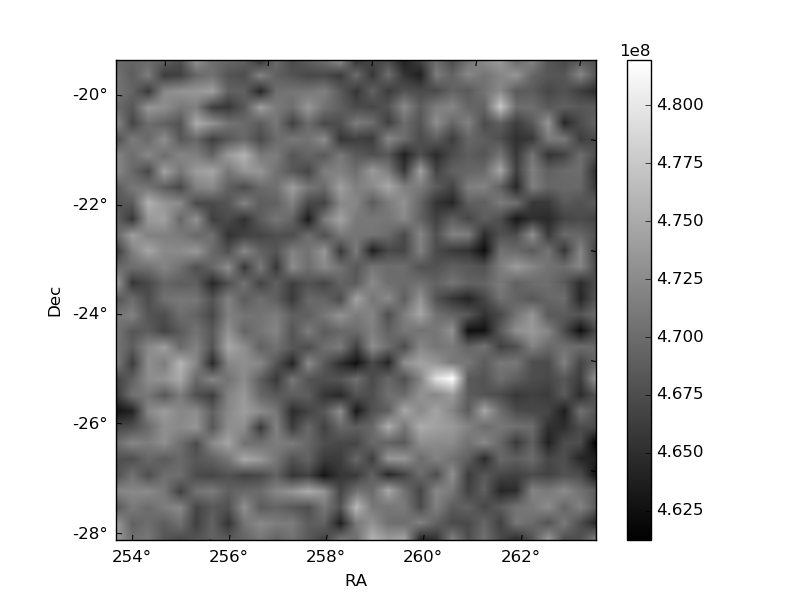
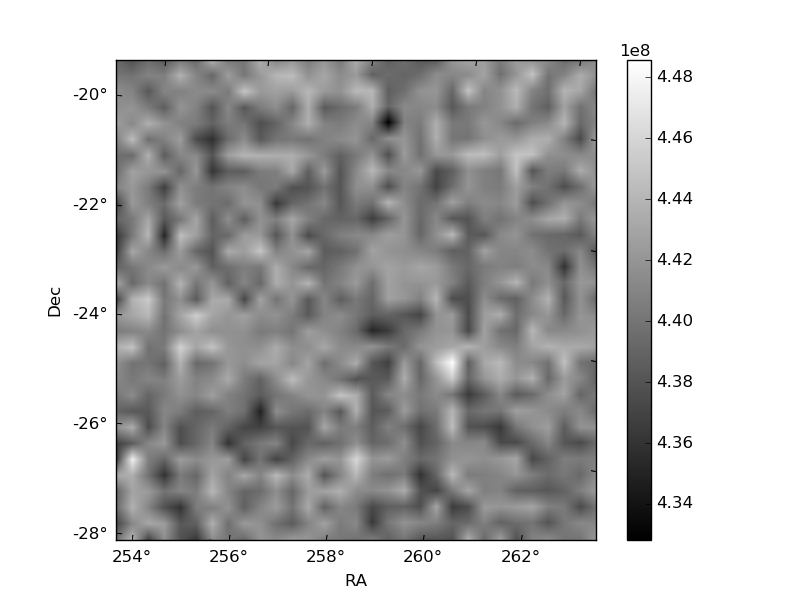
Histogram calculated using DETX and DETY for each event in the final _common_clean file
| Quadrant A | 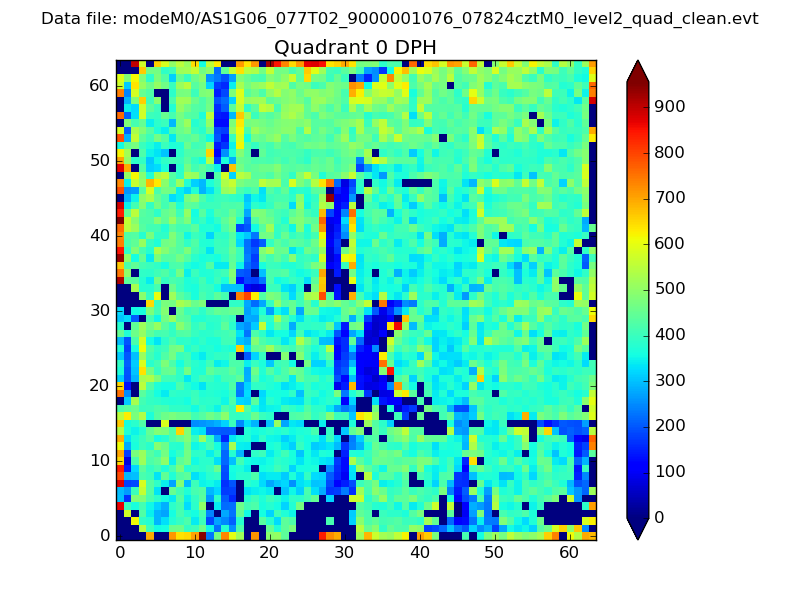 |
 |
Quadrant B |
|---|---|---|---|
| Quadrant D | 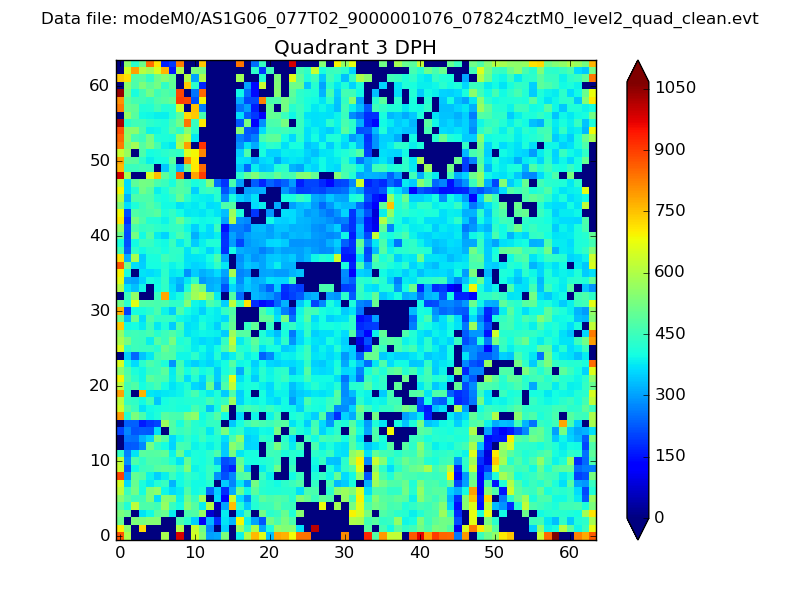 |
 |
Quadrant C |
| Plot type | Count rate plots | Images |
|---|---|---|
| Comparison with Poisson distribution Blue bars denote a histogram of data divided into 1 sec bins. Red curve is a Poisson curve with rate = median count rate of data. |
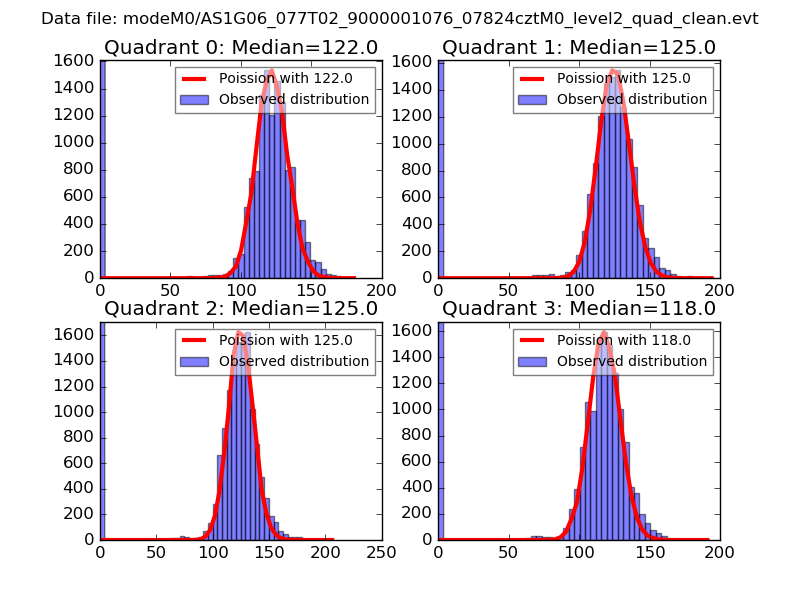 |
 |
| Quadrant-wise count rates Data is divided into 100 sec bins |
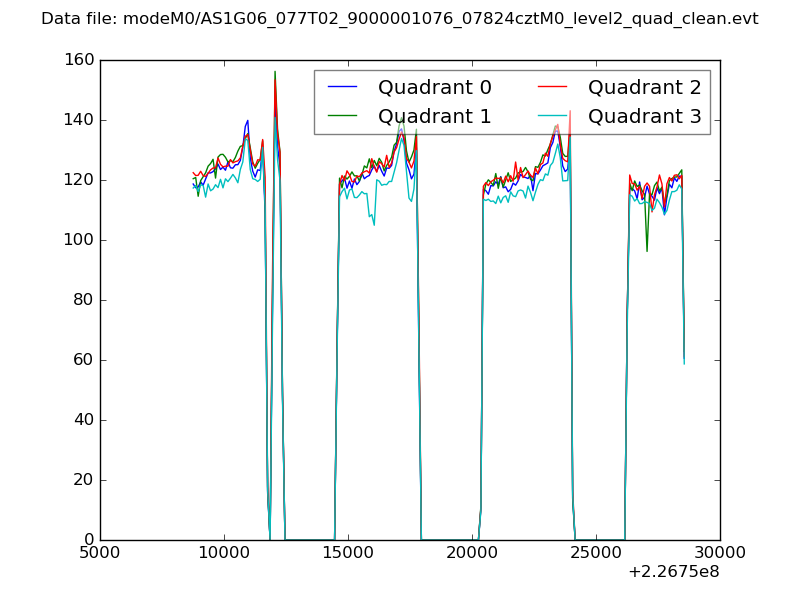 |
|
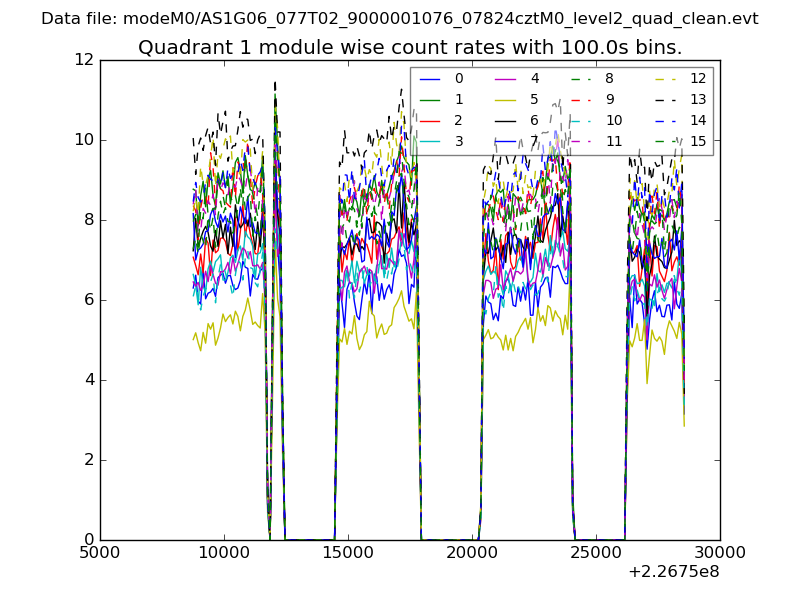
| Module-wise count rates for Quadrant A Data is divided into 100 sec bins |
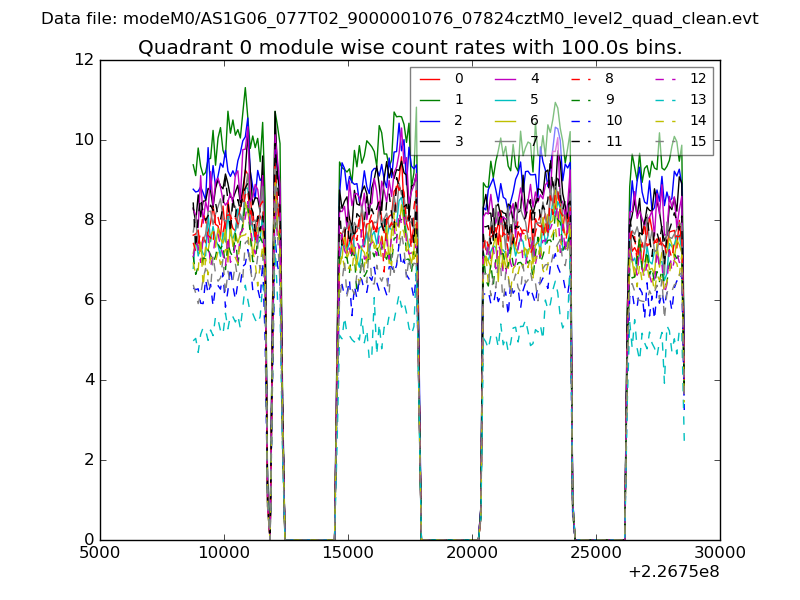 |
 |
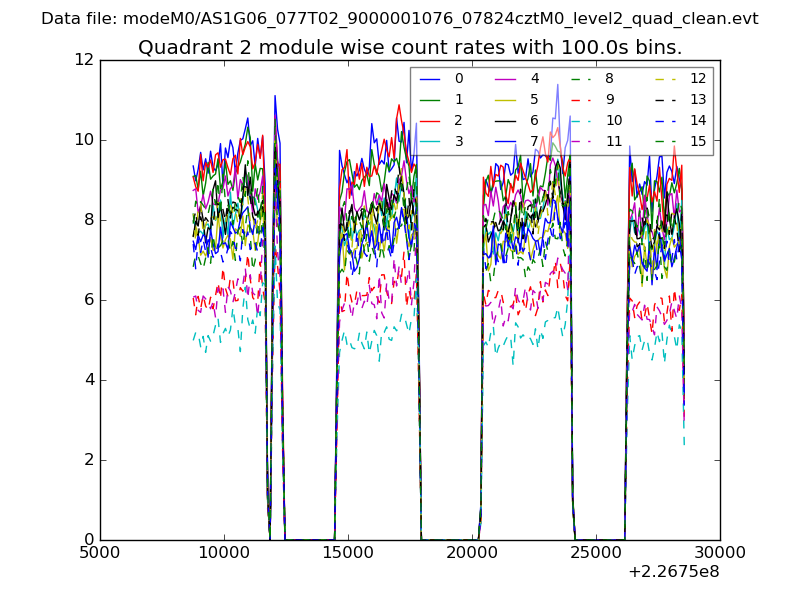
| Module-wise count rates for Quadrant B Data is divided into 100 sec bins |
 |
 |
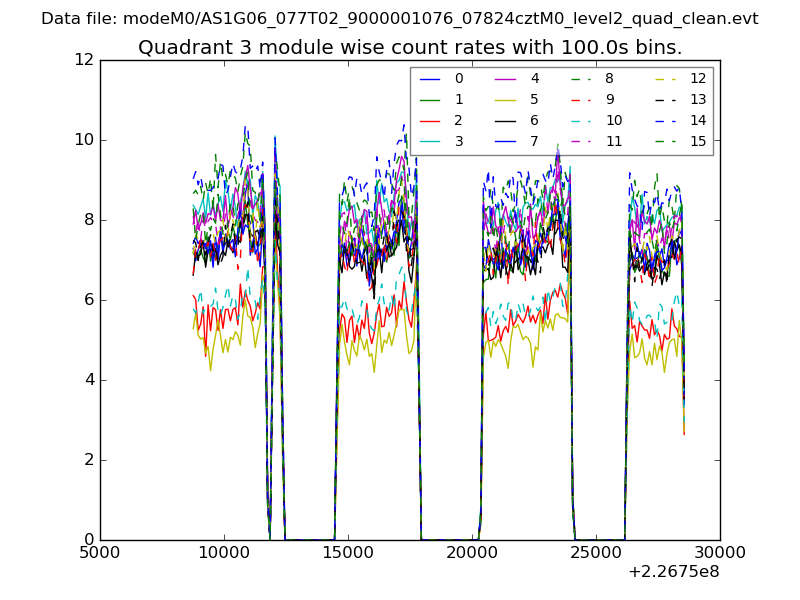
| Module-wise count rates for Quadrant C Data is divided into 100 sec bins |
 |
 |
| Module-wise count rates for Quadrant D Data is divided into 100 sec bins |
 |
 |
| Parameter | Plot |
|---|---|
| CZT HV Monitor | 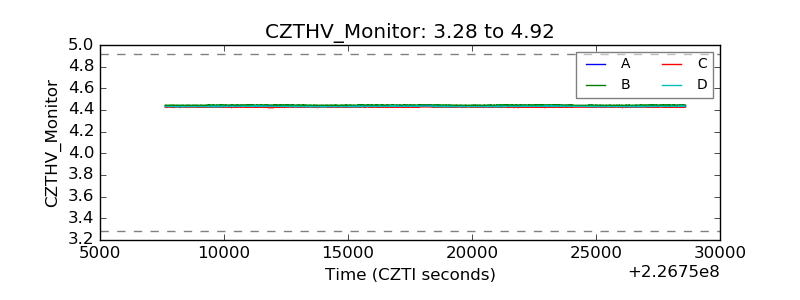 |
| D_VDD | 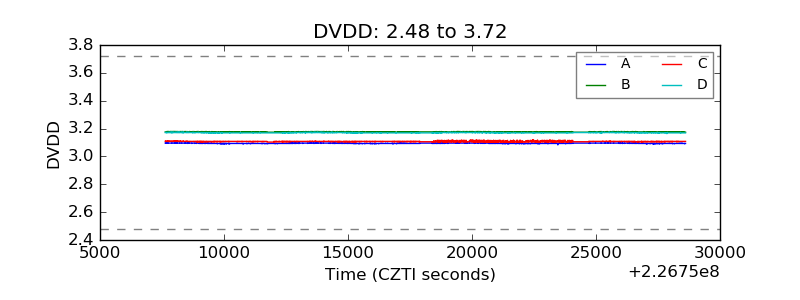 |
| Temperature 1 | 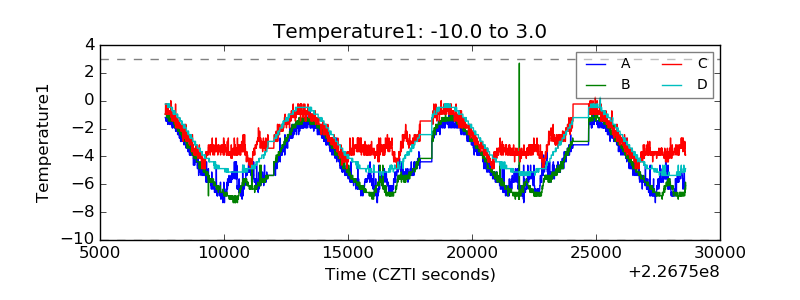 |
| Veto HV Monitor | 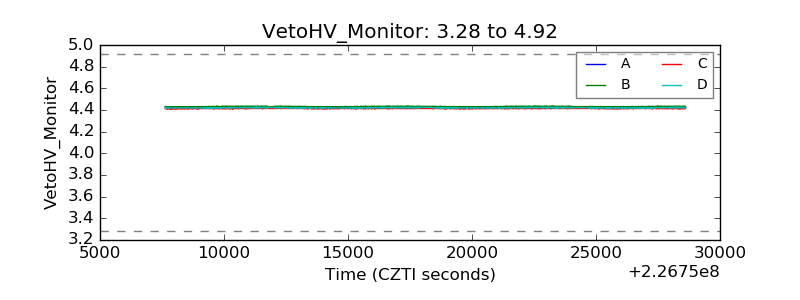 |
| Veto LLD | 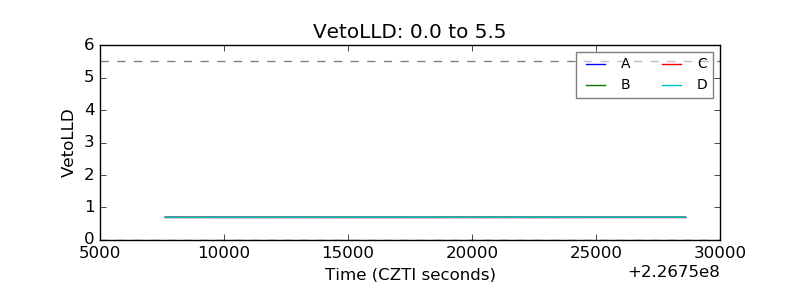 |
| Alpha Counter | 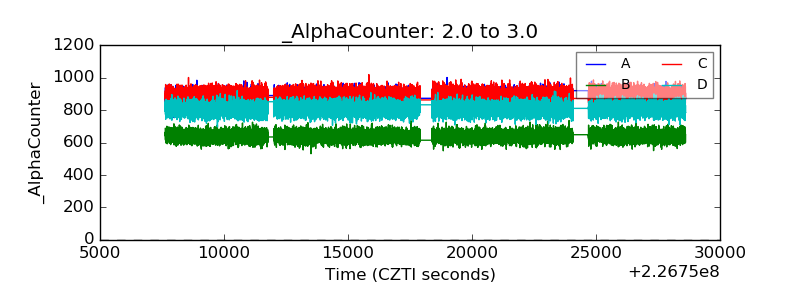 |
| _CPM_Rate | 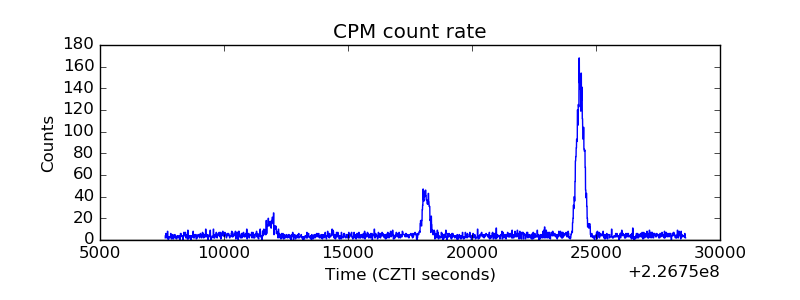 |
| CZT Counter | 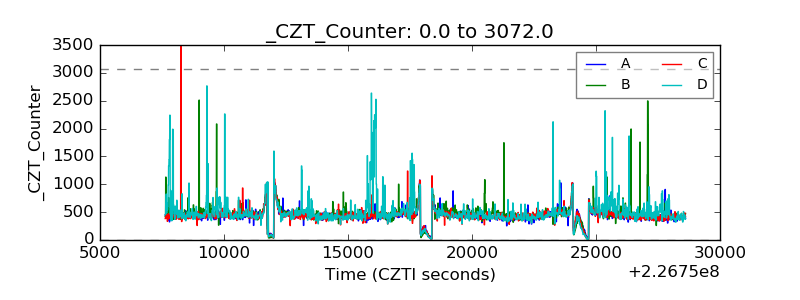 |
| +2.5 Volts monitor |  |
| +5 Volts monitor |  |
| _ROLL_ROT | 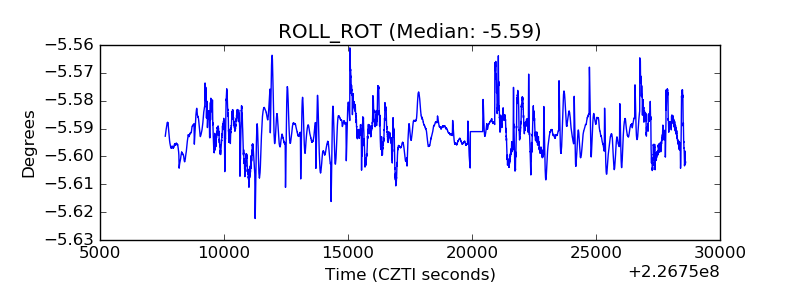 |
| _Roll_DEC | 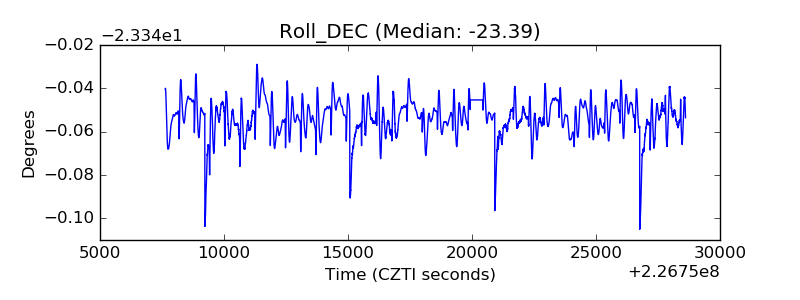 |
| _Roll_RA | 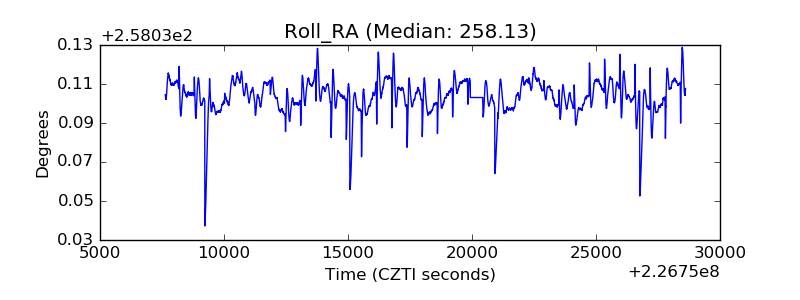 |
| Veto Counter | 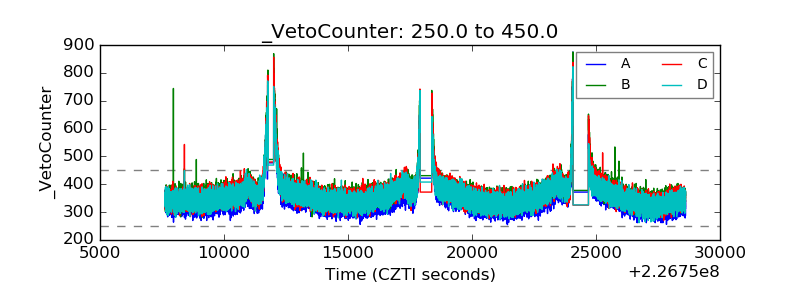 |