| Param | Original file | Final file |
|---|---|---|
| Filename | modeM0/AS1G06_077T02_9000001076_07825cztM0_level2.evt | modeM0/AS1G06_077T02_9000001076_07825cztM0_level2_quad_clean.evt |
| Size (bytes) | 603,089,280 | 121,780,800 |
| Size | 575.2 MB | 116.1 MB |
| Events in quadrant A | 4,173,602 | 767,750 |
| Events in quadrant B | 4,636,909 | 778,647 |
| Events in quadrant C | 4,566,227 | 778,670 |
| Events in quadrant D | 4,281,826 | 743,297 |
| Mode M9 | |||
|---|---|---|---|
| Quadrant | BADHDUFLAG | Total packets | Discarded packets |
| A | 0 | 17 | 0 |
| B | 0 | 17 | 0 |
| C | 0 | 17 | 0 |
| D | 0 | 17 | 0 |
| Mode M0 | |||
|---|---|---|---|
| Quadrant | BADHDUFLAG | Total packets | Discarded packets |
| A | 0 | 18378 | 3 |
| B | 0 | 19532 | 2 |
| C | 0 | 19423 | 2 |
| D | 0 | 18916 | 2 |
| Mode SS | |||
|---|---|---|---|
| Quadrant | BADHDUFLAG | Total packets | Discarded packets |
| A | 0 | 182 | 0 |
| B | 0 | 182 | 0 |
| C | 0 | 182 | 0 |
| D | 0 | 182 | 0 |
| Quadrant | Total seconds | Saturated seconds | Saturation percentage |
|---|---|---|---|
| A | 8935 | 96 | 1.074426% |
| B | 8935 | 177 | 1.980974% |
| C | 8935 | 71 | 0.794628% |
| D | 8935 | 78 | 0.872971% |
Noise dominated data is calculated using 1-second bins in cleaned event files. If a bin has >2000 counts, and if more than 50% of those come from <1% of pixels, then it is considered to be noise-dominated and hence unusable.
| Quadrant | # 1 sec bins | Bins with >0 counts | Bins with >2000 counts | High rate bins dominated by noise | Noise dominated (total time) | Noise dominated (detector-on time) | Marked lightcurve |
|---|---|---|---|---|---|---|---|
| A | 10680 | 8937 | 4 | 4 | 0.04% | 0.04% | 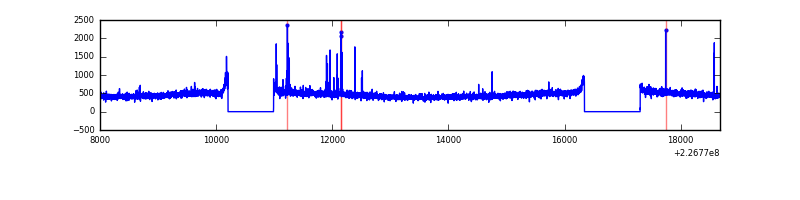 |
| B | 10679 | 8936 | 79 | 79 | 0.74% | 0.88% | 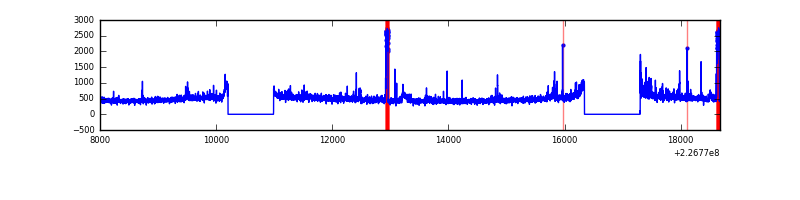 |
| C | 10680 | 8937 | 0 | 0 | 0.00% | 0.00% | 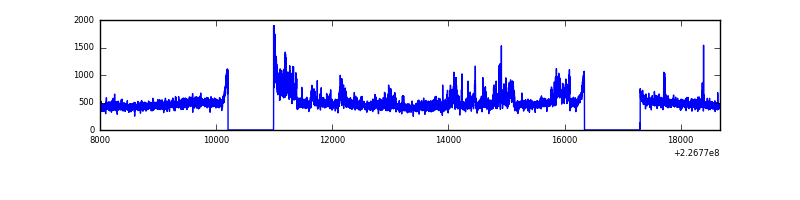 |
| D | 10680 | 8937 | 15 | 15 | 0.14% | 0.17% | 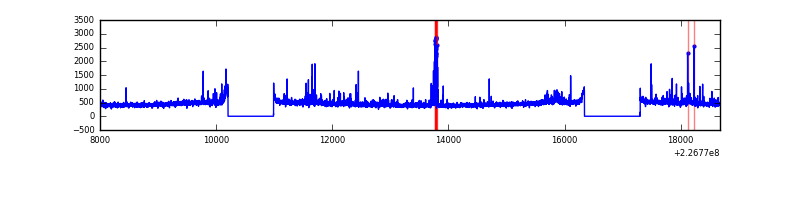 |
Top three noisy pixels from each quadrant. If the there are fewer than three noisy pixels in the level2.evt file, extra rows are filled as -1
| Pixel properties | Quadrant properties | ||||||
|---|---|---|---|---|---|---|---|
| Quadrant | DetID | PixID | Counts | Sigma | Mean | Median | Sigma |
| A | 0 | 128 | 39241 | 178.89 | 1068 | 1048 | 213.5 |
| A | 8 | 15 | 10023 | 42.04 | 1068 | 1048 | 213.5 |
| A | 0 | 226 | 9925 | 41.58 | 1068 | 1048 | 213.5 |
| B | 4 | 239 | 205744 | 998.33 | 1074 | 1050 | 205.0 |
| B | 0 | 219 | 76403 | 367.51 | 1074 | 1050 | 205.0 |
| B | 4 | 173 | 36875 | 174.73 | 1074 | 1050 | 205.0 |
| C | 1 | 16 | 471997 | 1939.52 | 1047 | 1053 | 242.8 |
| C | 12 | 4 | 10391 | 38.46 | 1047 | 1053 | 242.8 |
| C | 13 | 61 | 8091 | 28.99 | 1047 | 1053 | 242.8 |
| D | 13 | 104 | 96636 | 375.97 | 1045 | 1014 | 254.3 |
| D | 5 | 233 | 95595 | 371.87 | 1045 | 1014 | 254.3 |
| D | 2 | 152 | 58269 | 225.12 | 1045 | 1014 | 254.3 |
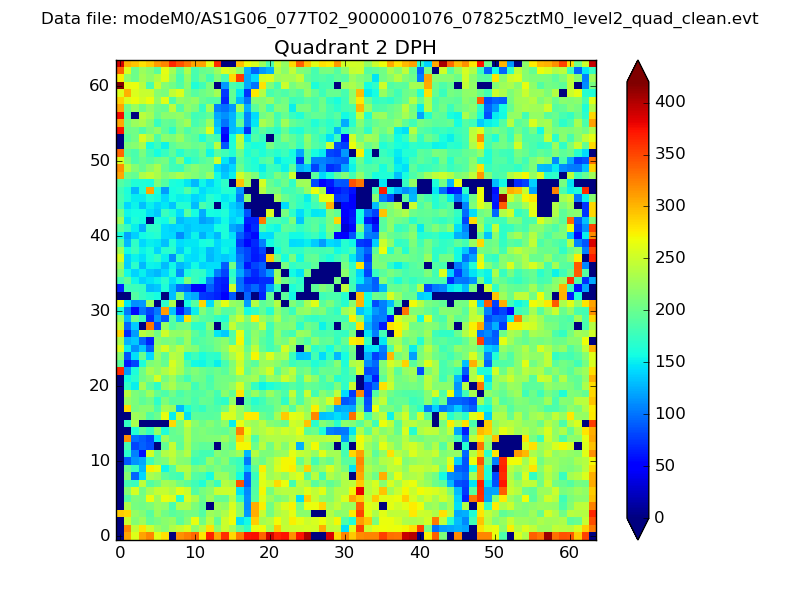
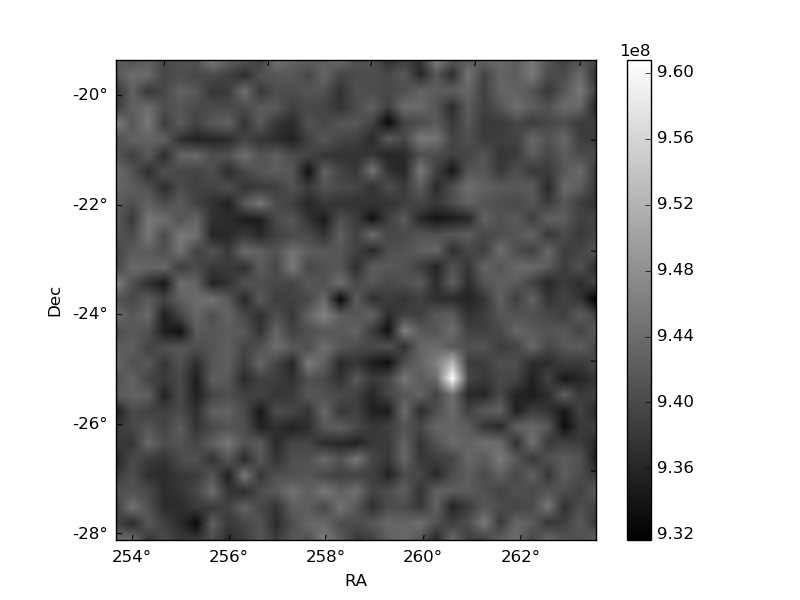
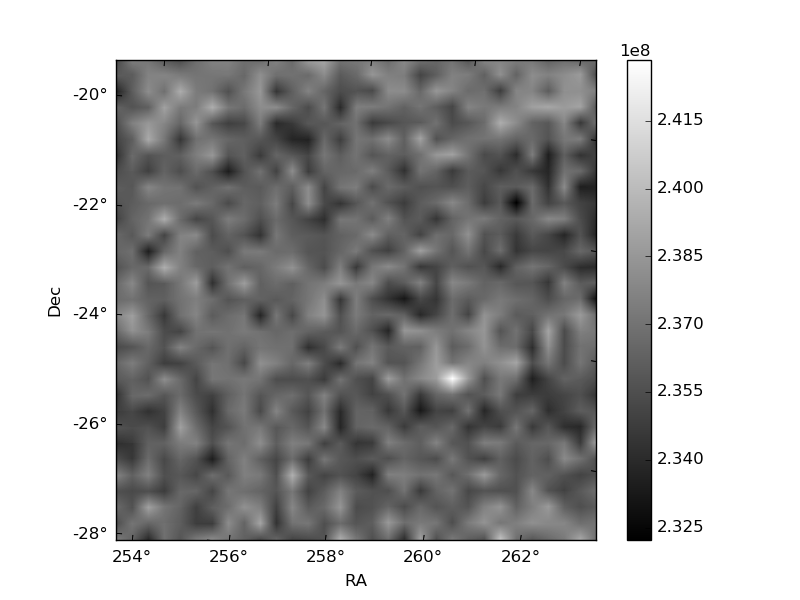
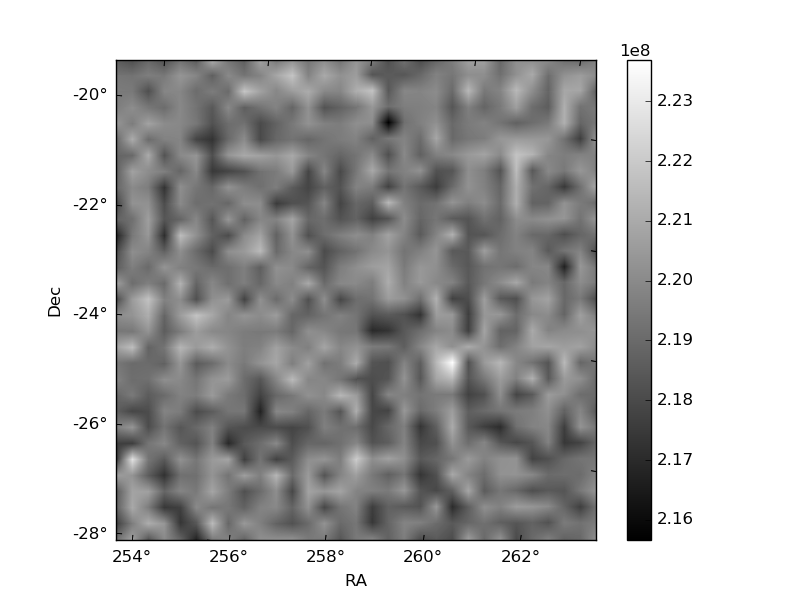
Histogram calculated using DETX and DETY for each event in the final _common_clean file
| Quadrant A | 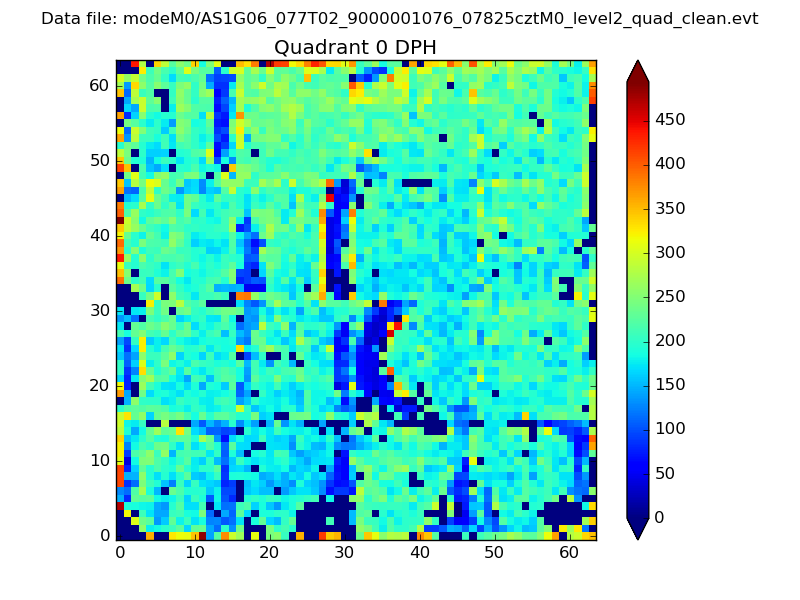 |
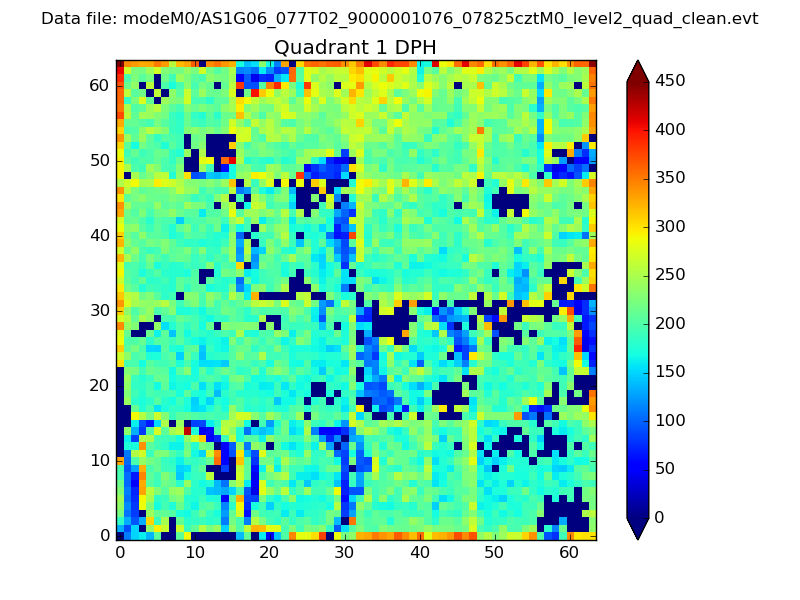 |
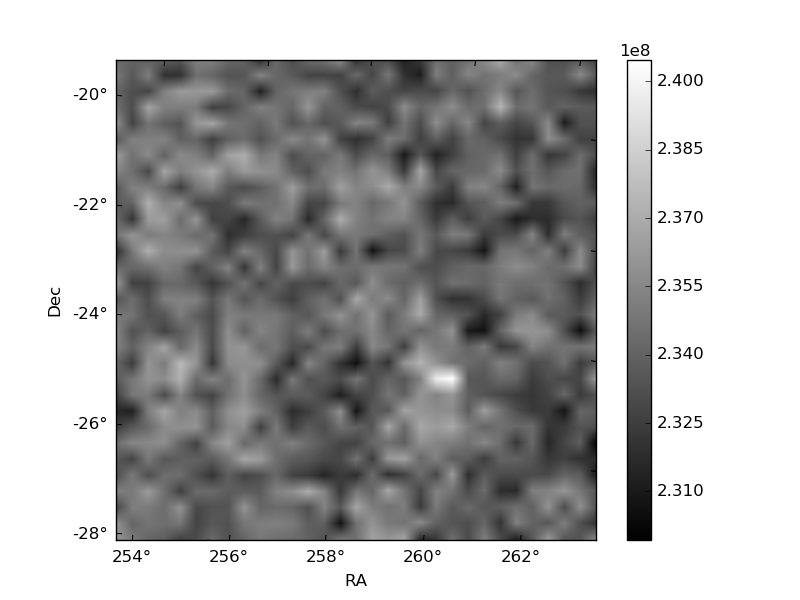
Quadrant B |
|---|---|---|---|
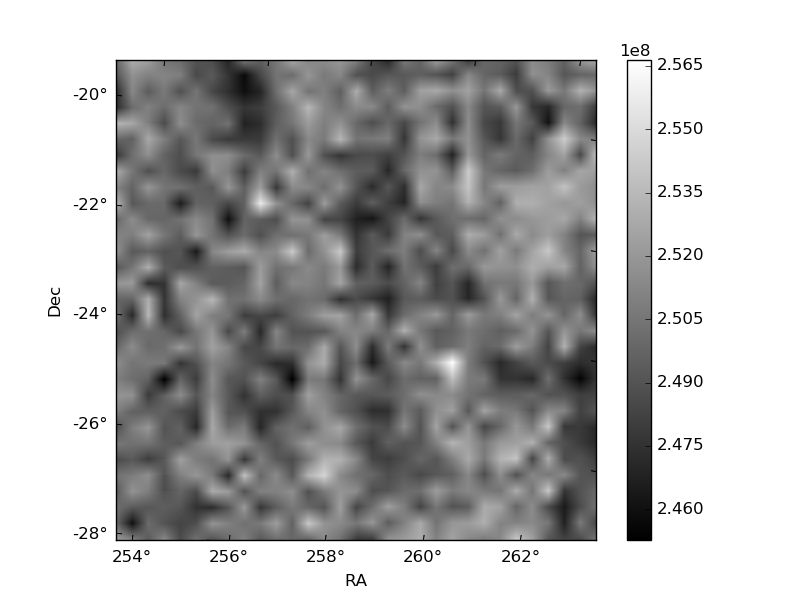
| Quadrant D | 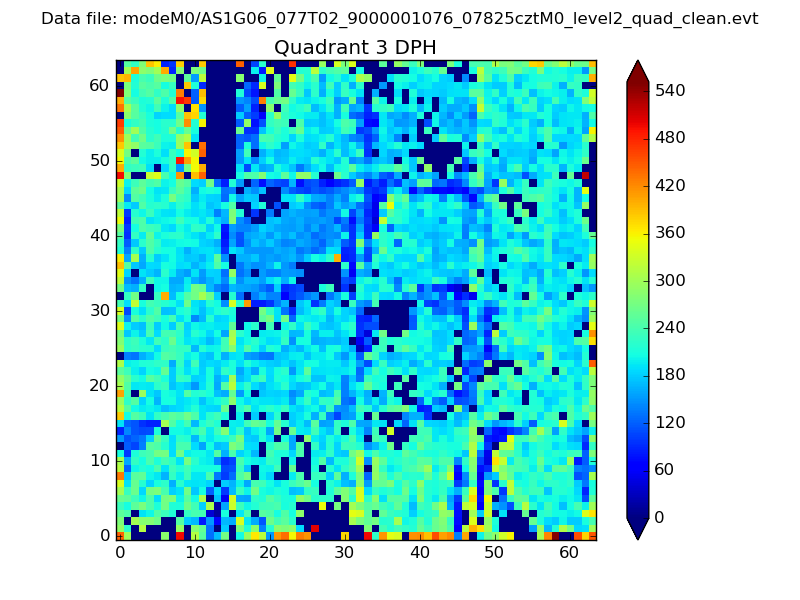 |
 |
Quadrant C |
| Plot type | Count rate plots | Images |
|---|---|---|
| Comparison with Poisson distribution Blue bars denote a histogram of data divided into 1 sec bins. Red curve is a Poisson curve with rate = median count rate of data. |
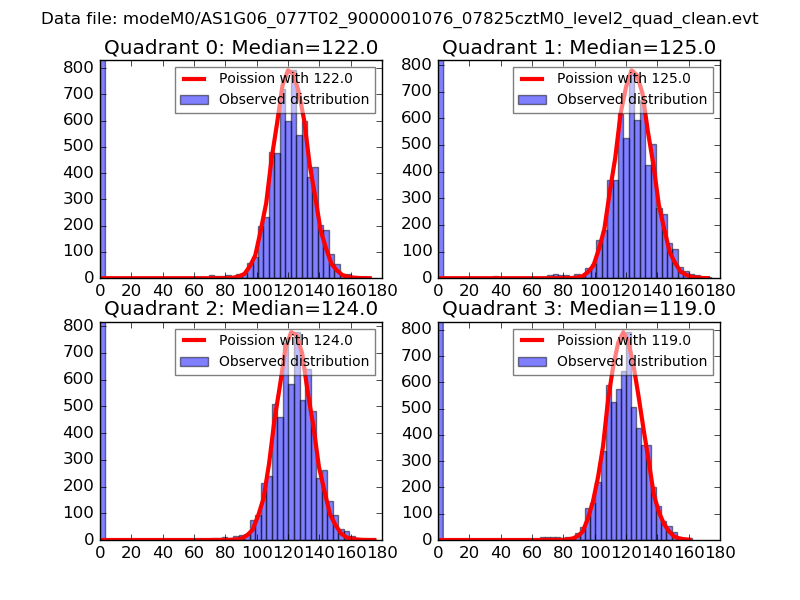 |
 |
| Quadrant-wise count rates Data is divided into 100 sec bins |
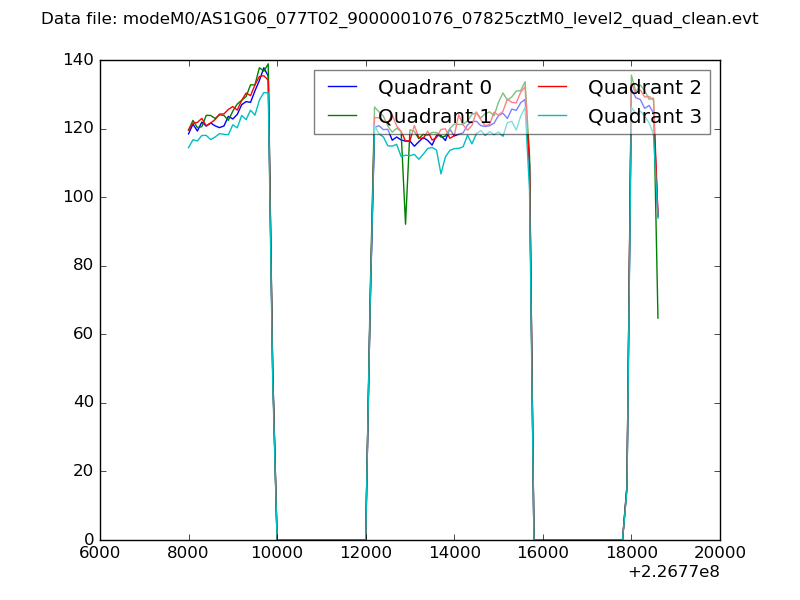 |
|
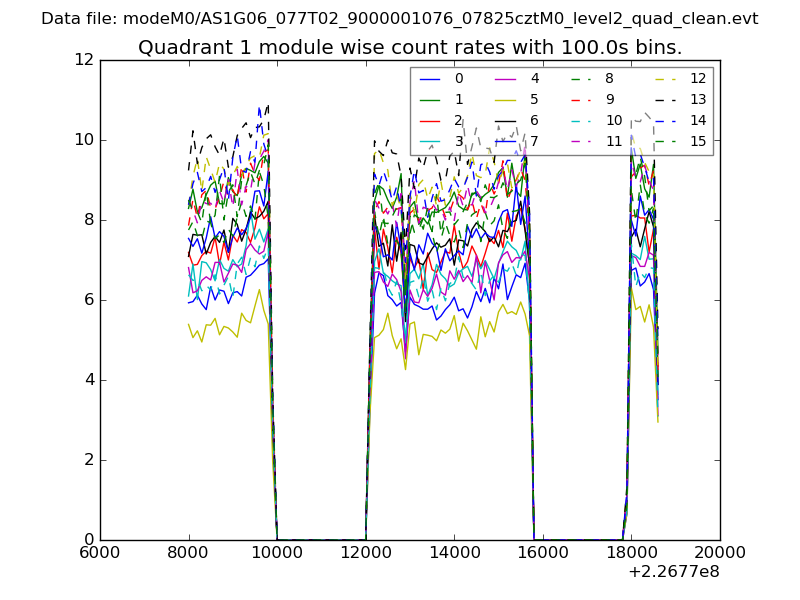
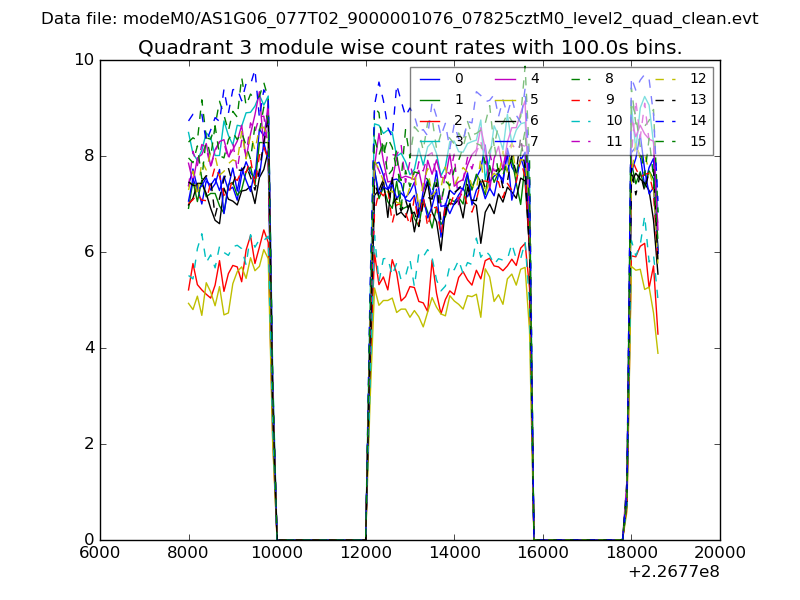
| Module-wise count rates for Quadrant A Data is divided into 100 sec bins |
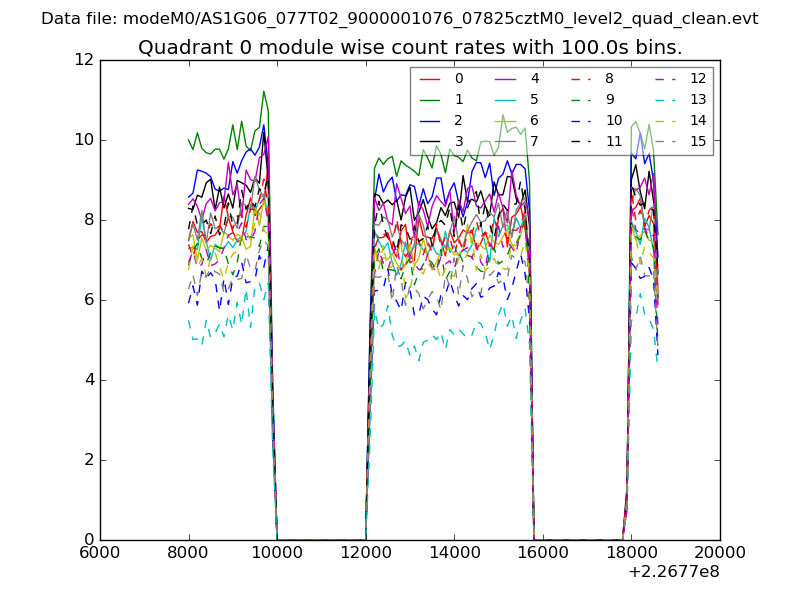 |
 |
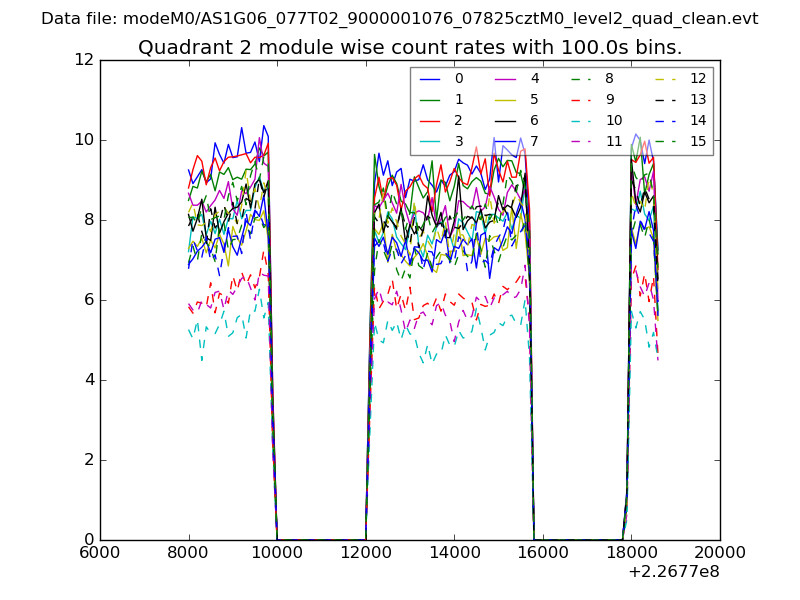
| Module-wise count rates for Quadrant B Data is divided into 100 sec bins |
 |
 |
| Module-wise count rates for Quadrant C Data is divided into 100 sec bins |
 |
 |
| Module-wise count rates for Quadrant D Data is divided into 100 sec bins |
 |
 |
| Parameter | Plot |
|---|---|
| CZT HV Monitor | 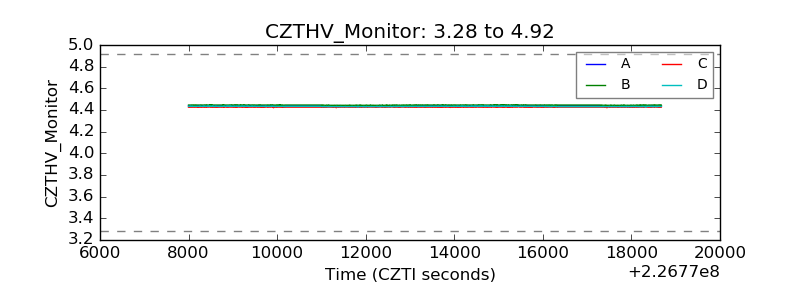 |
| D_VDD | 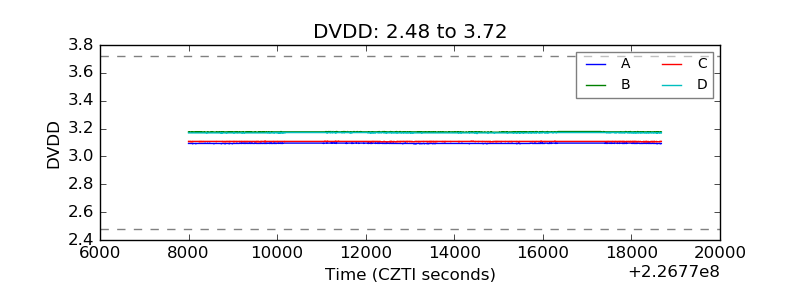 |
| Temperature 1 |  |
| Veto HV Monitor | 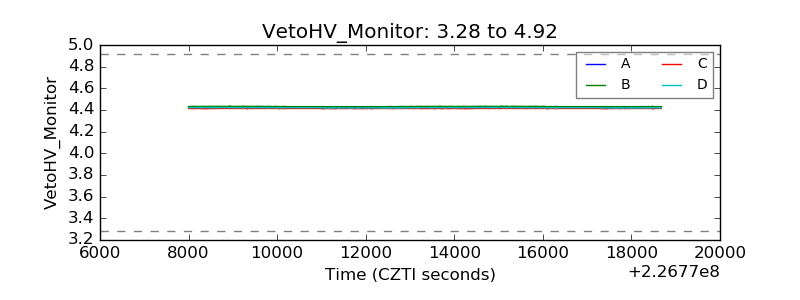 |
| Veto LLD | 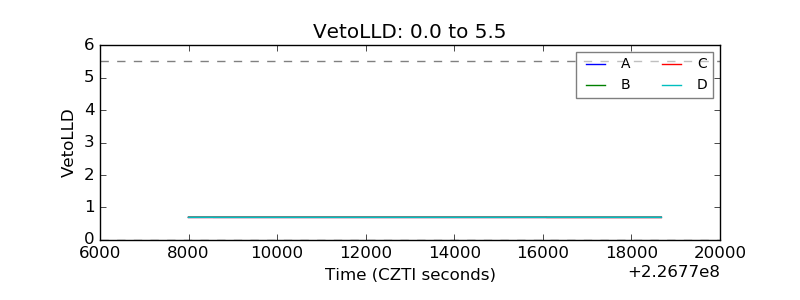 |
| Alpha Counter | 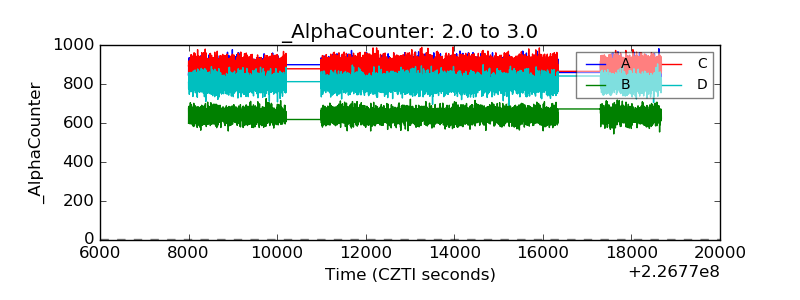 |
| _CPM_Rate | 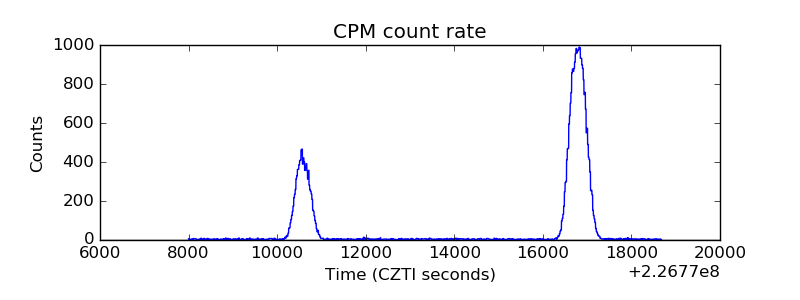 |
| CZT Counter | 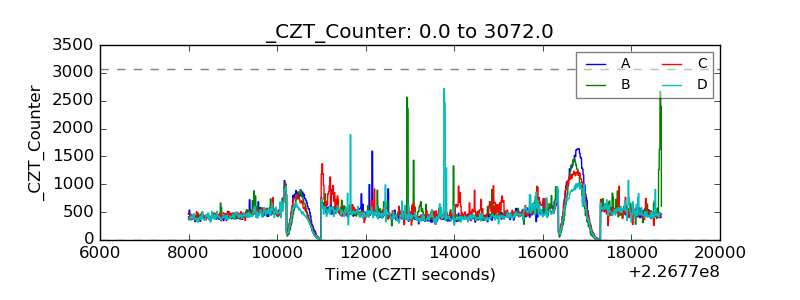 |
| +2.5 Volts monitor |  |
| +5 Volts monitor |  |
| _ROLL_ROT | 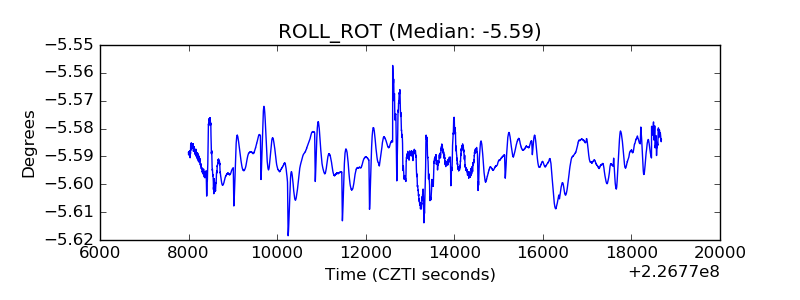 |
| _Roll_DEC | 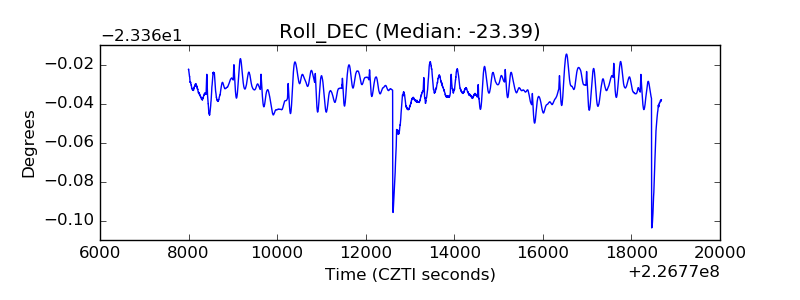 |
| _Roll_RA | 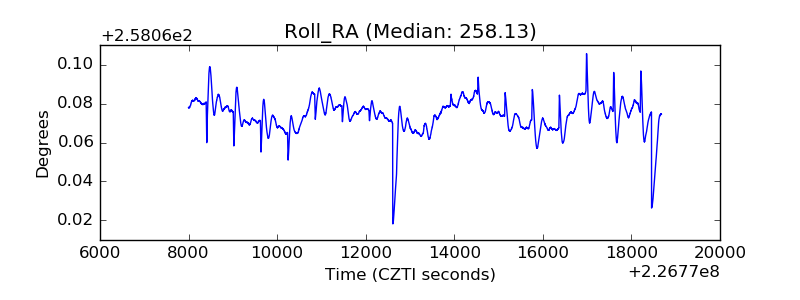 |
| Veto Counter | 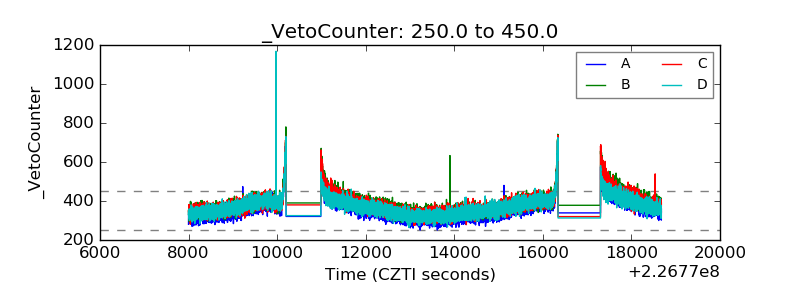 |