| Param | Original file | Final file |
|---|---|---|
| Filename | modeM0/AS1G06_077T02_9000001076_07827cztM0_level2.evt | modeM0/AS1G06_077T02_9000001076_07827cztM0_level2_quad_clean.evt |
| Size (bytes) | 436,089,600 | 94,501,440 |
| Size | 415.9 MB | 90.1 MB |
| Events in quadrant A | 3,029,002 | 602,266 |
| Events in quadrant B | 3,458,694 | 612,212 |
| Events in quadrant C | 3,133,082 | 611,426 |
| Events in quadrant D | 3,141,783 | 580,326 |
| Mode M9 | |||
|---|---|---|---|
| Quadrant | BADHDUFLAG | Total packets | Discarded packets |
| A | 0 | 11 | 0 |
| B | 0 | 11 | 0 |
| C | 0 | 11 | 0 |
| D | 0 | 11 | 0 |
| Mode M0 | |||
|---|---|---|---|
| Quadrant | BADHDUFLAG | Total packets | Discarded packets |
| A | 0 | 13374 | 3 |
| B | 0 | 14587 | 2 |
| C | 0 | 13578 | 2 |
| D | 0 | 13783 | 2 |
| Mode SS | |||
|---|---|---|---|
| Quadrant | BADHDUFLAG | Total packets | Discarded packets |
| A | 0 | 132 | 0 |
| B | 0 | 132 | 0 |
| C | 0 | 132 | 0 |
| D | 0 | 132 | 0 |
| Quadrant | Total seconds | Saturated seconds | Saturation percentage |
|---|---|---|---|
| A | 6538 | 18 | 0.275314% |
| B | 6538 | 119 | 1.820128% |
| C | 6538 | 16 | 0.244723% |
| D | 6538 | 21 | 0.321199% |
Noise dominated data is calculated using 1-second bins in cleaned event files. If a bin has >2000 counts, and if more than 50% of those come from <1% of pixels, then it is considered to be noise-dominated and hence unusable.
| Quadrant | # 1 sec bins | Bins with >0 counts | Bins with >2000 counts | High rate bins dominated by noise | Noise dominated (total time) | Noise dominated (detector-on time) | Marked lightcurve |
|---|---|---|---|---|---|---|---|
| A | 7638 | 6539 | 1 | 1 | 0.01% | 0.02% | 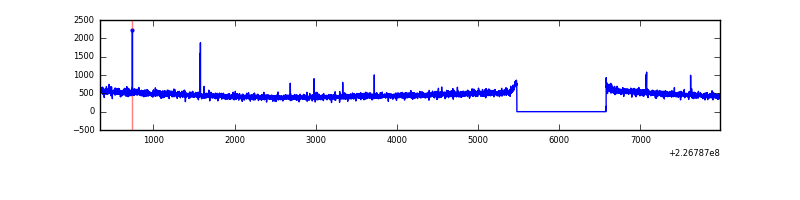 |
| B | 7638 | 6539 | 90 | 90 | 1.18% | 1.38% | 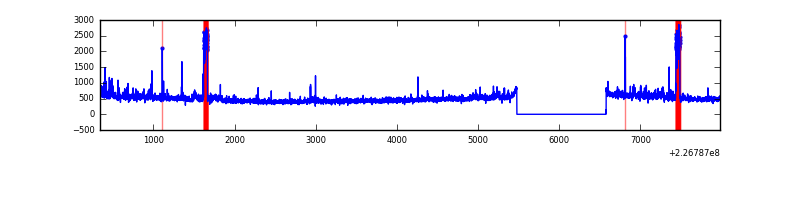 |
| C | 7638 | 6539 | 0 | 0 | 0.00% | 0.00% | 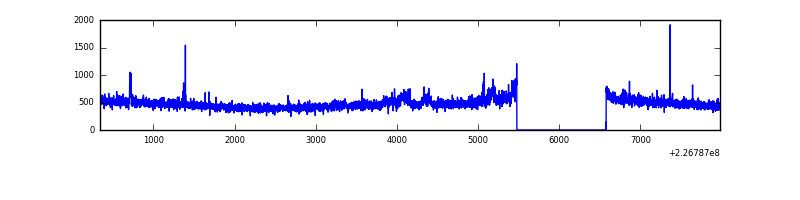 |
| D | 7638 | 6539 | 8 | 8 | 0.10% | 0.12% | 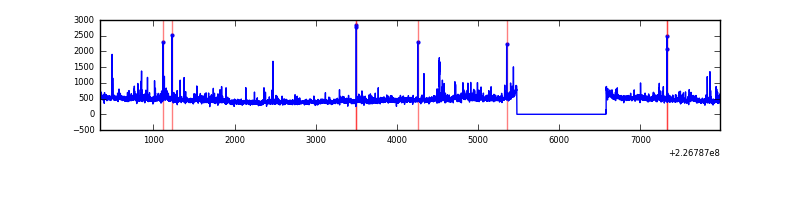 |
Top three noisy pixels from each quadrant. If the there are fewer than three noisy pixels in the level2.evt file, extra rows are filled as -1
| Pixel properties | Quadrant properties | ||||||
|---|---|---|---|---|---|---|---|
| Quadrant | DetID | PixID | Counts | Sigma | Mean | Median | Sigma |
| A | 15 | 234 | 12064 | 71.49 | 781 | 765 | 158.1 |
| A | 0 | 226 | 7295 | 41.32 | 781 | 765 | 158.1 |
| A | 12 | 194 | 6873 | 38.65 | 781 | 765 | 158.1 |
| B | 4 | 239 | 224678 | 1495.21 | 789 | 772 | 149.7 |
| B | 0 | 219 | 48364 | 317.81 | 789 | 772 | 149.7 |
| B | 15 | 204 | 35200 | 229.91 | 789 | 772 | 149.7 |
| C | 1 | 16 | 123264 | 681.55 | 769 | 774 | 179.7 |
| C | 12 | 4 | 11363 | 58.92 | 769 | 774 | 179.7 |
| C | 13 | 61 | 5835 | 28.16 | 769 | 774 | 179.7 |
| D | 5 | 233 | 88835 | 474.24 | 762 | 739 | 185.8 |
| D | 1 | 52 | 42832 | 226.59 | 762 | 739 | 185.8 |
| D | 2 | 152 | 40869 | 216.03 | 762 | 739 | 185.8 |
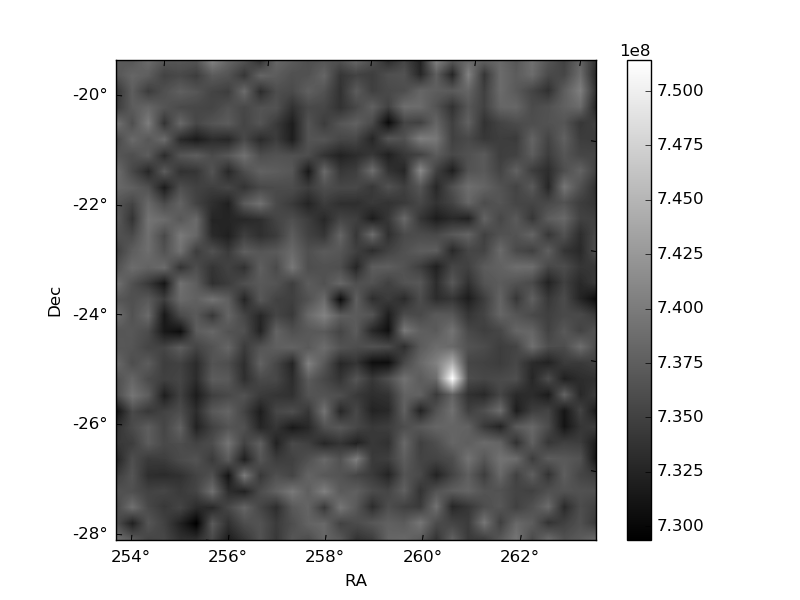
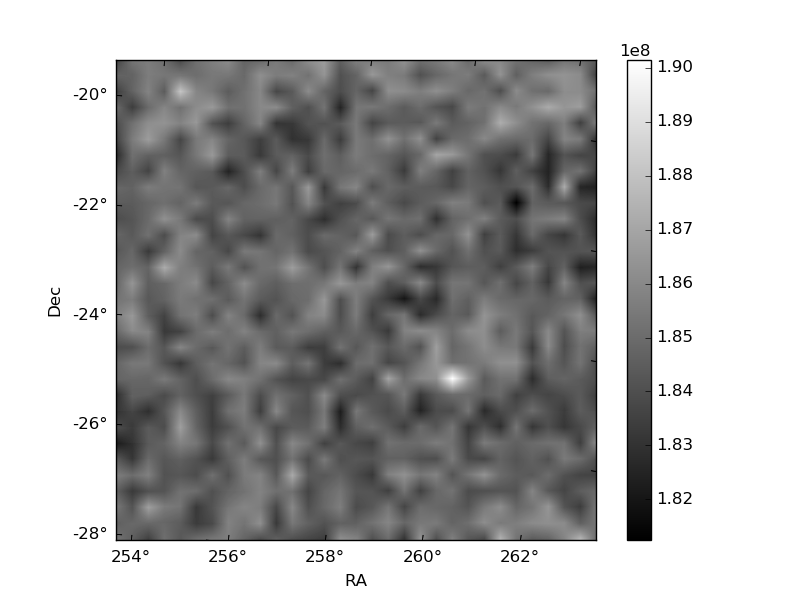
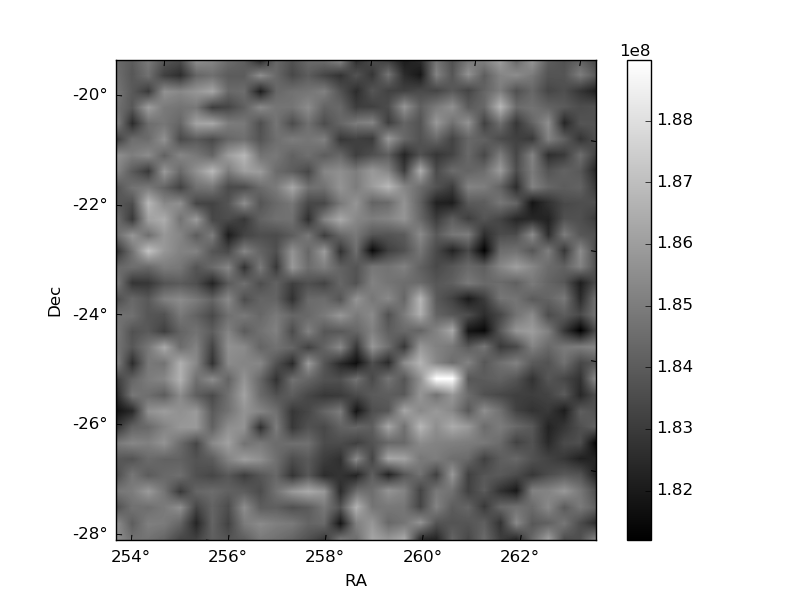
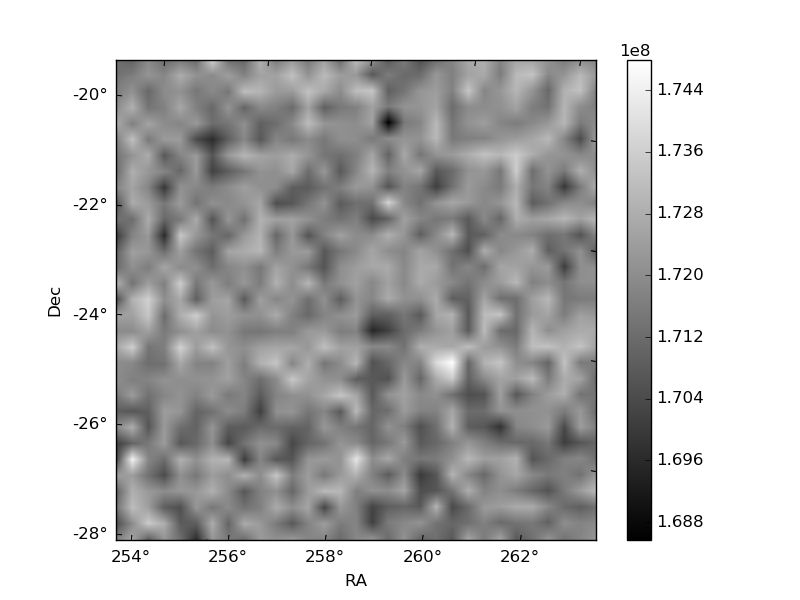
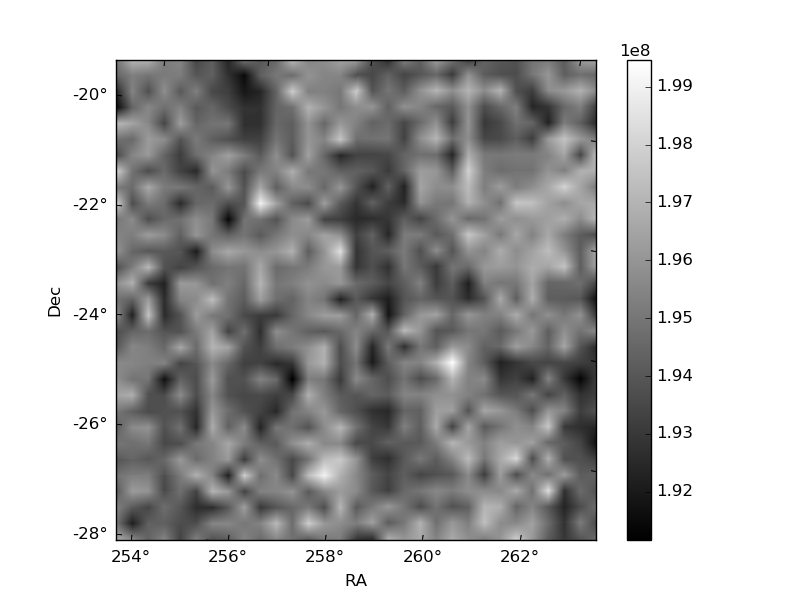
Histogram calculated using DETX and DETY for each event in the final _common_clean file
| Quadrant A | 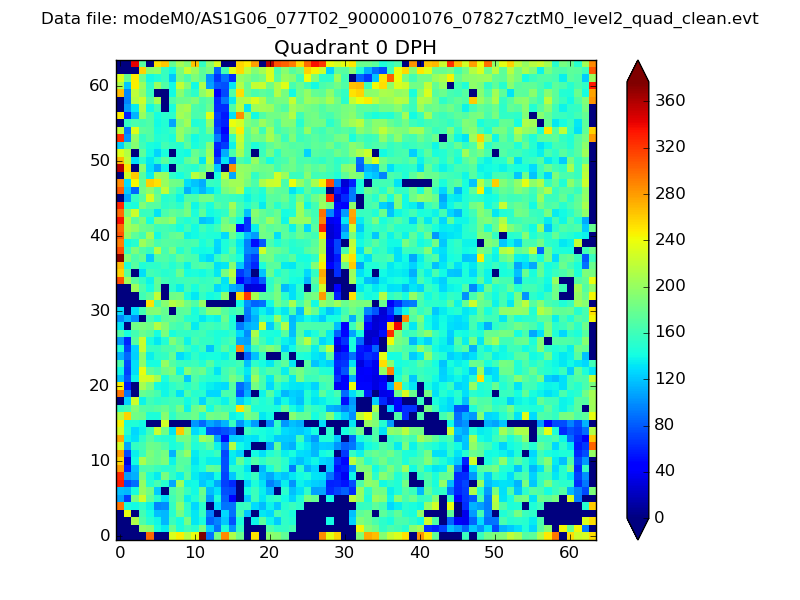 |
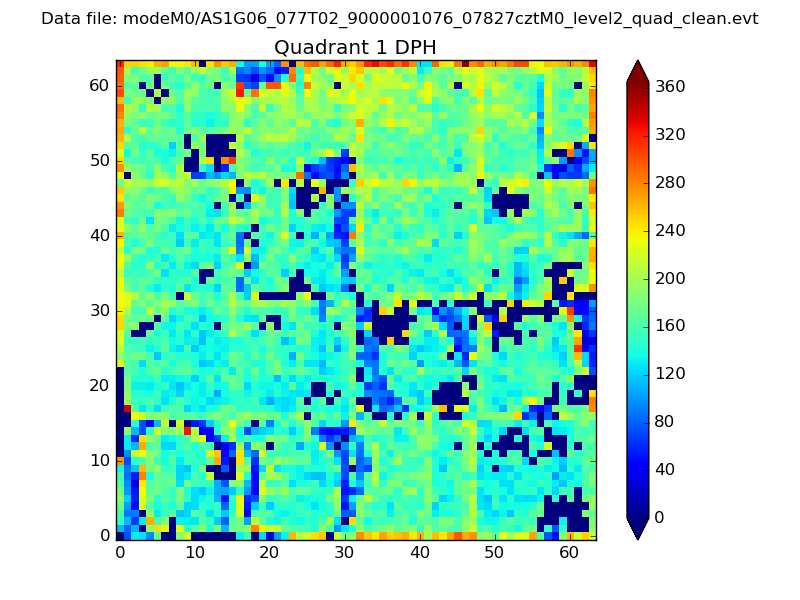 |
Quadrant B |
|---|---|---|---|
| Quadrant D | 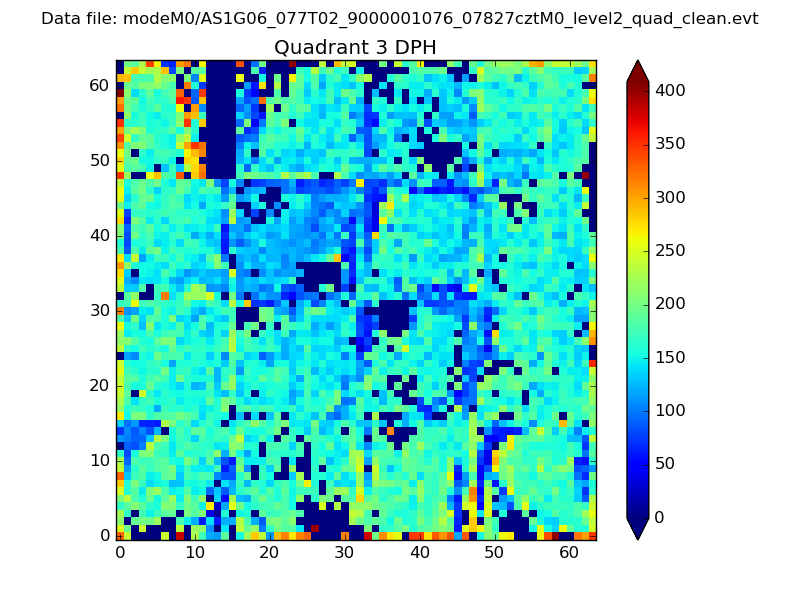 |
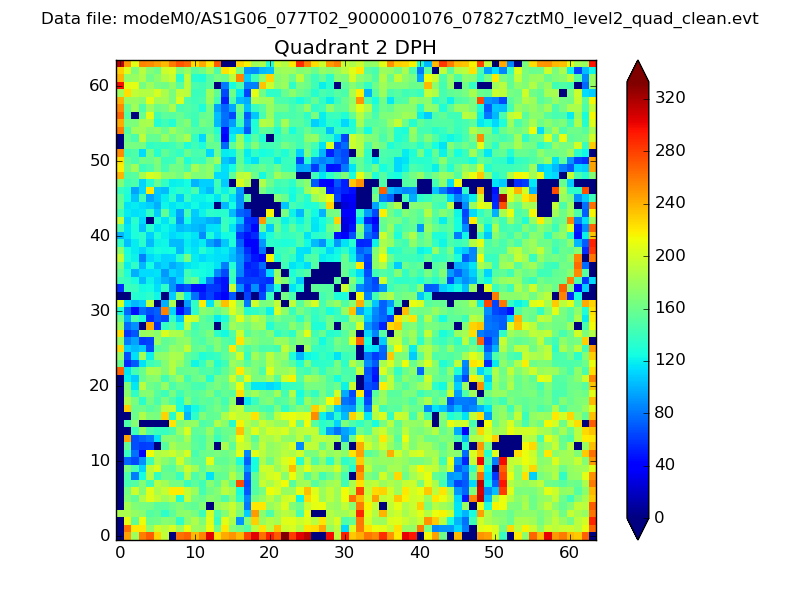 |
Quadrant C |
| Plot type | Count rate plots | Images |
|---|---|---|
| Comparison with Poisson distribution Blue bars denote a histogram of data divided into 1 sec bins. Red curve is a Poisson curve with rate = median count rate of data. |
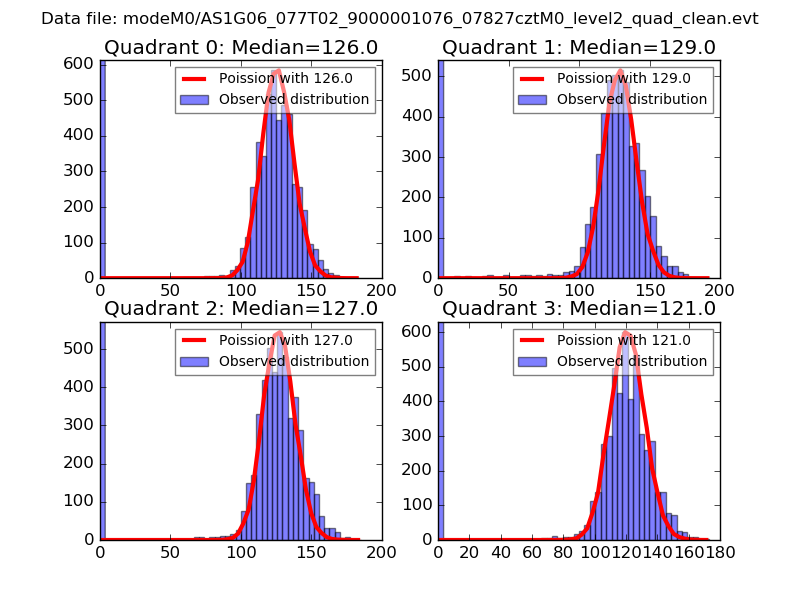 |
 |
| Quadrant-wise count rates Data is divided into 100 sec bins |
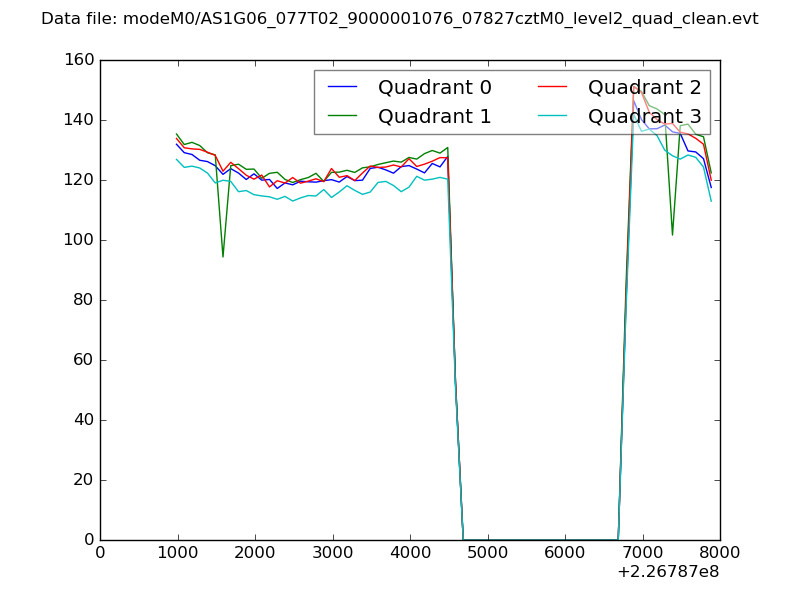 |
|
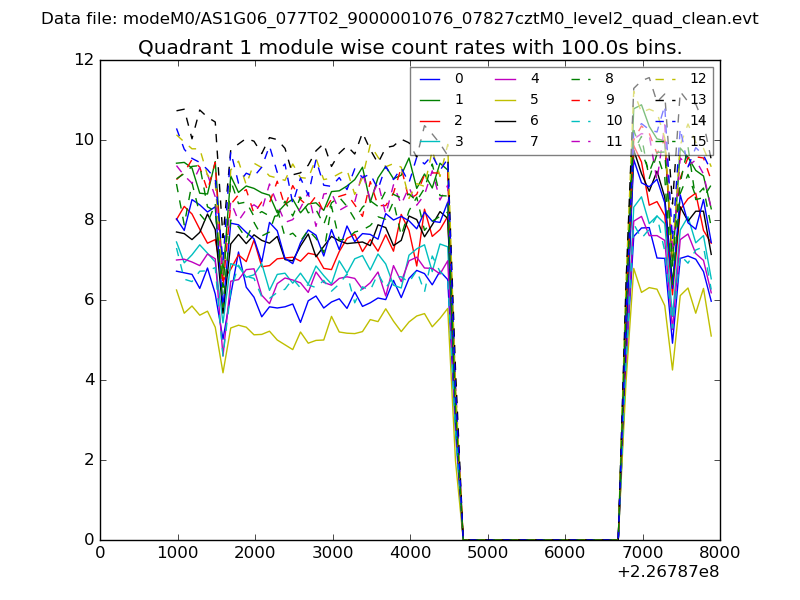
| Module-wise count rates for Quadrant A Data is divided into 100 sec bins |
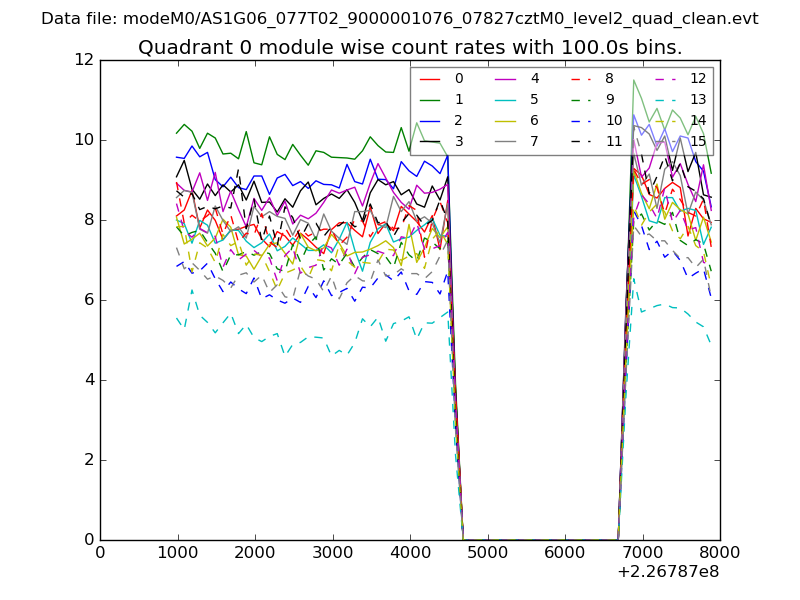 |
 |
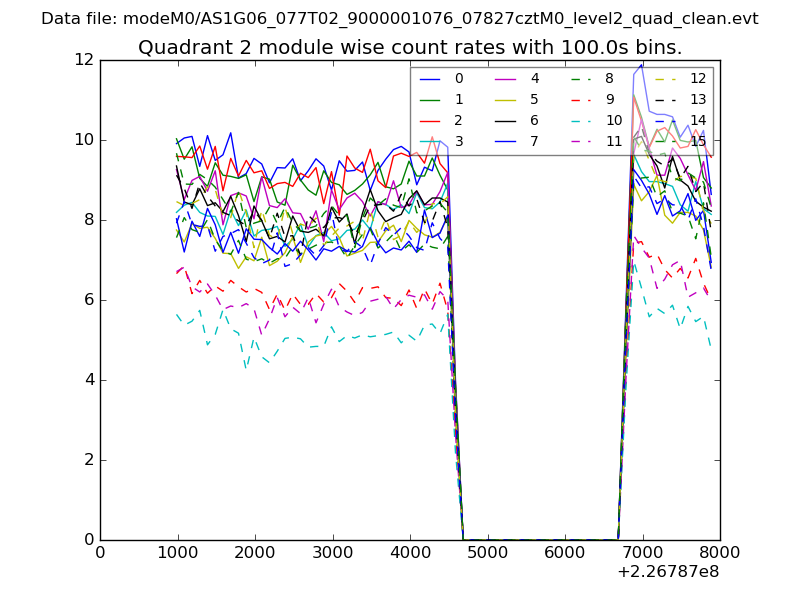
| Module-wise count rates for Quadrant B Data is divided into 100 sec bins |
 |
 |
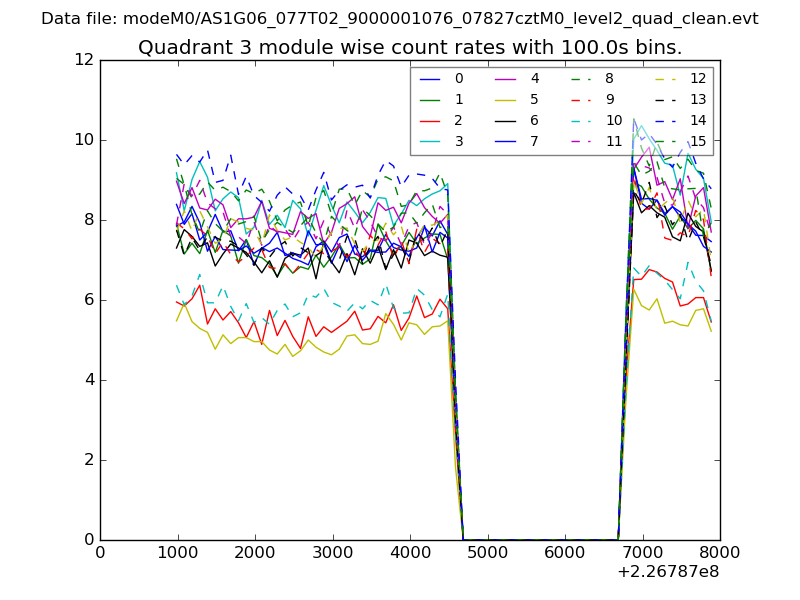
| Module-wise count rates for Quadrant C Data is divided into 100 sec bins |
 |
 |
| Module-wise count rates for Quadrant D Data is divided into 100 sec bins |
 |
 |
| Parameter | Plot |
|---|---|
| CZT HV Monitor | 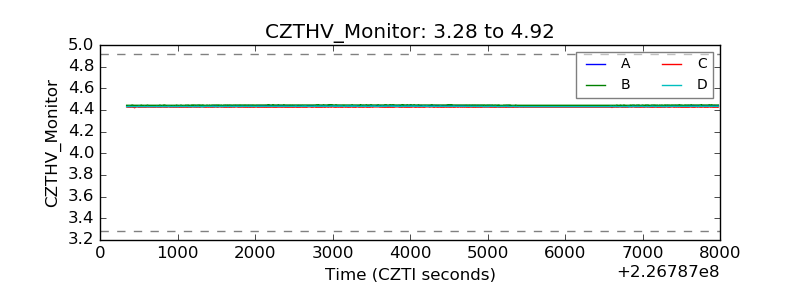 |
| D_VDD | 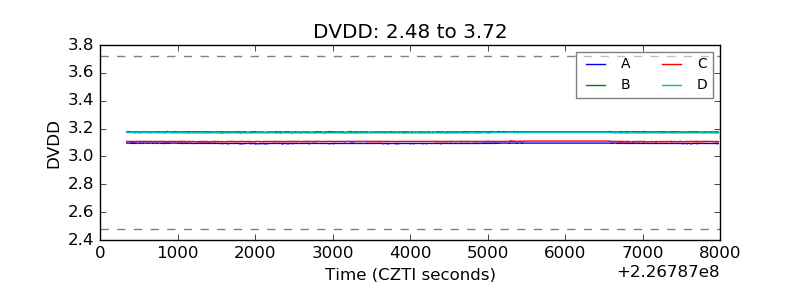 |
| Temperature 1 | 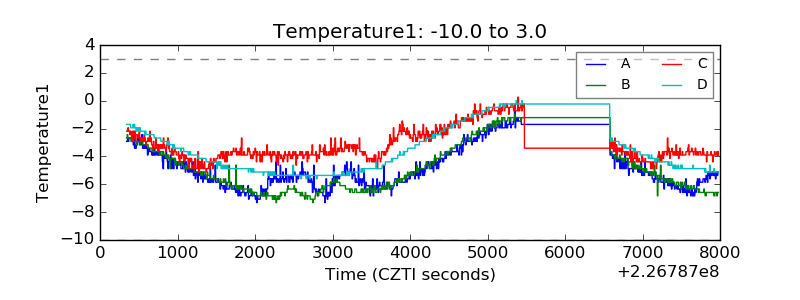 |
| Veto HV Monitor | 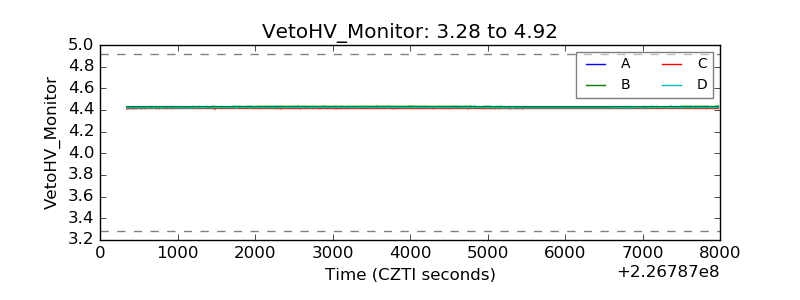 |
| Veto LLD | 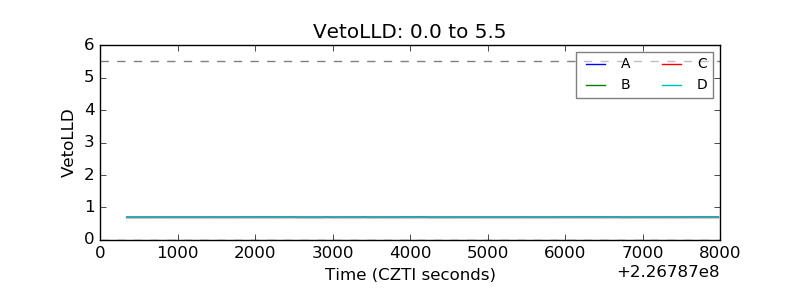 |
| Alpha Counter | 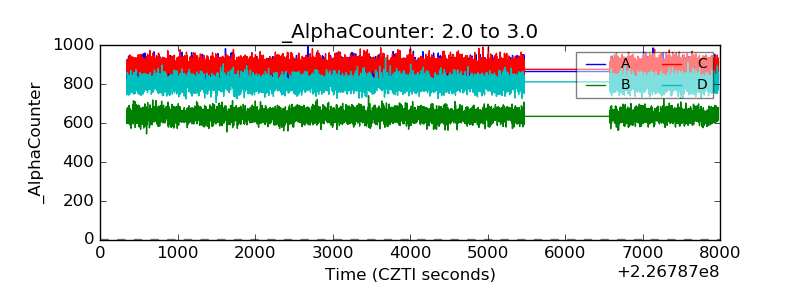 |
| _CPM_Rate | 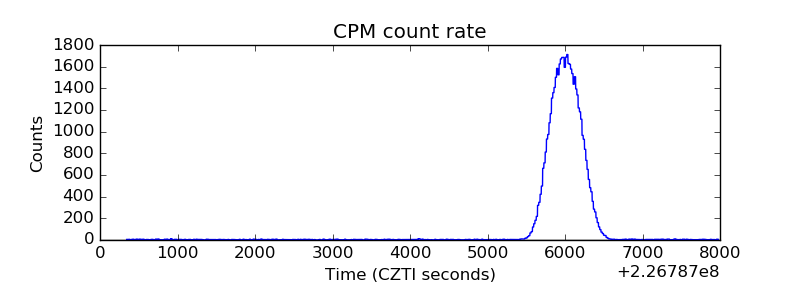 |
| CZT Counter | 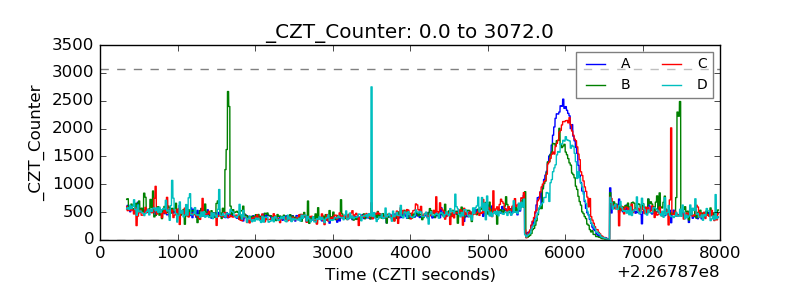 |
| +2.5 Volts monitor |  |
| +5 Volts monitor |  |
| _ROLL_ROT | 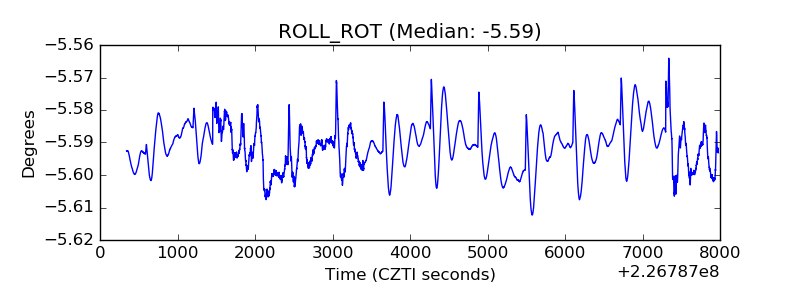 |
| _Roll_DEC |  |
| _Roll_RA | 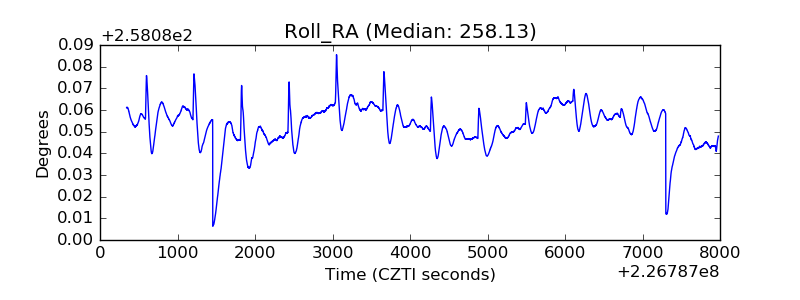 |
| Veto Counter | 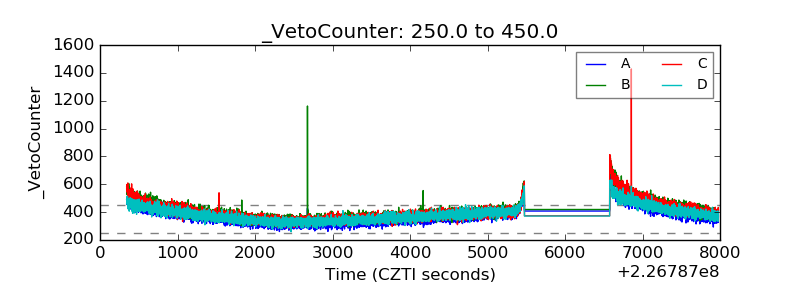 |