| Param | Original file | Final file |
|---|---|---|
| Filename | modeM0/AS1G06_077T02_9000001076_07828cztM0_level2.evt | modeM0/AS1G06_077T02_9000001076_07828cztM0_level2_quad_clean.evt |
| Size (bytes) | 448,989,120 | 100,869,120 |
| Size | 428.2 MB | 96.2 MB |
| Events in quadrant A | 2,997,884 | 651,578 |
| Events in quadrant B | 3,353,907 | 671,796 |
| Events in quadrant C | 3,683,893 | 661,348 |
| Events in quadrant D | 3,130,827 | 627,543 |
| Mode M9 | |||
|---|---|---|---|
| Quadrant | BADHDUFLAG | Total packets | Discarded packets |
| A | 0 | 12 | 0 |
| B | 0 | 12 | 0 |
| C | 0 | 12 | 0 |
| D | 0 | 12 | 0 |
| Mode M0 | |||
|---|---|---|---|
| Quadrant | BADHDUFLAG | Total packets | Discarded packets |
| A | 0 | 13117 | 3 |
| B | 0 | 14199 | 2 |
| C | 0 | 15130 | 2 |
| D | 0 | 13687 | 2 |
| Mode SS | |||
|---|---|---|---|
| Quadrant | BADHDUFLAG | Total packets | Discarded packets |
| A | 0 | 130 | 0 |
| B | 0 | 130 | 0 |
| C | 0 | 130 | 0 |
| D | 0 | 130 | 0 |
| Quadrant | Total seconds | Saturated seconds | Saturation percentage |
|---|---|---|---|
| A | 6340 | 24 | 0.378549% |
| B | 6340 | 107 | 1.687697% |
| C | 6340 | 85 | 1.340694% |
| D | 6341 | 30 | 0.473111% |
Noise dominated data is calculated using 1-second bins in cleaned event files. If a bin has >2000 counts, and if more than 50% of those come from <1% of pixels, then it is considered to be noise-dominated and hence unusable.
| Quadrant | # 1 sec bins | Bins with >0 counts | Bins with >2000 counts | High rate bins dominated by noise | Noise dominated (total time) | Noise dominated (detector-on time) | Marked lightcurve |
|---|---|---|---|---|---|---|---|
| A | 7525 | 6341 | 3 | 3 | 0.04% | 0.05% | 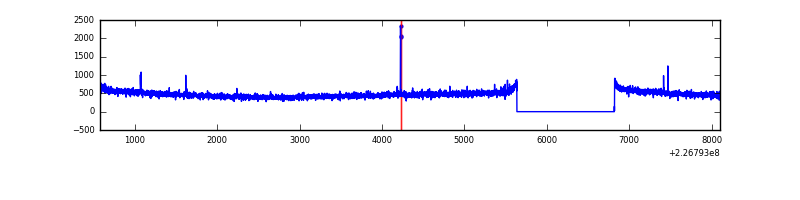 |
| B | 7525 | 6341 | 77 | 77 | 1.02% | 1.21% | 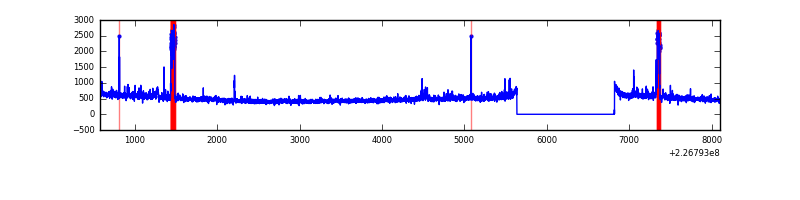 |
| C | 7525 | 6341 | 15 | 15 | 0.20% | 0.24% | 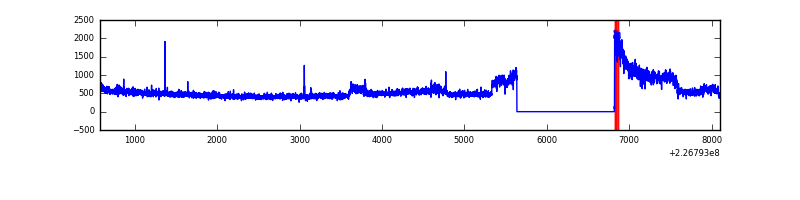 |
| D | 7526 | 6342 | 9 | 9 | 0.12% | 0.14% | 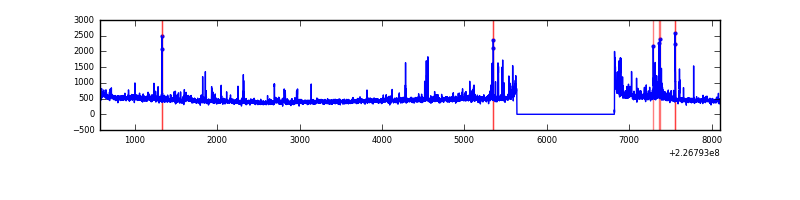 |
Top three noisy pixels from each quadrant. If the there are fewer than three noisy pixels in the level2.evt file, extra rows are filled as -1
| Pixel properties | Quadrant properties | ||||||
|---|---|---|---|---|---|---|---|
| Quadrant | DetID | PixID | Counts | Sigma | Mean | Median | Sigma |
| A | 15 | 234 | 20374 | 126.29 | 771 | 756 | 155.3 |
| A | 0 | 226 | 7306 | 42.16 | 771 | 756 | 155.3 |
| A | 12 | 194 | 6669 | 38.06 | 771 | 756 | 155.3 |
| B | 4 | 239 | 194902 | 1324.29 | 782 | 766 | 146.6 |
| B | 0 | 219 | 43839 | 293.82 | 782 | 766 | 146.6 |
| B | 4 | 81 | 28235 | 187.38 | 782 | 766 | 146.6 |
| C | 1 | 16 | 692512 | 3918.57 | 762 | 771 | 176.5 |
| C | 14 | 234 | 9972 | 52.12 | 762 | 771 | 176.5 |
| C | 12 | 4 | 8876 | 45.91 | 762 | 771 | 176.5 |
| D | 5 | 233 | 114246 | 624.36 | 751 | 729 | 181.8 |
| D | 13 | 105 | 39325 | 212.28 | 751 | 729 | 181.8 |
| D | 1 | 52 | 33917 | 182.54 | 751 | 729 | 181.8 |
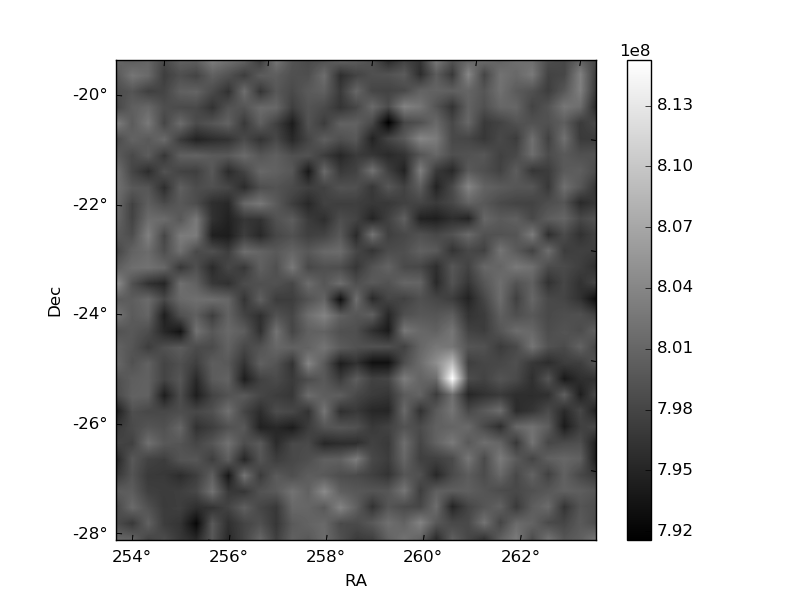
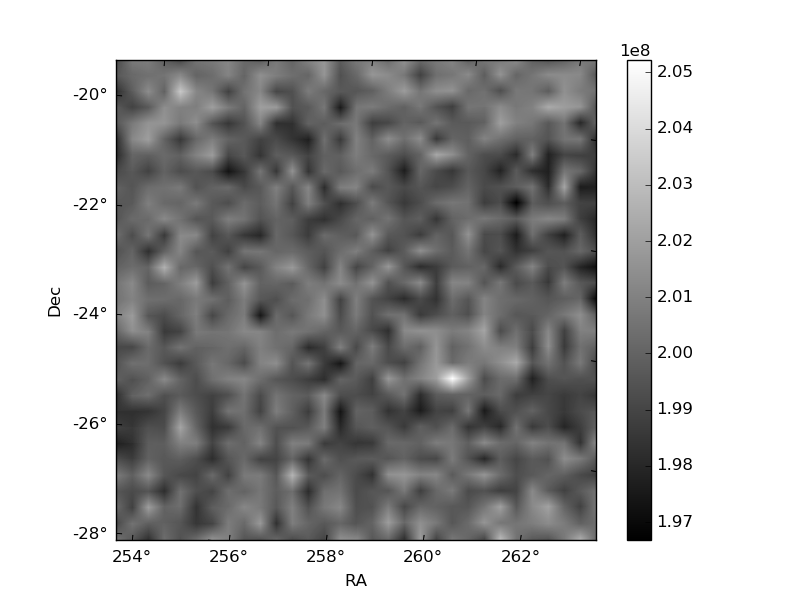
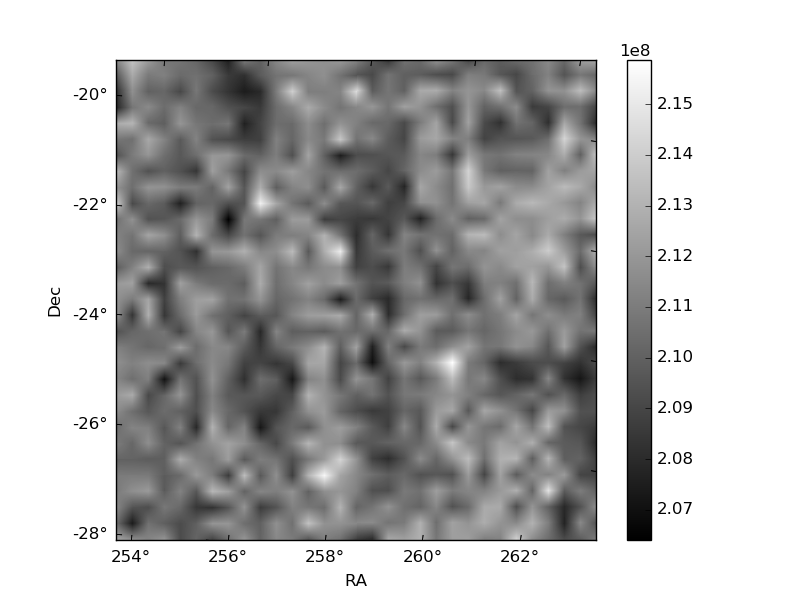
Histogram calculated using DETX and DETY for each event in the final _common_clean file
| Quadrant A | 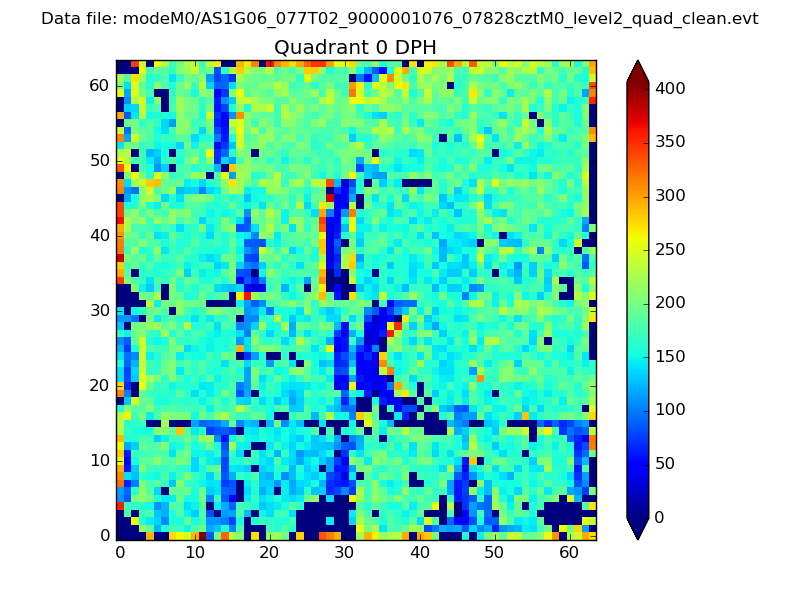 |
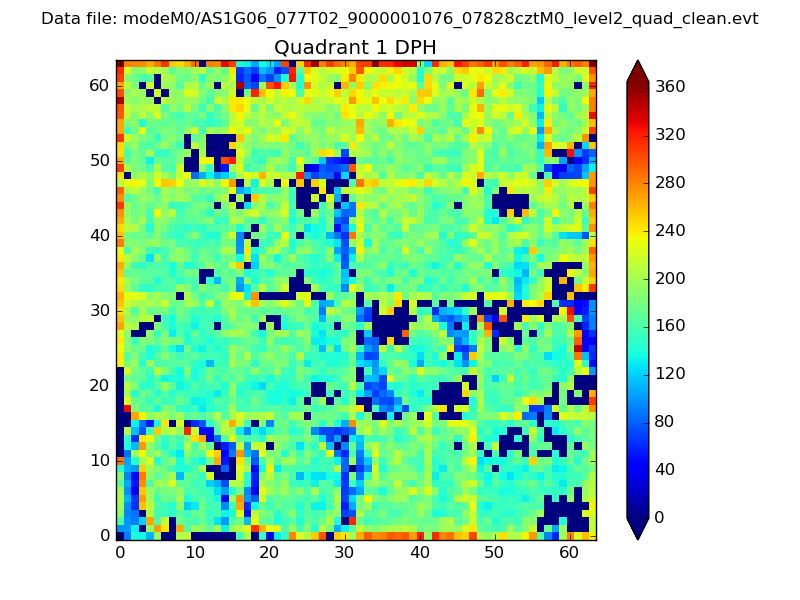 |
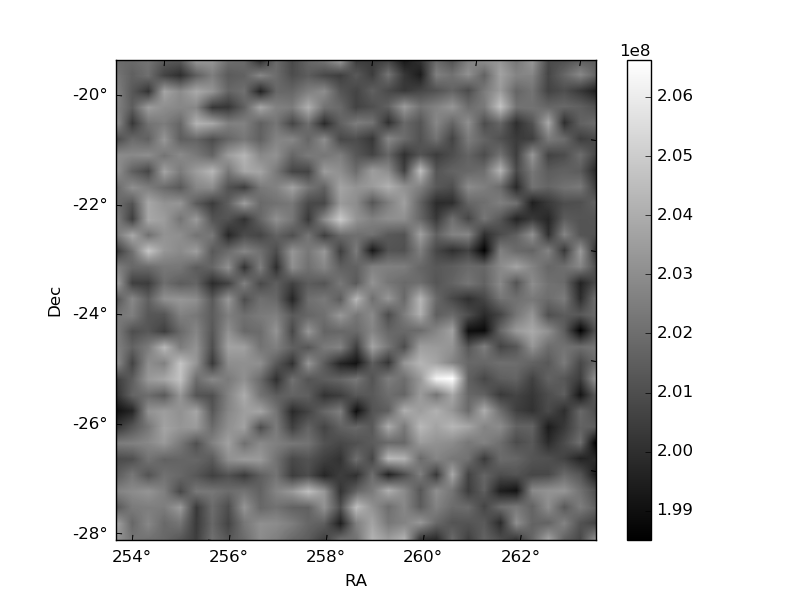
Quadrant B |
|---|---|---|---|
| Quadrant D | 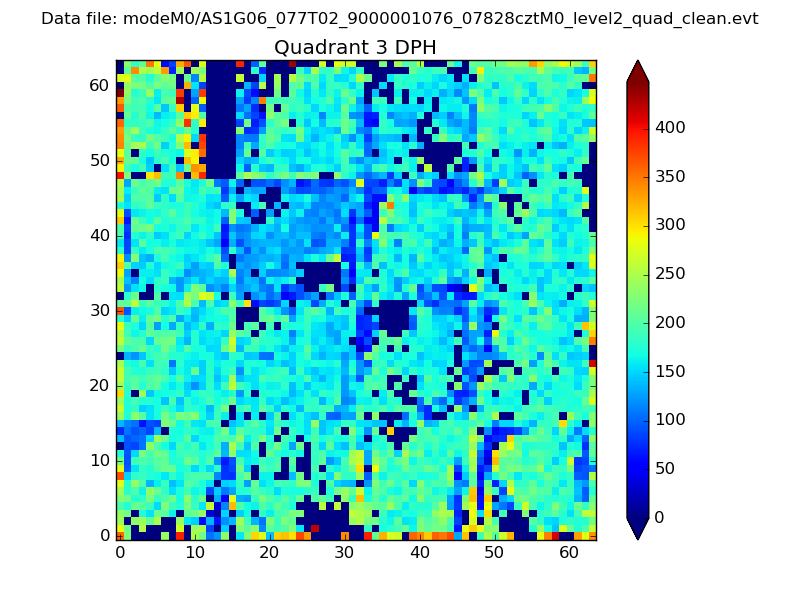 |
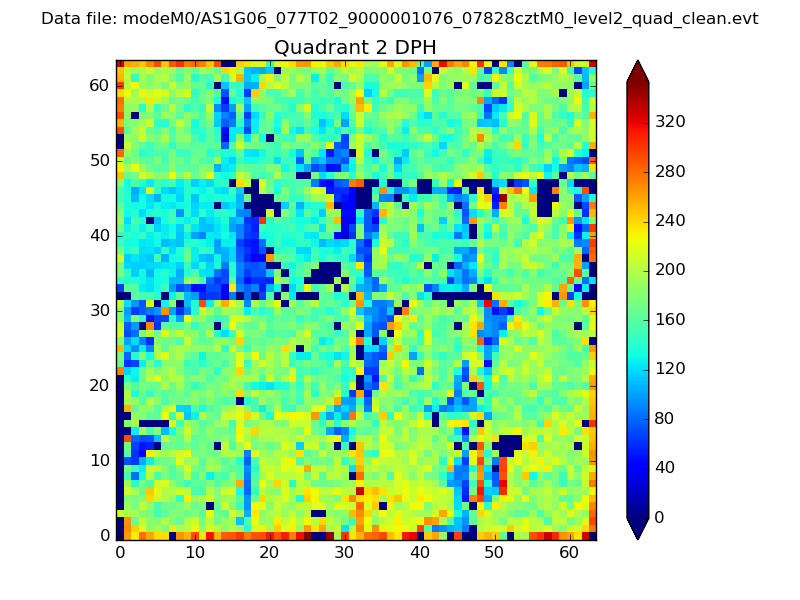 |
Quadrant C |
| Plot type | Count rate plots | Images |
|---|---|---|
| Comparison with Poisson distribution Blue bars denote a histogram of data divided into 1 sec bins. Red curve is a Poisson curve with rate = median count rate of data. |
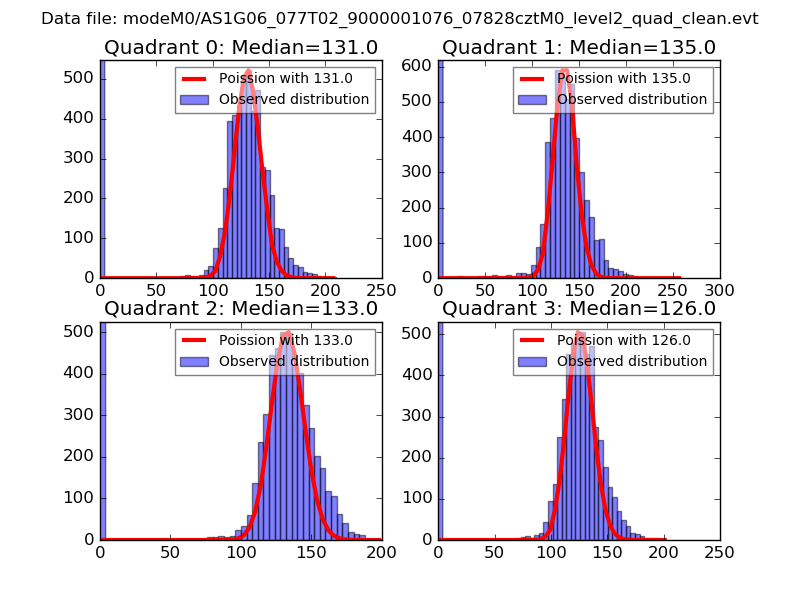 |
 |
| Quadrant-wise count rates Data is divided into 100 sec bins |
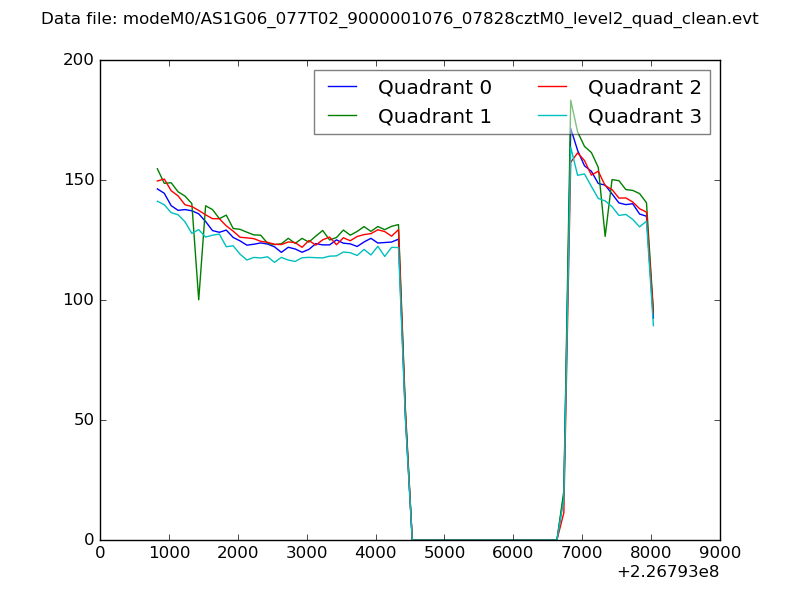 |
|
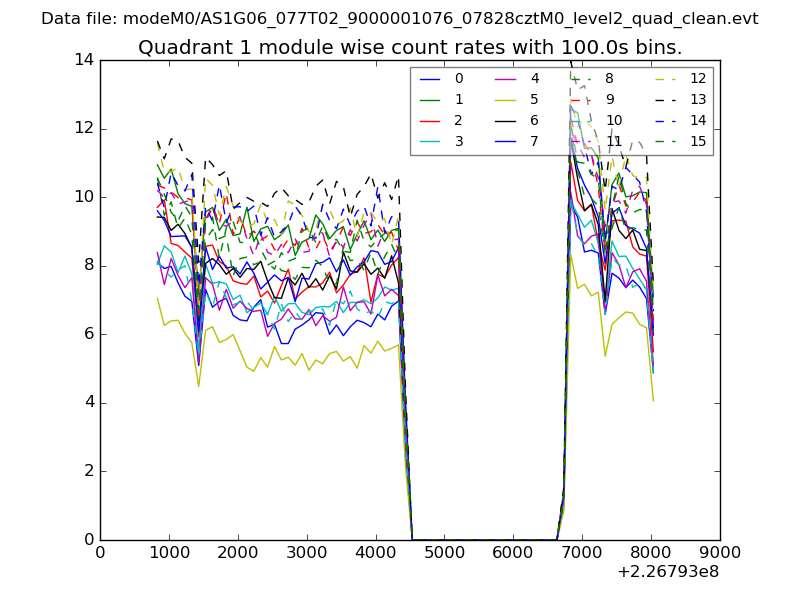
| Module-wise count rates for Quadrant A Data is divided into 100 sec bins |
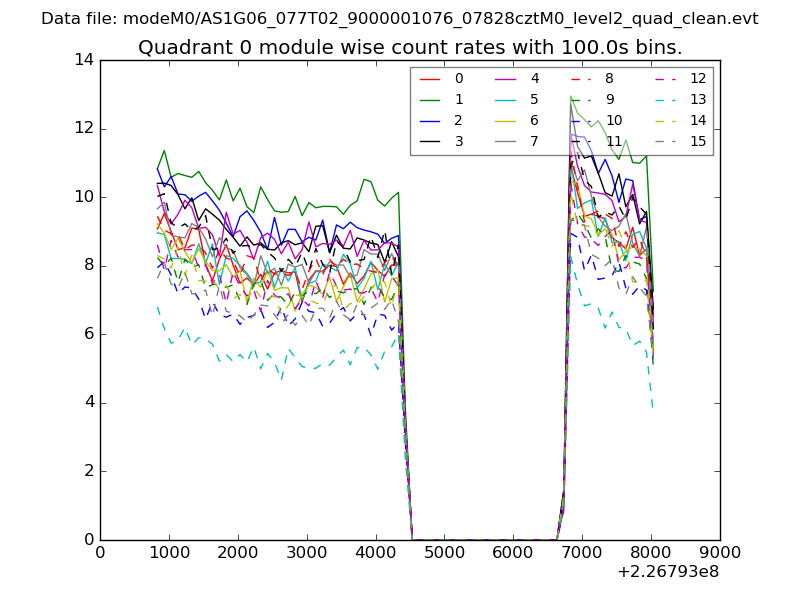 |
 |
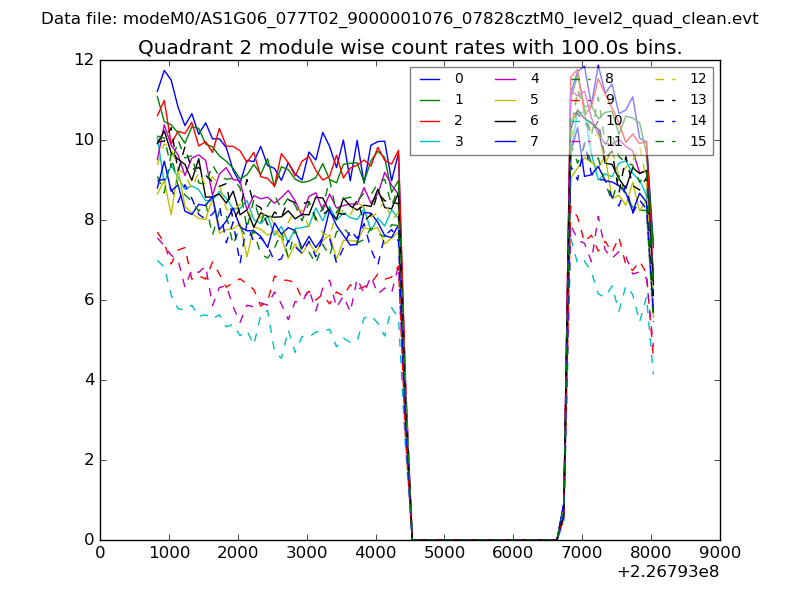
| Module-wise count rates for Quadrant B Data is divided into 100 sec bins |
 |
 |
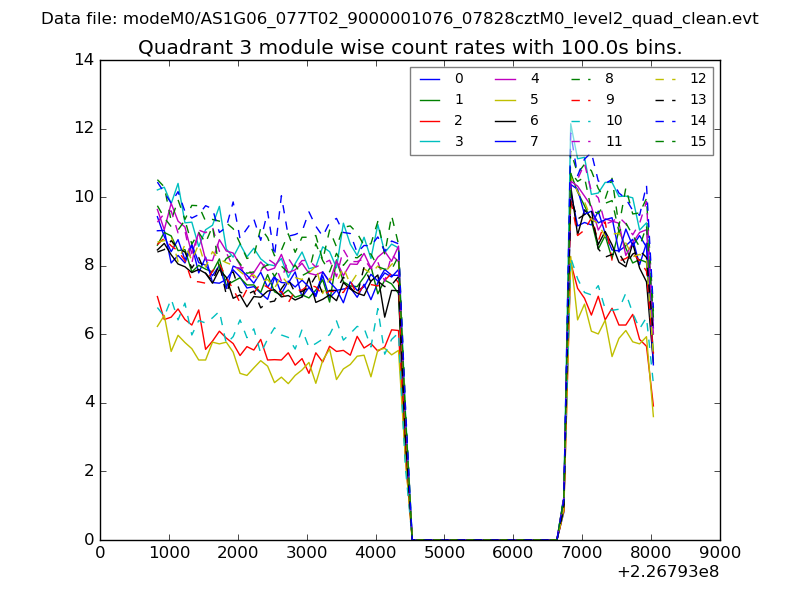
| Module-wise count rates for Quadrant C Data is divided into 100 sec bins |
 |
 |
| Module-wise count rates for Quadrant D Data is divided into 100 sec bins |
 |
 |
| Parameter | Plot |
|---|---|
| CZT HV Monitor | 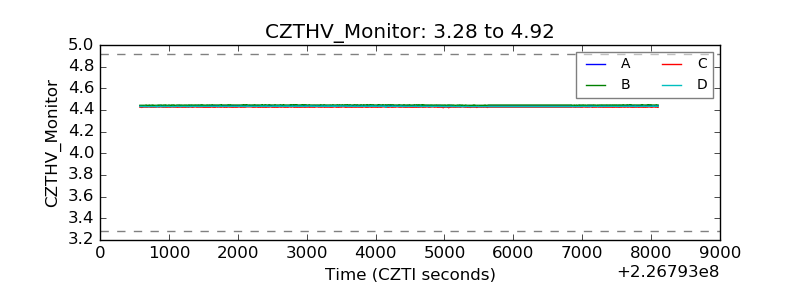 |
| D_VDD |  |
| Temperature 1 | 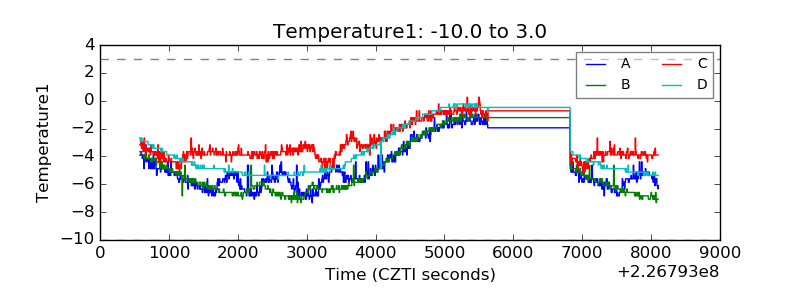 |
| Veto HV Monitor | 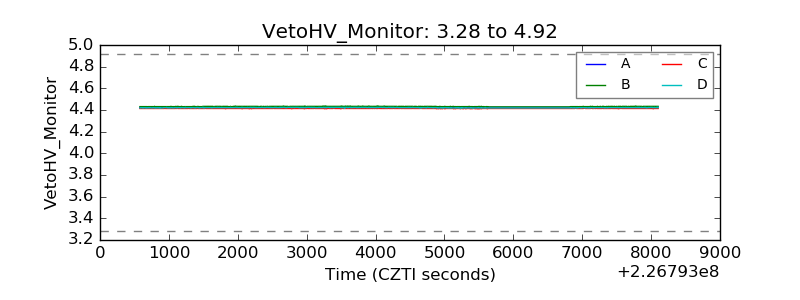 |
| Veto LLD | 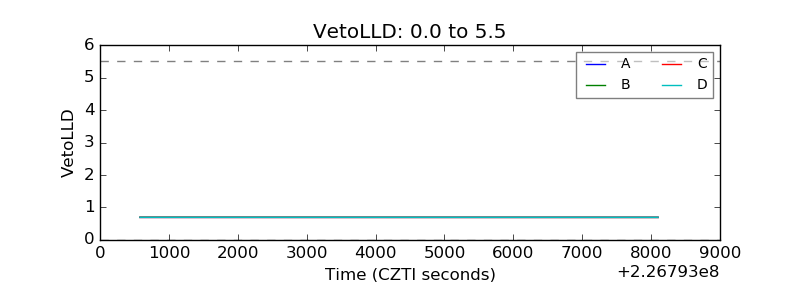 |
| Alpha Counter | 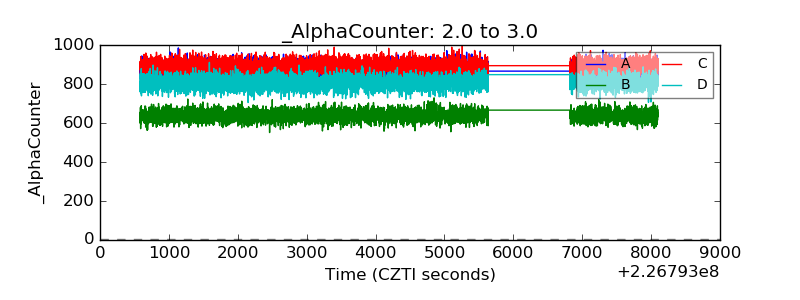 |
| _CPM_Rate | 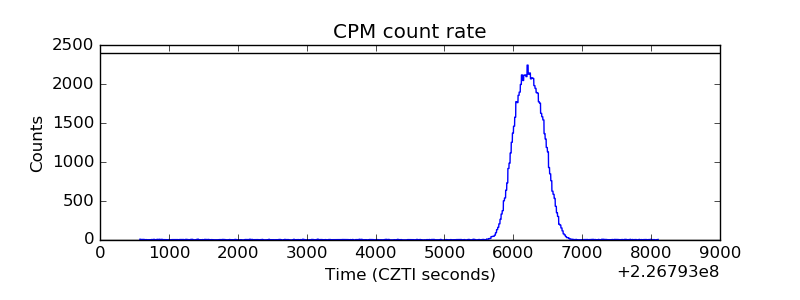 |
| CZT Counter | 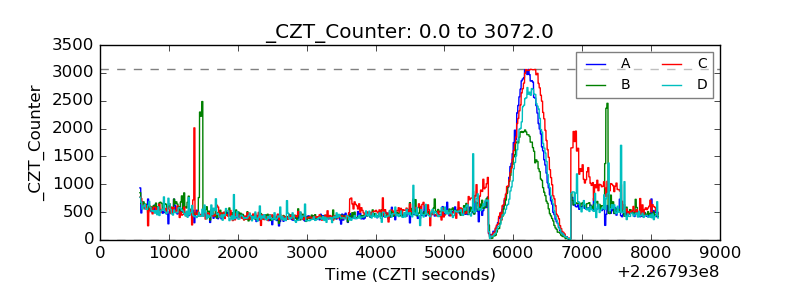 |
| +2.5 Volts monitor |  |
| +5 Volts monitor |  |
| _ROLL_ROT | 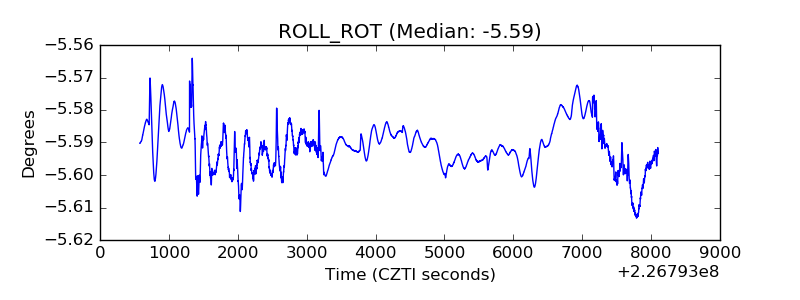 |
| _Roll_DEC | 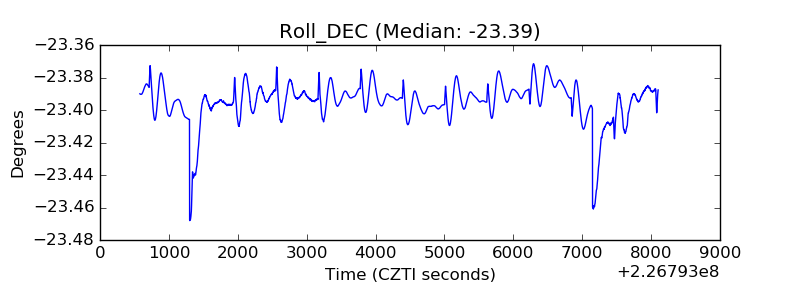 |
| _Roll_RA | 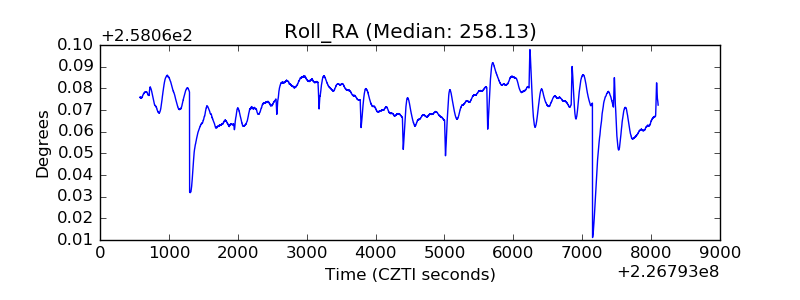 |
| Veto Counter | 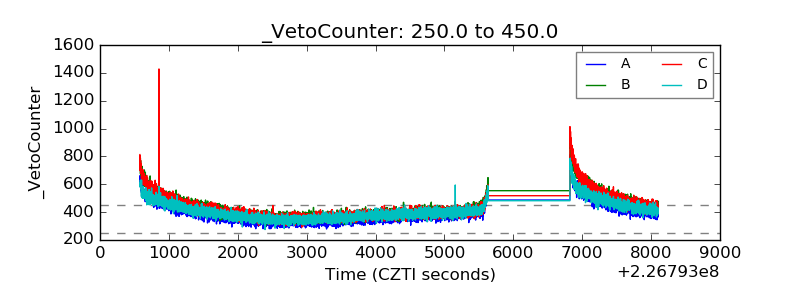 |