| Param | Original file | Final file |
|---|---|---|
| Filename | modeM0/AS1G06_077T02_9000001076_07829cztM0_level2.evt | modeM0/AS1G06_077T02_9000001076_07829cztM0_level2_quad_clean.evt |
| Size (bytes) | 454,720,320 | 101,926,080 |
| Size | 433.7 MB | 97.2 MB |
| Events in quadrant A | 3,044,536 | 659,330 |
| Events in quadrant B | 3,438,617 | 681,267 |
| Events in quadrant C | 3,591,010 | 671,519 |
| Events in quadrant D | 3,269,278 | 635,223 |
| Mode M9 | |||
|---|---|---|---|
| Quadrant | BADHDUFLAG | Total packets | Discarded packets |
| A | 0 | 16 | 0 |
| B | 0 | 16 | 0 |
| C | 0 | 16 | 0 |
| D | 0 | 17 | 0 |
| Mode M0 | |||
|---|---|---|---|
| Quadrant | BADHDUFLAG | Total packets | Discarded packets |
| A | 0 | 13143 | 3 |
| B | 0 | 14232 | 2 |
| C | 0 | 14728 | 2 |
| D | 0 | 14046 | 2 |
| Mode SS | |||
|---|---|---|---|
| Quadrant | BADHDUFLAG | Total packets | Discarded packets |
| A | 0 | 128 | 0 |
| B | 0 | 128 | 0 |
| C | 0 | 128 | 0 |
| D | 0 | 128 | 0 |
| Quadrant | Total seconds | Saturated seconds | Saturation percentage |
|---|---|---|---|
| A | 6298 | 40 | 0.635122% |
| B | 6298 | 113 | 1.794220% |
| C | 6298 | 96 | 1.524293% |
| D | 6298 | 56 | 0.889171% |
Noise dominated data is calculated using 1-second bins in cleaned event files. If a bin has >2000 counts, and if more than 50% of those come from <1% of pixels, then it is considered to be noise-dominated and hence unusable.
| Quadrant | # 1 sec bins | Bins with >0 counts | Bins with >2000 counts | High rate bins dominated by noise | Noise dominated (total time) | Noise dominated (detector-on time) | Marked lightcurve |
|---|---|---|---|---|---|---|---|
| A | 7543 | 6299 | 0 | 0 | 0.00% | 0.00% | 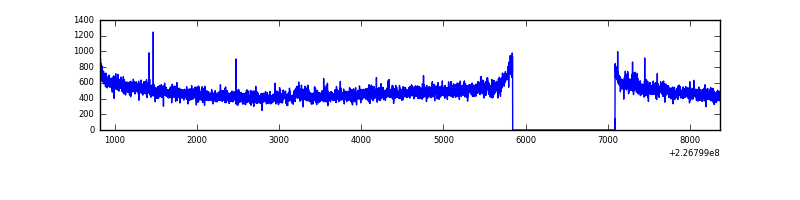 |
| B | 7543 | 6299 | 54 | 54 | 0.72% | 0.86% | 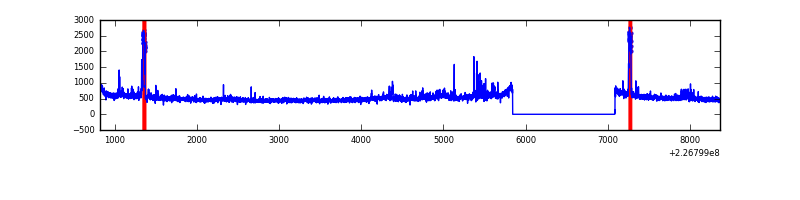 |
| C | 7543 | 6299 | 18 | 18 | 0.24% | 0.29% | 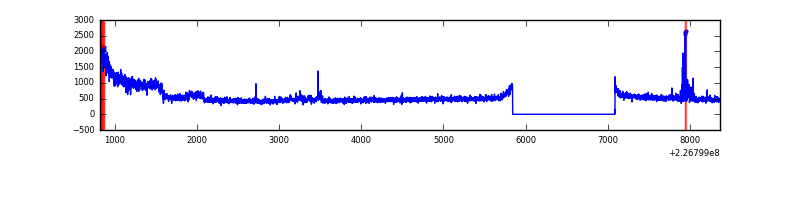 |
| D | 7543 | 6299 | 32 | 32 | 0.42% | 0.51% | 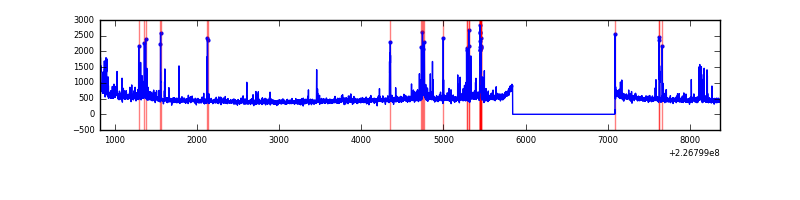 |
Top three noisy pixels from each quadrant. If the there are fewer than three noisy pixels in the level2.evt file, extra rows are filled as -1
| Pixel properties | Quadrant properties | ||||||
|---|---|---|---|---|---|---|---|
| Quadrant | DetID | PixID | Counts | Sigma | Mean | Median | Sigma |
| A | 15 | 239 | 24930 | 153.56 | 780 | 767 | 157.4 |
| A | 8 | 15 | 9040 | 52.58 | 780 | 767 | 157.4 |
| A | 0 | 226 | 7306 | 41.56 | 780 | 767 | 157.4 |
| B | 4 | 239 | 149719 | 1010.57 | 792 | 775 | 147.4 |
| B | 0 | 219 | 82216 | 552.57 | 792 | 775 | 147.4 |
| B | 0 | 214 | 37157 | 246.85 | 792 | 775 | 147.4 |
| C | 1 | 16 | 528610 | 2939.79 | 774 | 781 | 179.5 |
| C | 8 | 229 | 37421 | 204.07 | 774 | 781 | 179.5 |
| C | 13 | 61 | 5928 | 28.66 | 774 | 781 | 179.5 |
| D | 7 | 71 | 88811 | 477.18 | 762 | 742 | 184.6 |
| D | 13 | 105 | 58419 | 312.51 | 762 | 742 | 184.6 |
| D | 5 | 233 | 54113 | 289.18 | 762 | 742 | 184.6 |
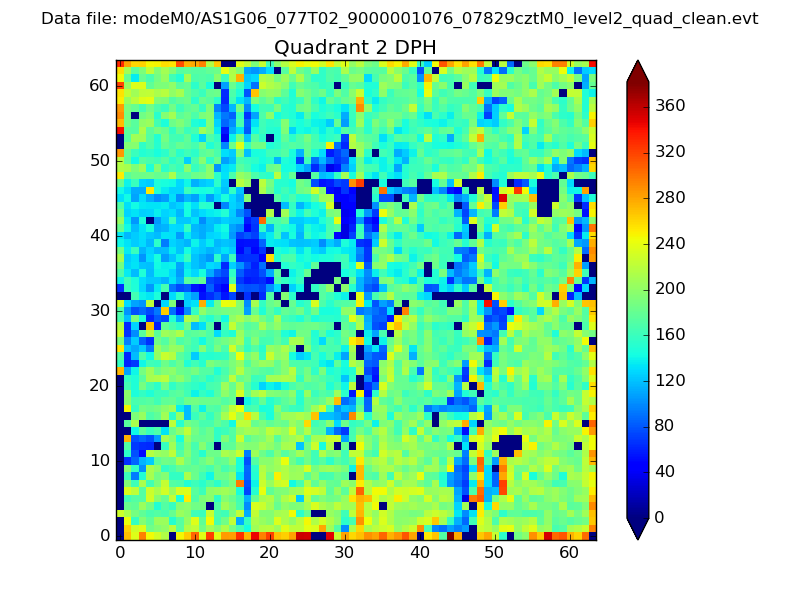
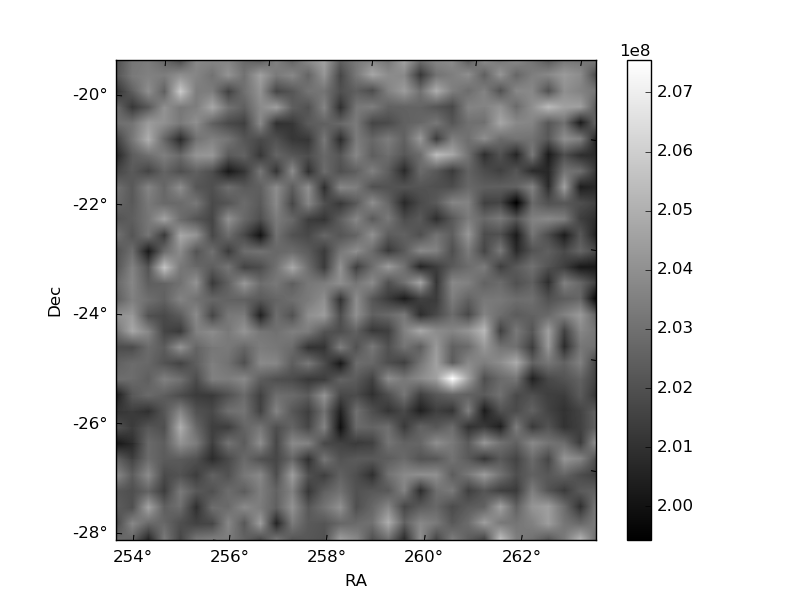
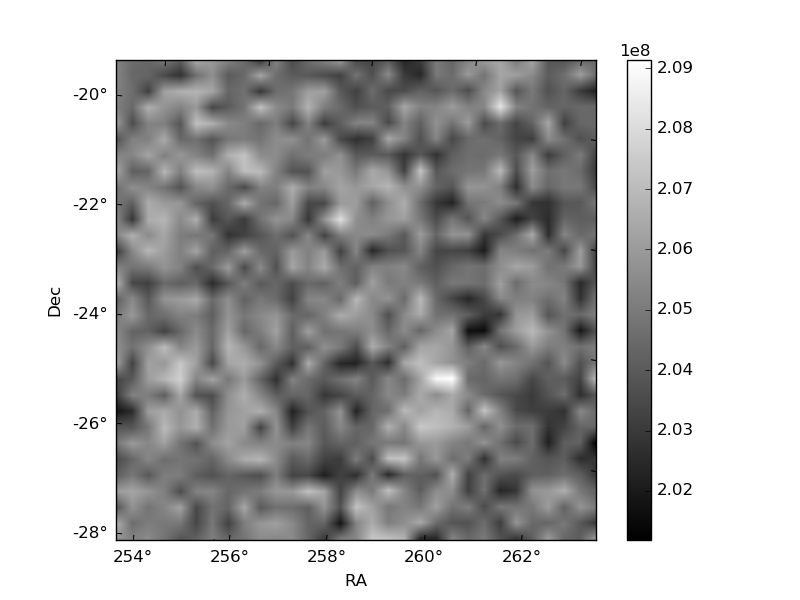
Histogram calculated using DETX and DETY for each event in the final _common_clean file
| Quadrant A | 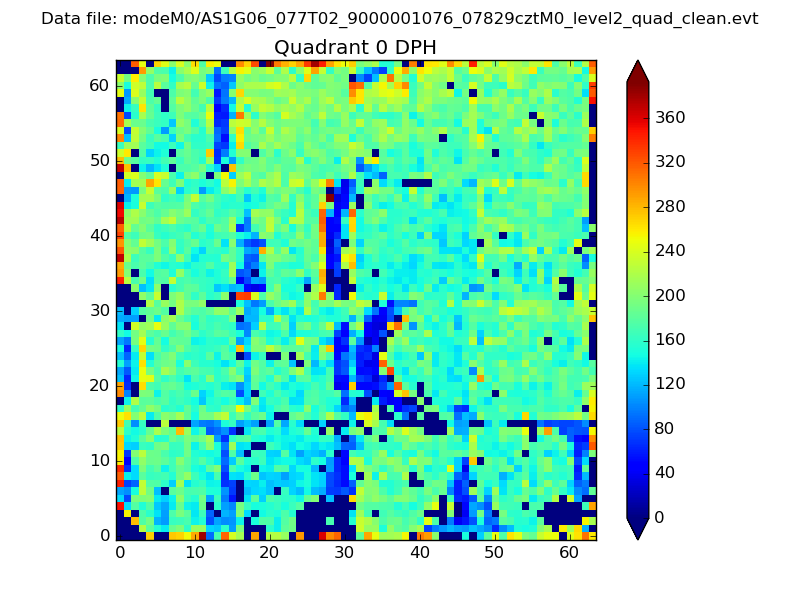 |
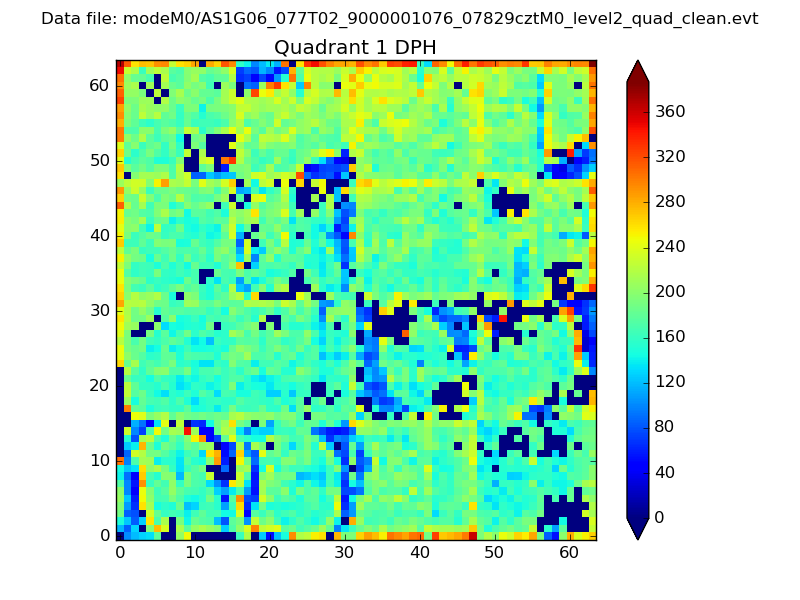 |
Quadrant B |
|---|---|---|---|
| Quadrant D | 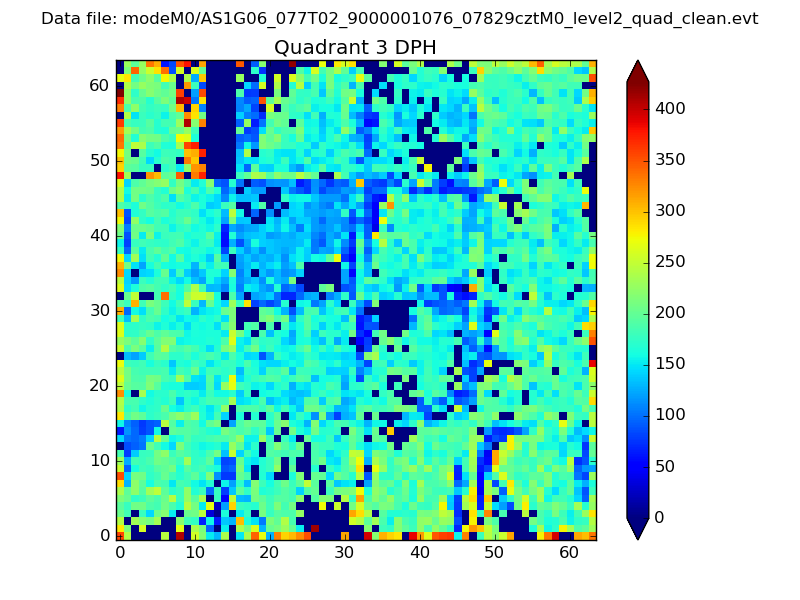 |
 |
Quadrant C |
| Plot type | Count rate plots | Images |
|---|---|---|
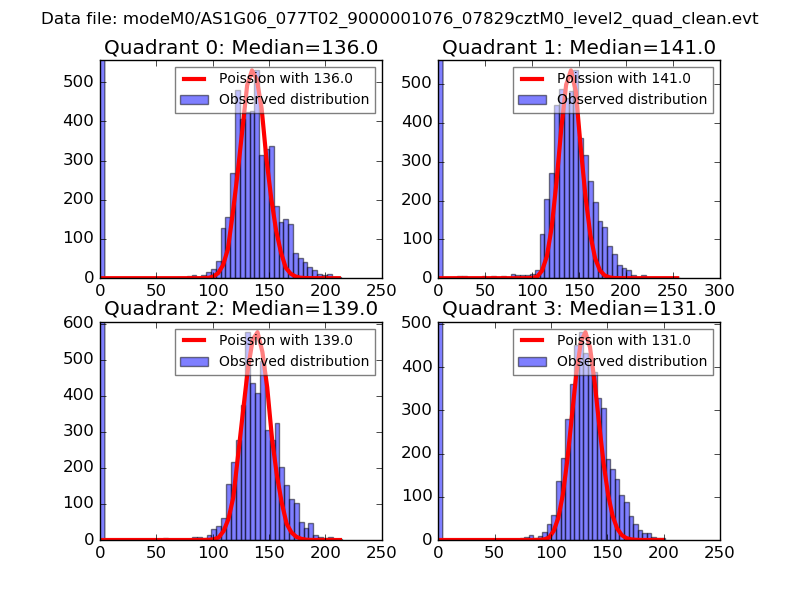
| Comparison with Poisson distribution Blue bars denote a histogram of data divided into 1 sec bins. Red curve is a Poisson curve with rate = median count rate of data. |
 |
 |
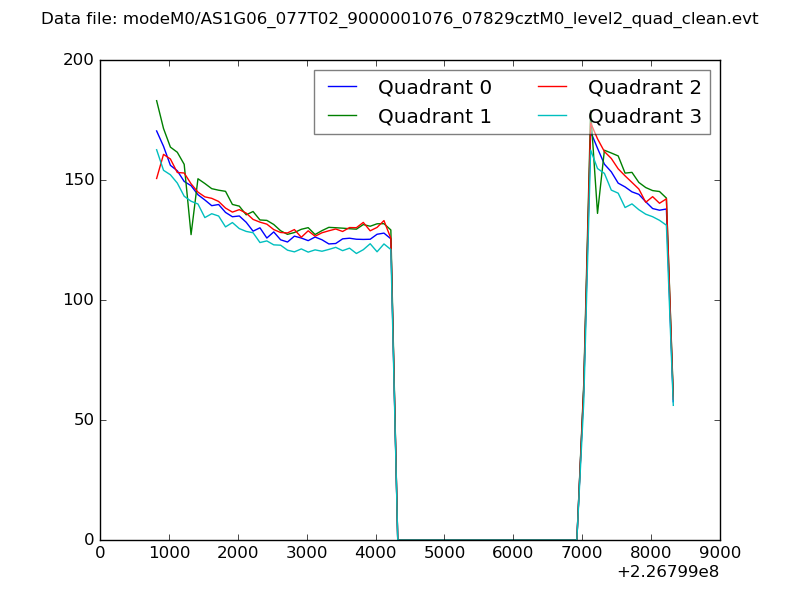
| Quadrant-wise count rates Data is divided into 100 sec bins |
 |
|
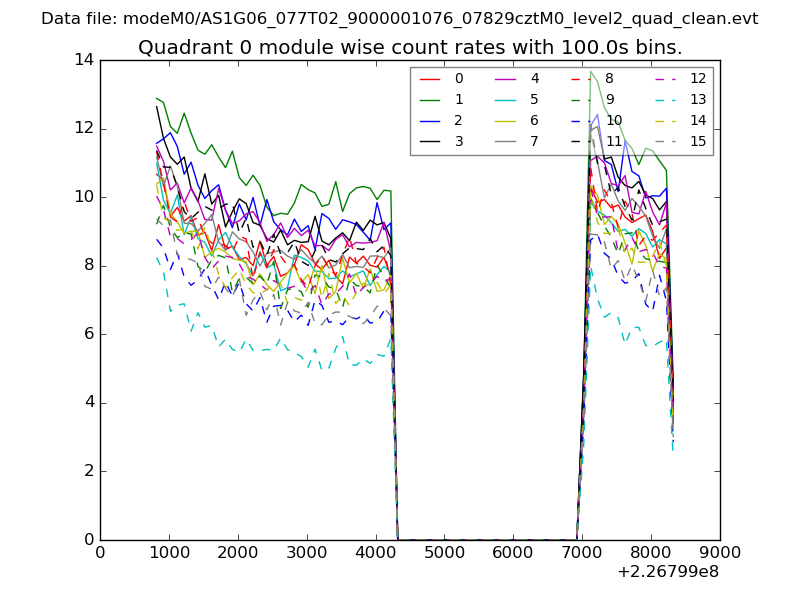
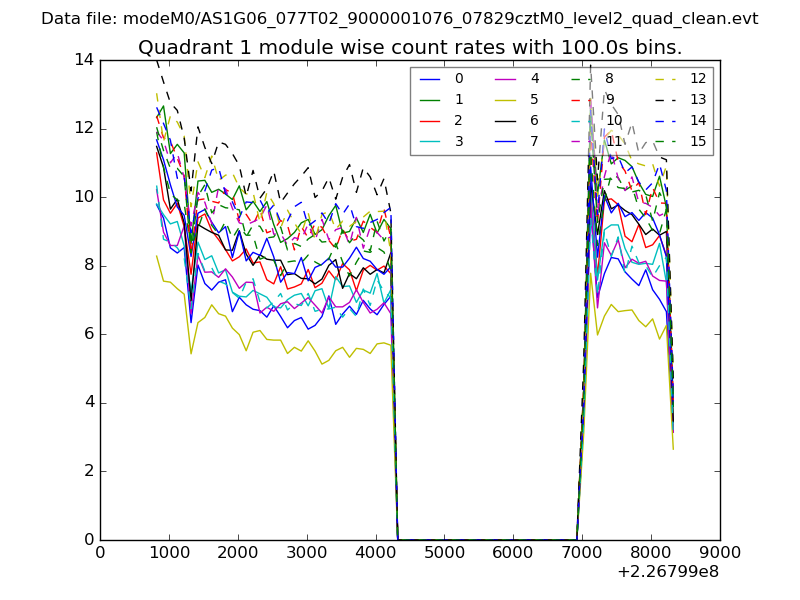
| Module-wise count rates for Quadrant A Data is divided into 100 sec bins |
 |
 |
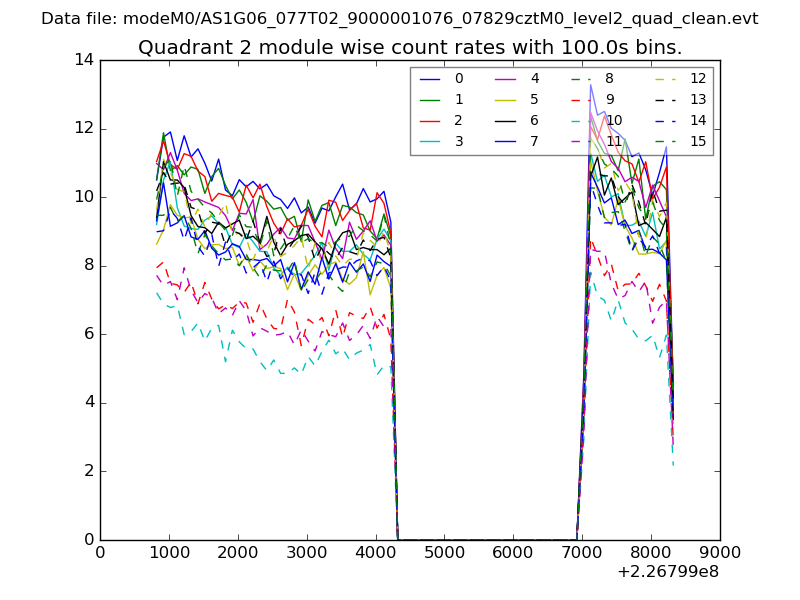
| Module-wise count rates for Quadrant B Data is divided into 100 sec bins |
 |
 |
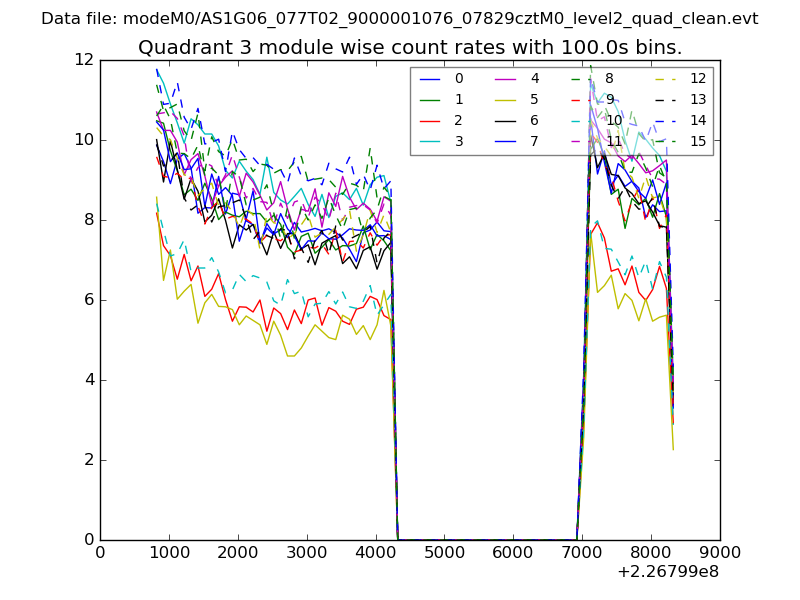
| Module-wise count rates for Quadrant C Data is divided into 100 sec bins |
 |
 |
| Module-wise count rates for Quadrant D Data is divided into 100 sec bins |
 |
 |
| Parameter | Plot |
|---|---|
| CZT HV Monitor | 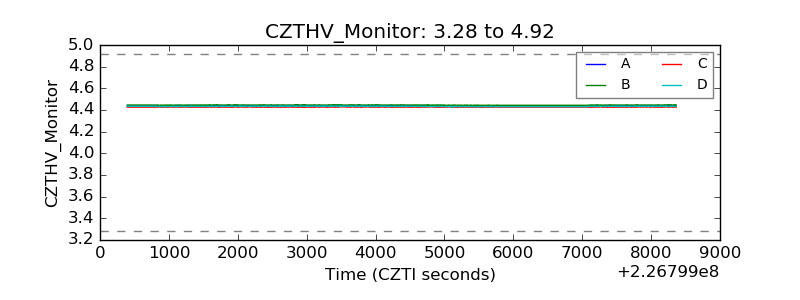 |
| D_VDD | 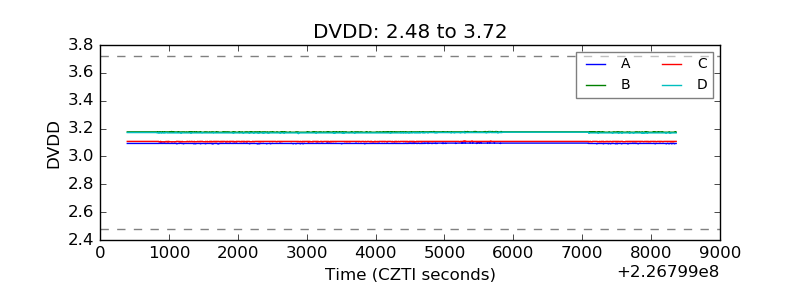 |
| Temperature 1 | 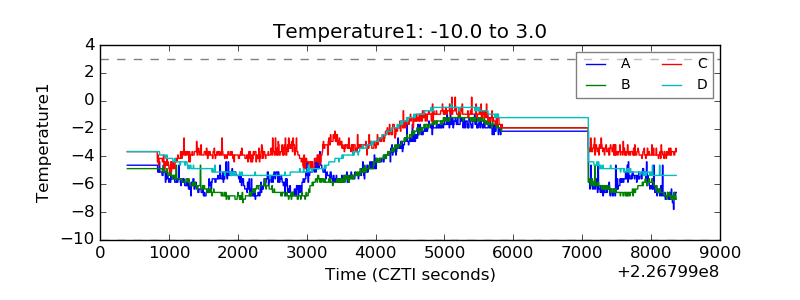 |
| Veto HV Monitor | 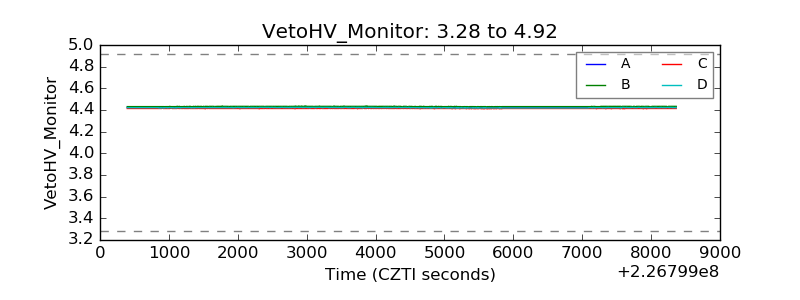 |
| Veto LLD | 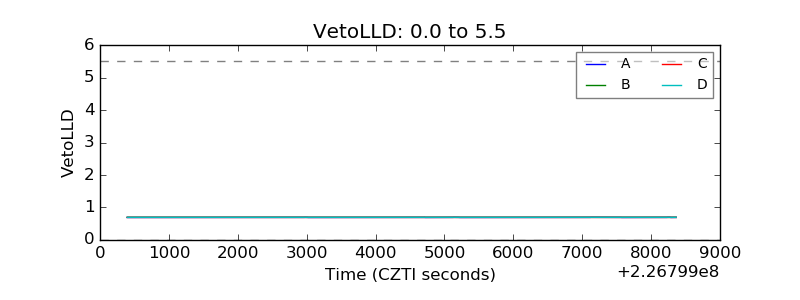 |
| Alpha Counter | 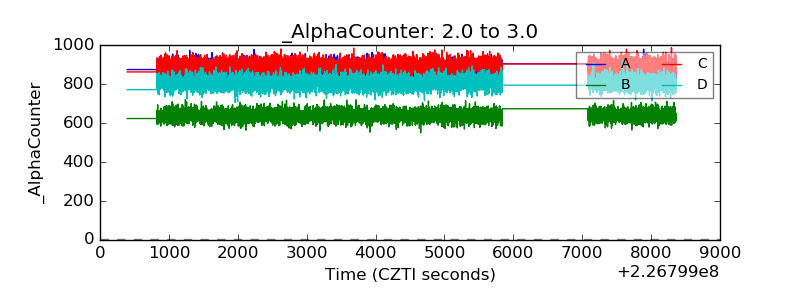 |
| _CPM_Rate | 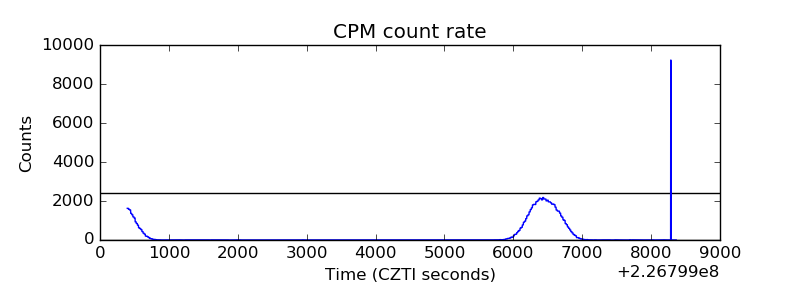 |
| CZT Counter | 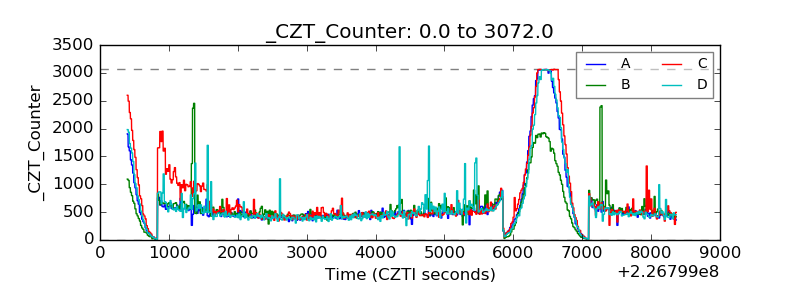 |
| +2.5 Volts monitor |  |
| +5 Volts monitor |  |
| _ROLL_ROT | 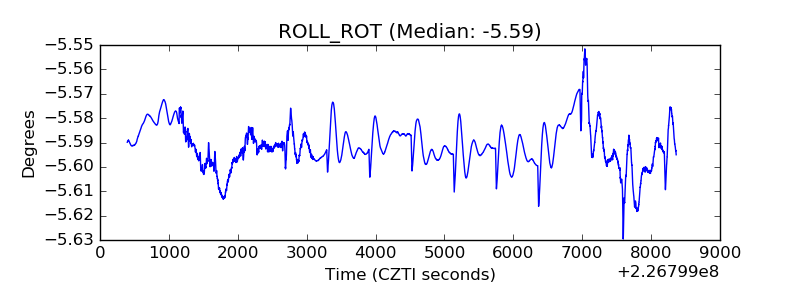 |
| _Roll_DEC | 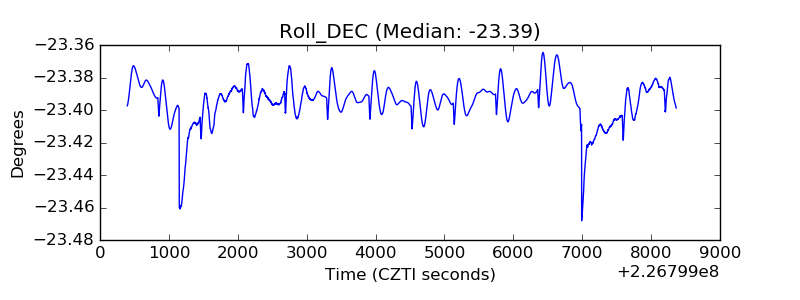 |
| _Roll_RA | 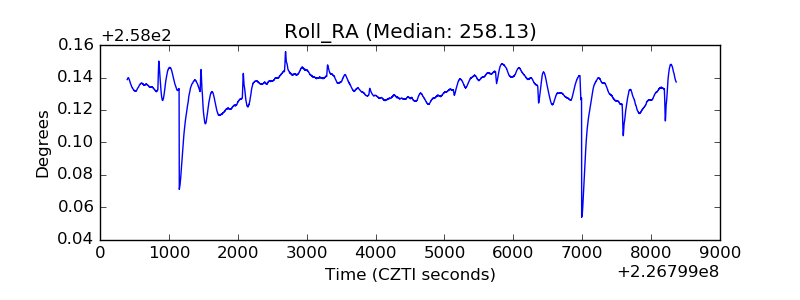 |
| Veto Counter | 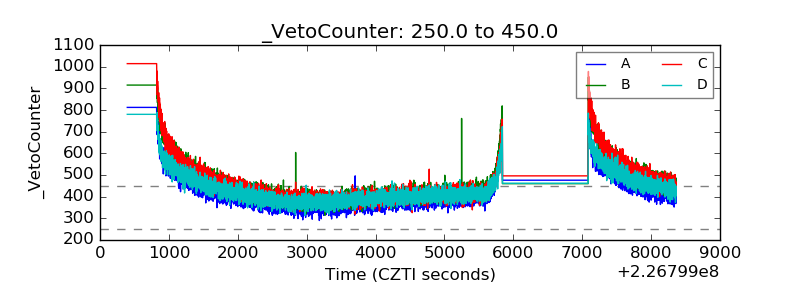 |