| Param | Original file | Final file |
|---|---|---|
| Filename | modeM0/AS1G06_077T02_9000001076_07830cztM0_level2.evt | modeM0/AS1G06_077T02_9000001076_07830cztM0_level2_quad_clean.evt |
| Size (bytes) | 482,201,280 | 102,588,480 |
| Size | 459.9 MB | 97.8 MB |
| Events in quadrant A | 3,160,039 | 656,851 |
| Events in quadrant B | 3,516,493 | 678,084 |
| Events in quadrant C | 4,006,406 | 674,591 |
| Events in quadrant D | 3,472,140 | 637,001 |
| Mode M9 | |||
|---|---|---|---|
| Quadrant | BADHDUFLAG | Total packets | Discarded packets |
| A | 0 | 21 | 0 |
| B | 0 | 21 | 0 |
| C | 0 | 21 | 0 |
| D | 0 | 22 | 0 |
| Mode M0 | |||
|---|---|---|---|
| Quadrant | BADHDUFLAG | Total packets | Discarded packets |
| A | 0 | 13678 | 3 |
| B | 0 | 14567 | 2 |
| C | 0 | 15987 | 2 |
| D | 0 | 14762 | 2 |
| Mode SS | |||
|---|---|---|---|
| Quadrant | BADHDUFLAG | Total packets | Discarded packets |
| A | 0 | 134 | 0 |
| B | 0 | 134 | 0 |
| C | 0 | 134 | 0 |
| D | 0 | 134 | 0 |
| Quadrant | Total seconds | Saturated seconds | Saturation percentage |
|---|---|---|---|
| A | 6604 | 22 | 0.333131% |
| B | 6604 | 103 | 1.559661% |
| C | 6604 | 222 | 3.361599% |
| D | 6604 | 31 | 0.469412% |
Noise dominated data is calculated using 1-second bins in cleaned event files. If a bin has >2000 counts, and if more than 50% of those come from <1% of pixels, then it is considered to be noise-dominated and hence unusable.
| Quadrant | # 1 sec bins | Bins with >0 counts | Bins with >2000 counts | High rate bins dominated by noise | Noise dominated (total time) | Noise dominated (detector-on time) | Marked lightcurve |
|---|---|---|---|---|---|---|---|
| A | 7889 | 6605 | 0 | 0 | 0.00% | 0.00% | 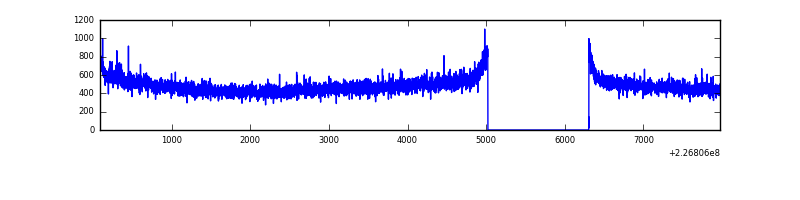 |
| B | 7889 | 6605 | 55 | 55 | 0.70% | 0.83% | 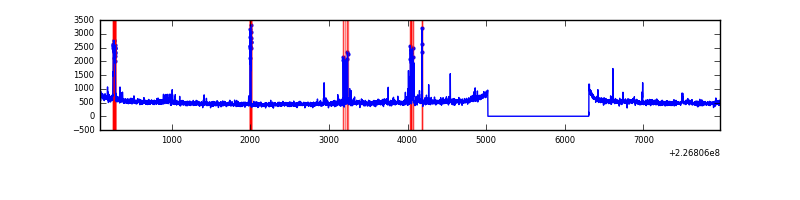 |
| C | 7889 | 6605 | 169 | 169 | 2.14% | 2.56% | 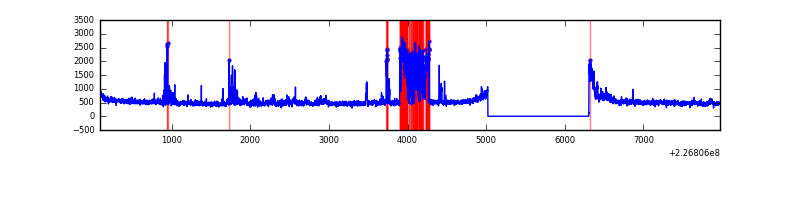 |
| D | 7889 | 6605 | 17 | 17 | 0.22% | 0.26% | 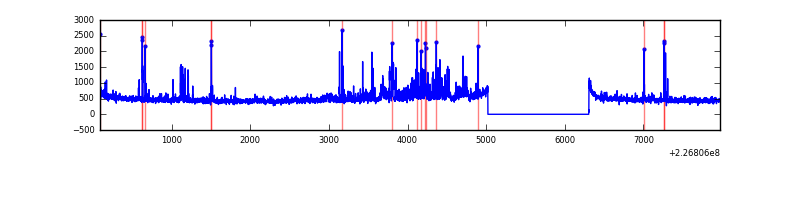 |
Top three noisy pixels from each quadrant. If the there are fewer than three noisy pixels in the level2.evt file, extra rows are filled as -1
| Pixel properties | Quadrant properties | ||||||
|---|---|---|---|---|---|---|---|
| Quadrant | DetID | PixID | Counts | Sigma | Mean | Median | Sigma |
| A | 15 | 239 | 21265 | 125.33 | 813 | 798 | 163.3 |
| A | 0 | 226 | 7605 | 41.68 | 813 | 798 | 163.3 |
| A | 12 | 194 | 7058 | 38.33 | 813 | 798 | 163.3 |
| B | 4 | 239 | 82683 | 529.11 | 826 | 809 | 154.7 |
| B | 5 | 255 | 50965 | 324.13 | 826 | 809 | 154.7 |
| B | 0 | 219 | 50518 | 321.24 | 826 | 809 | 154.7 |
| C | 8 | 229 | 679087 | 3652.49 | 805 | 812 | 185.7 |
| C | 1 | 16 | 181019 | 970.41 | 805 | 812 | 185.7 |
| C | 13 | 61 | 6139 | 28.68 | 805 | 812 | 185.7 |
| D | 2 | 136 | 150320 | 772.86 | 798 | 778 | 193.5 |
| D | 12 | 6 | 66360 | 338.94 | 798 | 778 | 193.5 |
| D | 2 | 152 | 56645 | 288.73 | 798 | 778 | 193.5 |
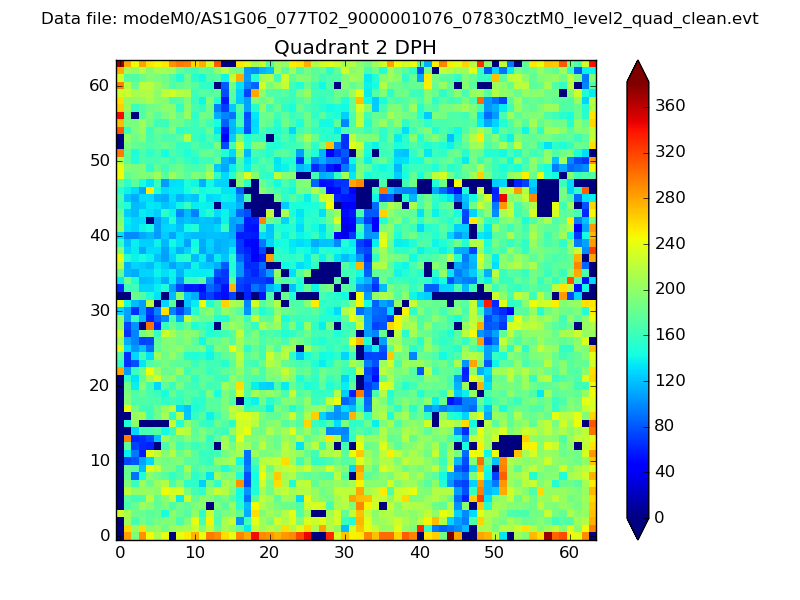
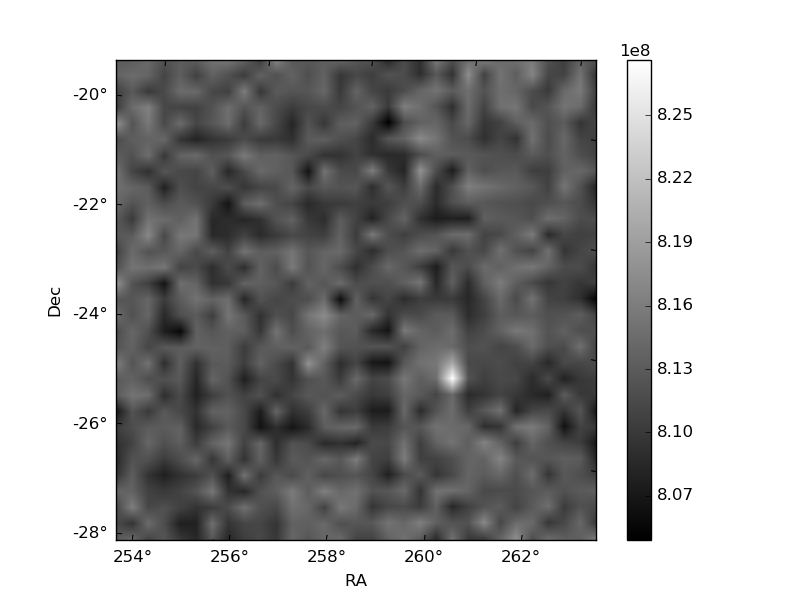
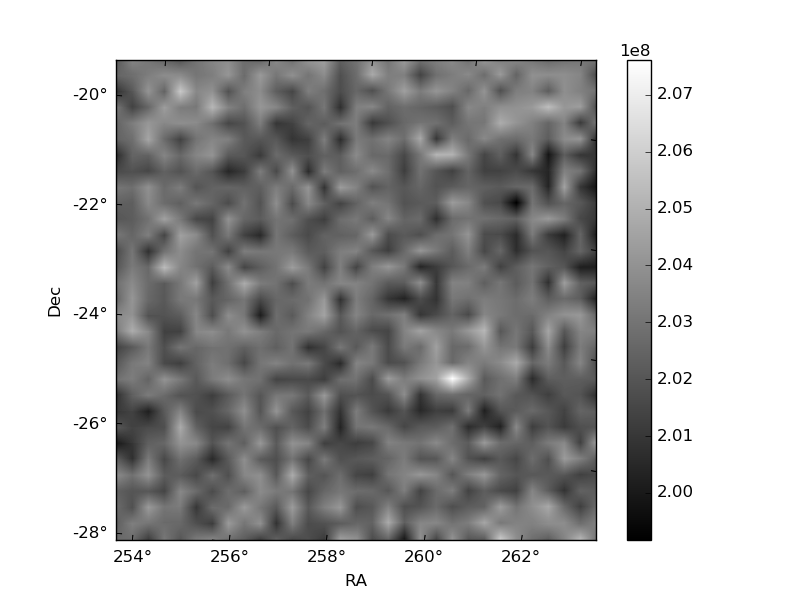
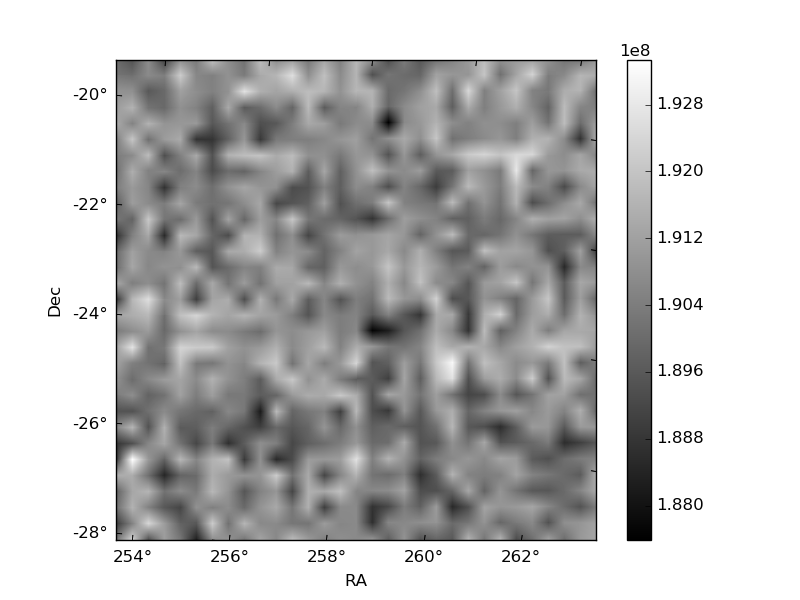
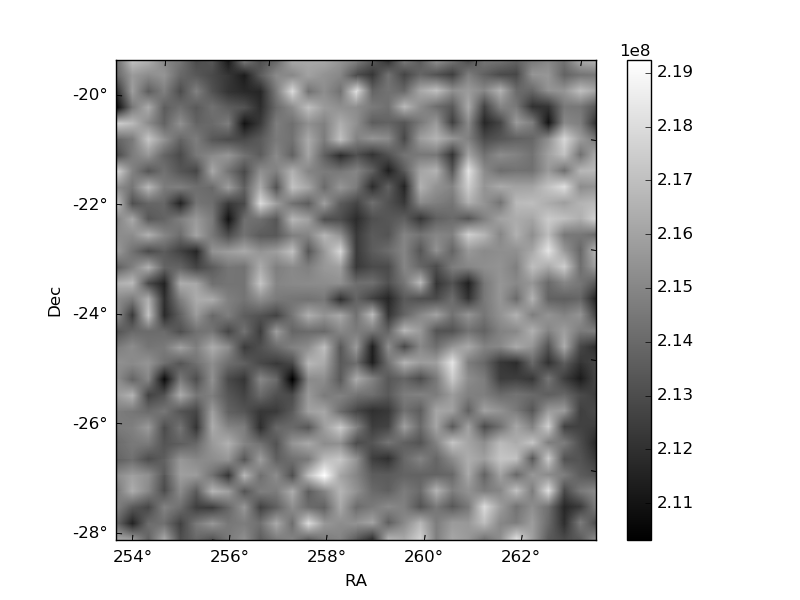
Histogram calculated using DETX and DETY for each event in the final _common_clean file
| Quadrant A | 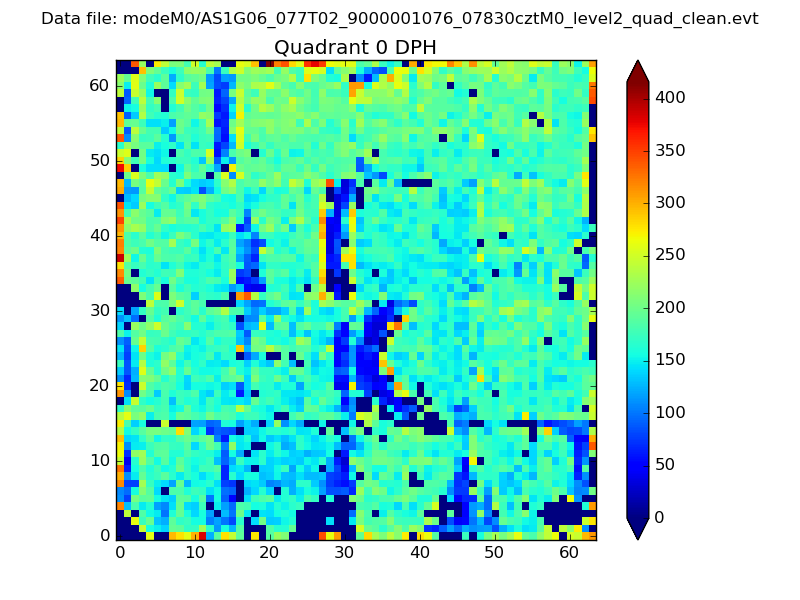 |
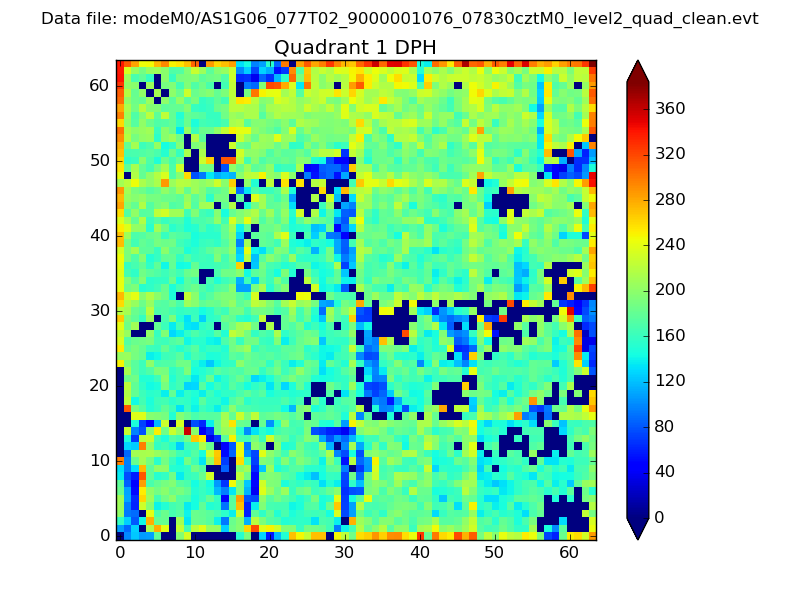 |
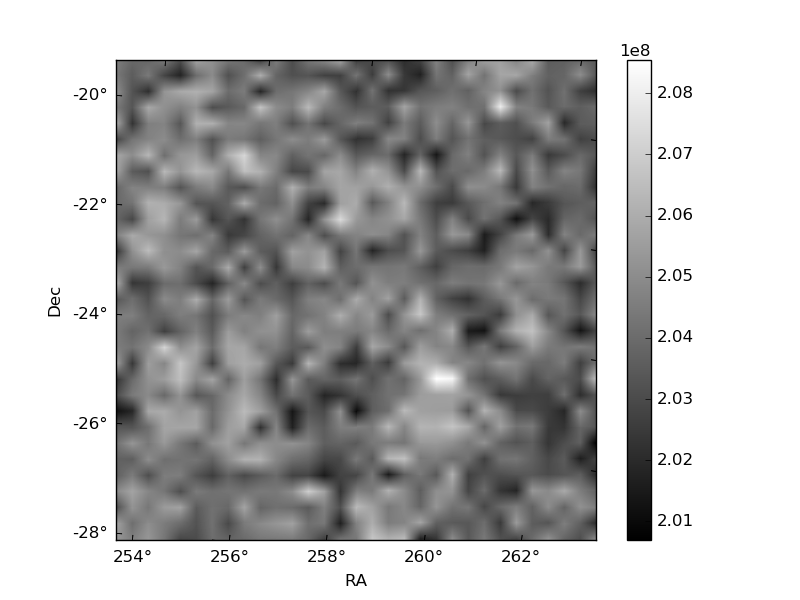
Quadrant B |
|---|---|---|---|
| Quadrant D | 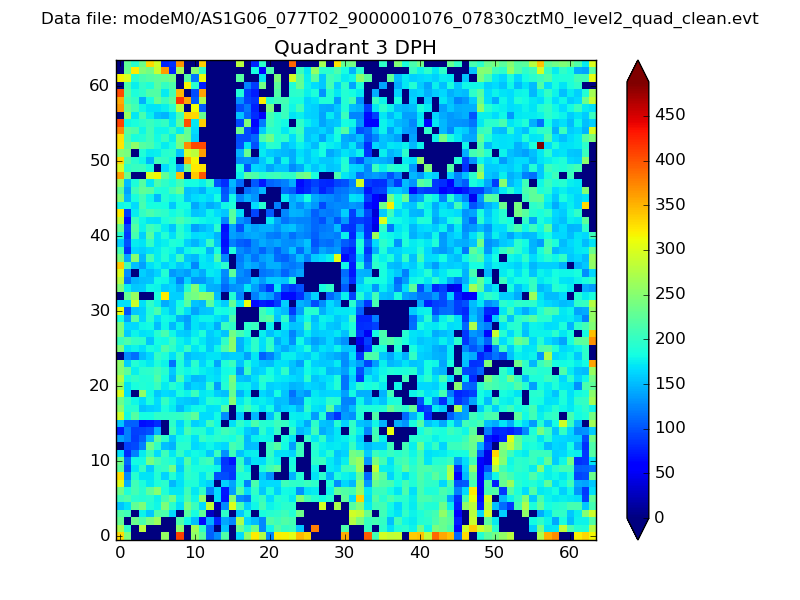 |
 |
Quadrant C |
| Plot type | Count rate plots | Images |
|---|---|---|
| Comparison with Poisson distribution Blue bars denote a histogram of data divided into 1 sec bins. Red curve is a Poisson curve with rate = median count rate of data. |
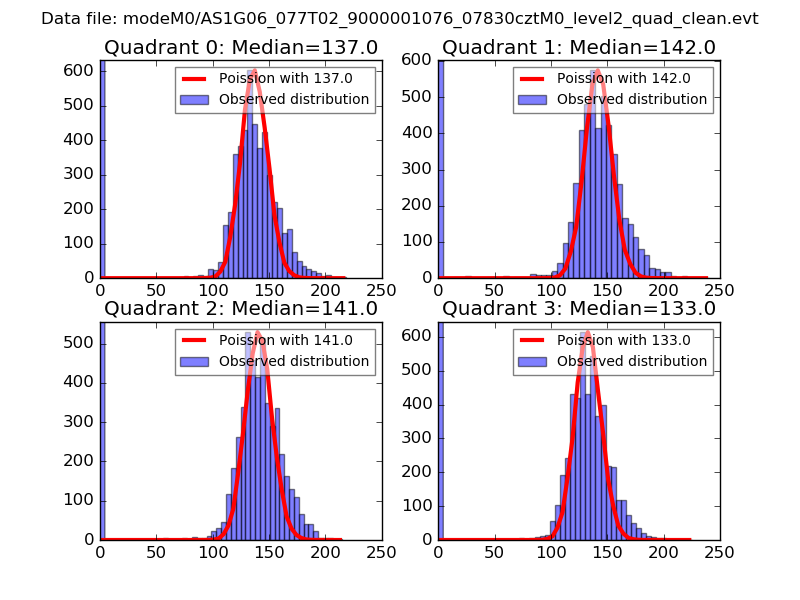 |
 |
| Quadrant-wise count rates Data is divided into 100 sec bins |
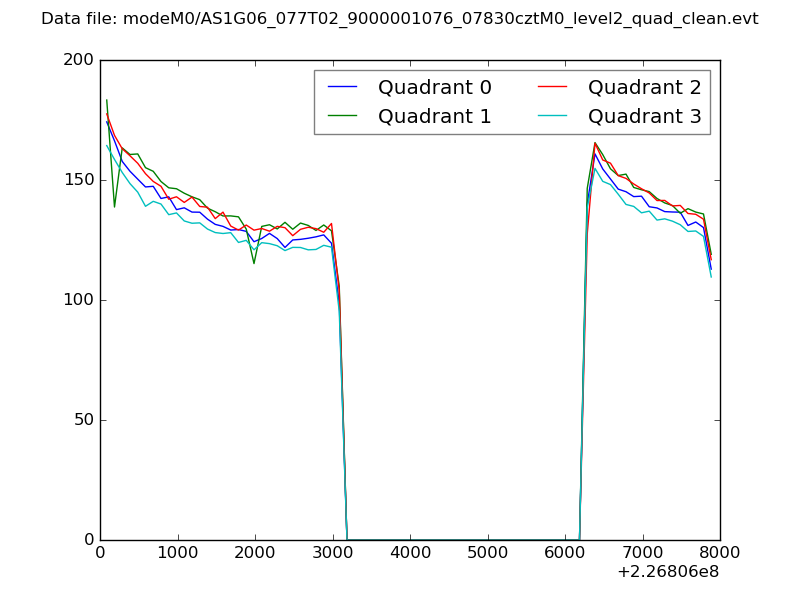 |
|
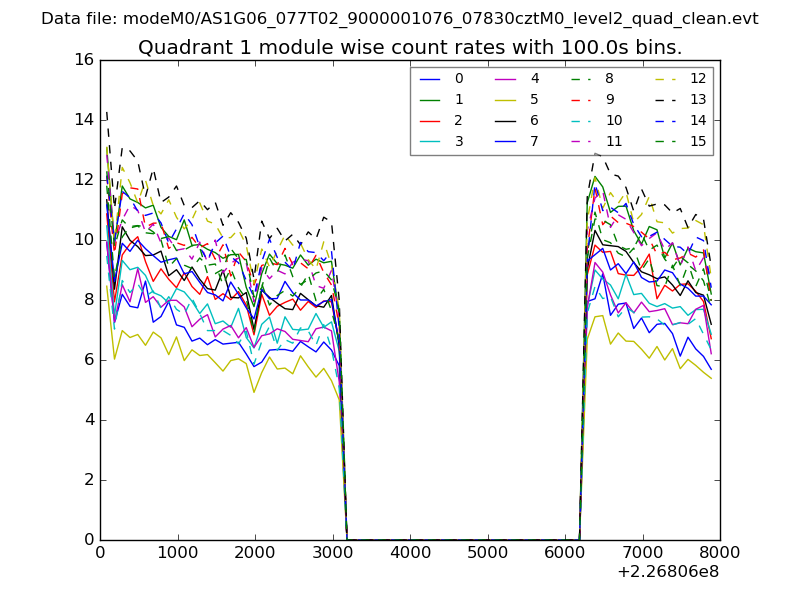
| Module-wise count rates for Quadrant A Data is divided into 100 sec bins |
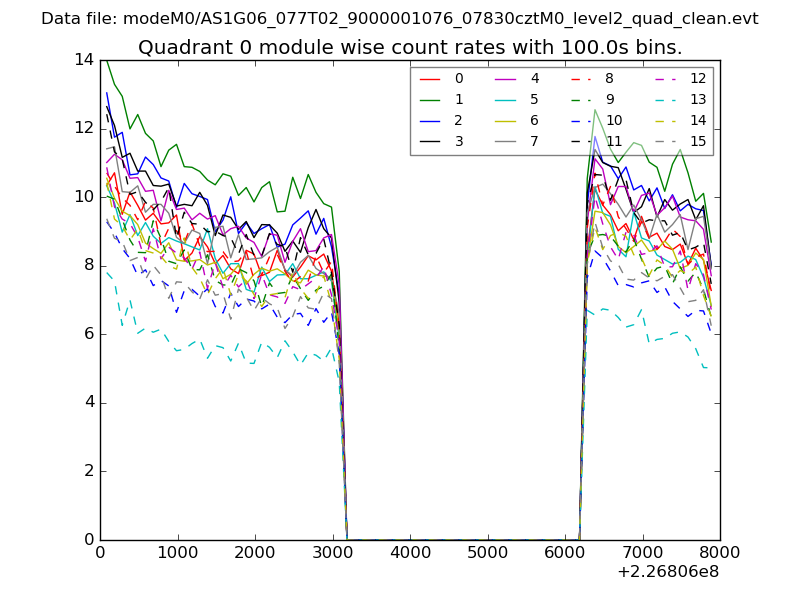 |
 |
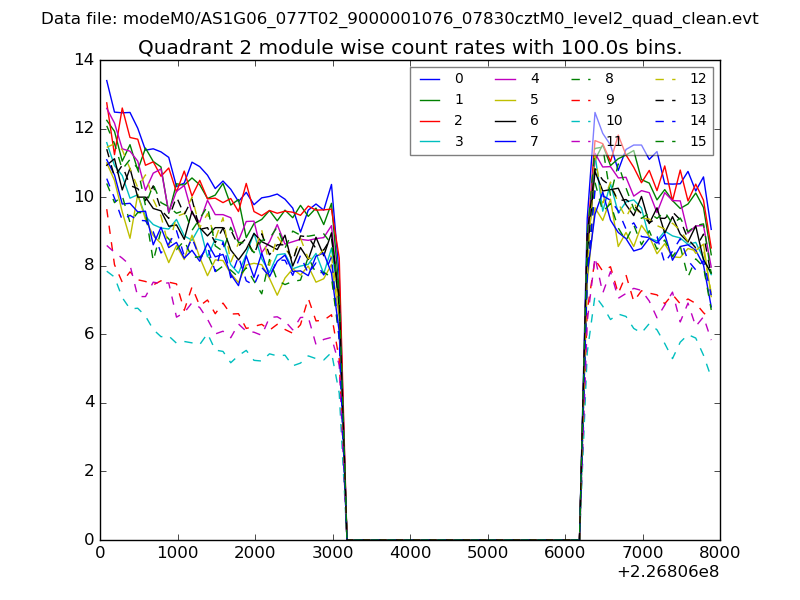
| Module-wise count rates for Quadrant B Data is divided into 100 sec bins |
 |
 |
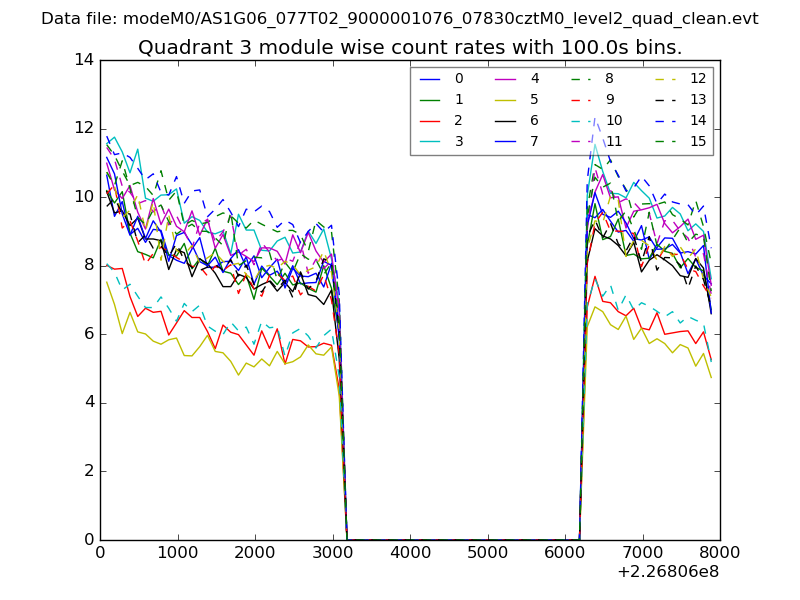
| Module-wise count rates for Quadrant C Data is divided into 100 sec bins |
 |
 |
| Module-wise count rates for Quadrant D Data is divided into 100 sec bins |
 |
 |
| Parameter | Plot |
|---|---|
| CZT HV Monitor | 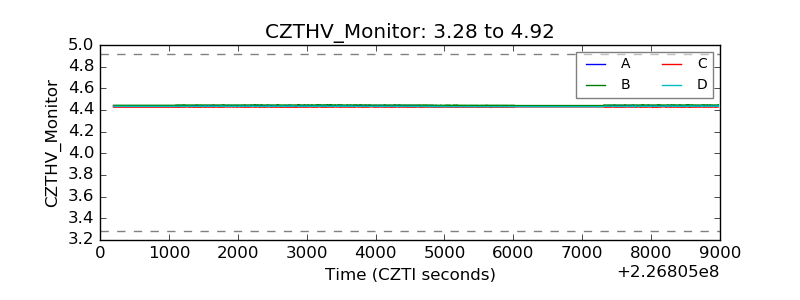 |
| D_VDD | 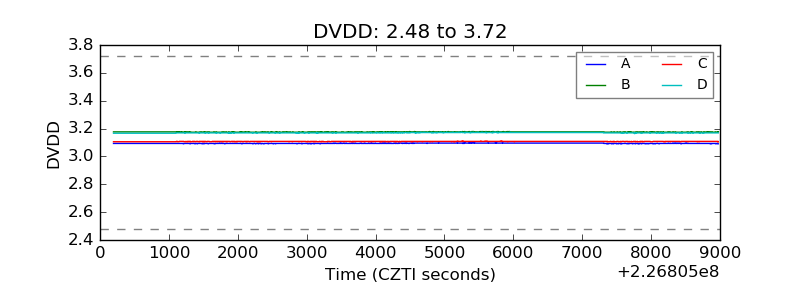 |
| Temperature 1 | 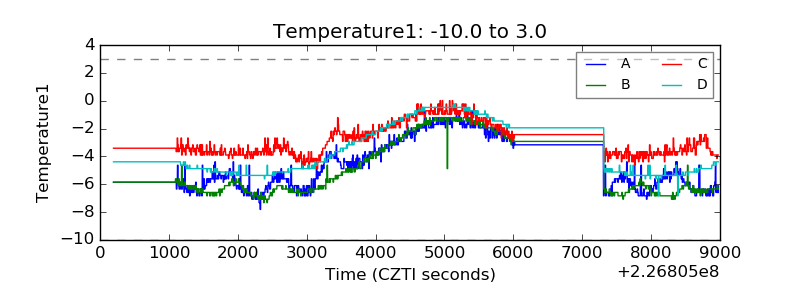 |
| Veto HV Monitor | 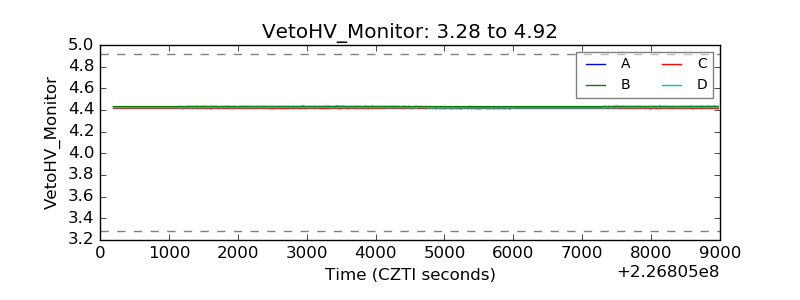 |
| Veto LLD | 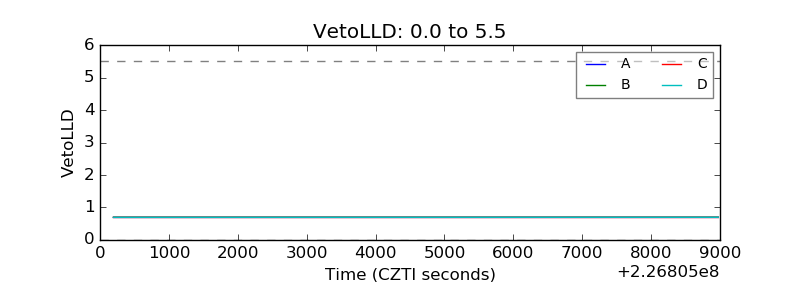 |
| Alpha Counter | 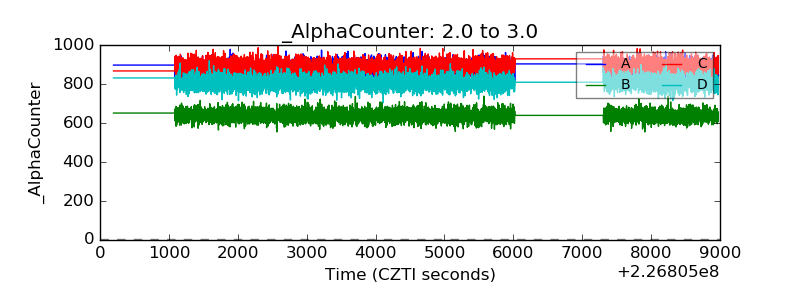 |
| _CPM_Rate | 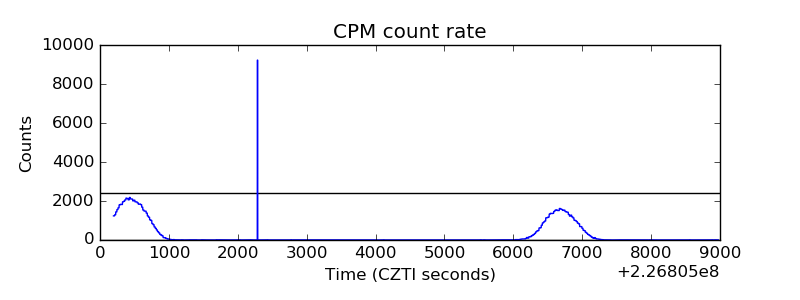 |
| CZT Counter | 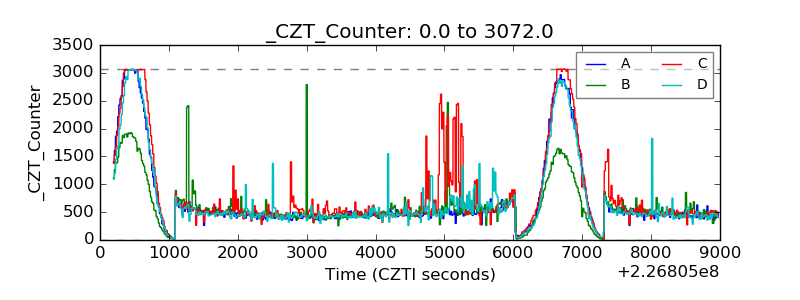 |
| +2.5 Volts monitor |  |
| +5 Volts monitor |  |
| _ROLL_ROT | 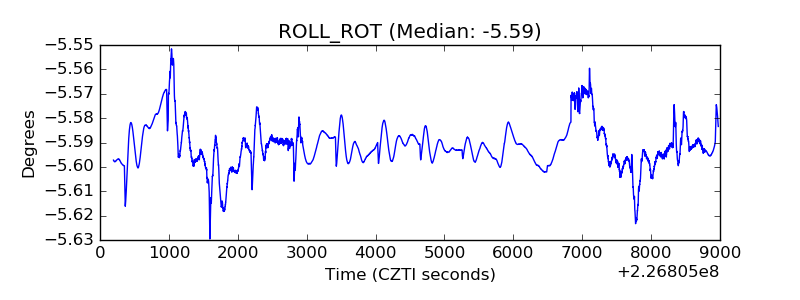 |
| _Roll_DEC | 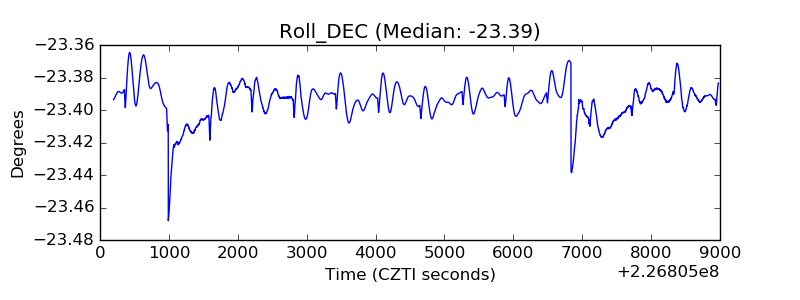 |
| _Roll_RA | 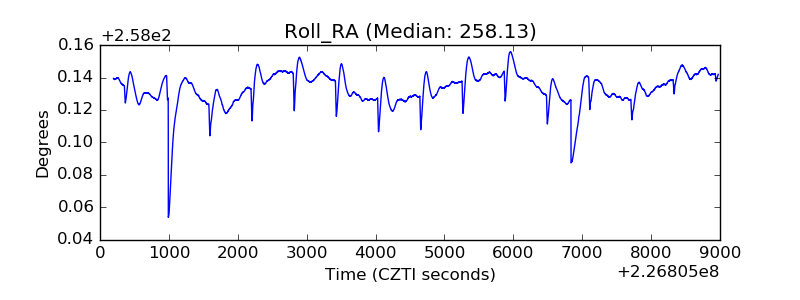 |
| Veto Counter | 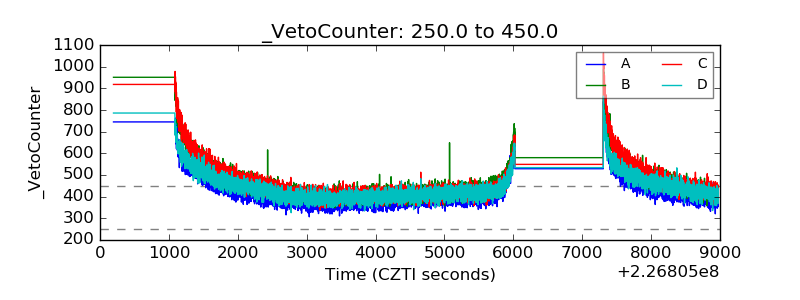 |