| Param | Original file | Final file |
|---|---|---|
| Filename | modeM0/AS1G06_077T02_9000001076_07831cztM0_level2.evt | modeM0/AS1G06_077T02_9000001076_07831cztM0_level2_quad_clean.evt |
| Size (bytes) | 479,139,840 | 96,932,160 |
| Size | 456.9 MB | 92.4 MB |
| Events in quadrant A | 3,504,944 | 612,564 |
| Events in quadrant B | 3,489,082 | 633,202 |
| Events in quadrant C | 3,478,687 | 628,156 |
| Events in quadrant D | 3,582,597 | 594,061 |
| Mode M9 | |||
|---|---|---|---|
| Quadrant | BADHDUFLAG | Total packets | Discarded packets |
| A | 0 | 16 | 0 |
| B | 0 | 16 | 0 |
| C | 0 | 16 | 0 |
| D | 0 | 17 | 0 |
| Mode M0 | |||
|---|---|---|---|
| Quadrant | BADHDUFLAG | Total packets | Discarded packets |
| A | 0 | 14943 | 3 |
| B | 0 | 14508 | 2 |
| C | 0 | 14593 | 2 |
| D | 0 | 15157 | 2 |
| Mode SS | |||
|---|---|---|---|
| Quadrant | BADHDUFLAG | Total packets | Discarded packets |
| A | 0 | 136 | 0 |
| B | 0 | 136 | 0 |
| C | 0 | 136 | 0 |
| D | 0 | 136 | 0 |
| Quadrant | Total seconds | Saturated seconds | Saturation percentage |
|---|---|---|---|
| A | 6710 | 44 | 0.655738% |
| B | 6710 | 64 | 0.953800% |
| C | 6710 | 52 | 0.774963% |
| D | 6710 | 91 | 1.356185% |
Noise dominated data is calculated using 1-second bins in cleaned event files. If a bin has >2000 counts, and if more than 50% of those come from <1% of pixels, then it is considered to be noise-dominated and hence unusable.
| Quadrant | # 1 sec bins | Bins with >0 counts | Bins with >2000 counts | High rate bins dominated by noise | Noise dominated (total time) | Noise dominated (detector-on time) | Marked lightcurve |
|---|---|---|---|---|---|---|---|
| A | 7950 | 6711 | 4 | 4 | 0.05% | 0.06% | 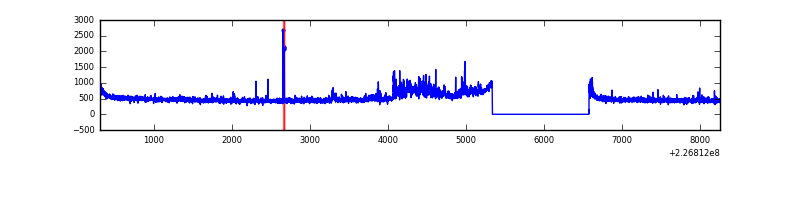 |
| B | 7950 | 6711 | 6 | 6 | 0.08% | 0.09% | 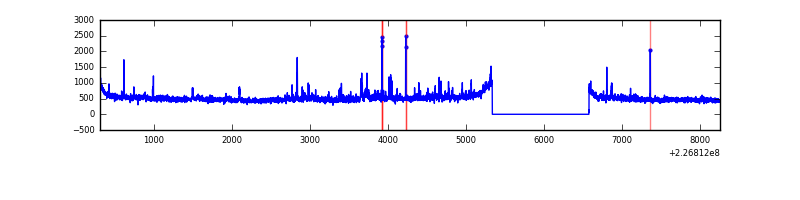 |
| C | 7950 | 6711 | 1 | 1 | 0.01% | 0.01% | 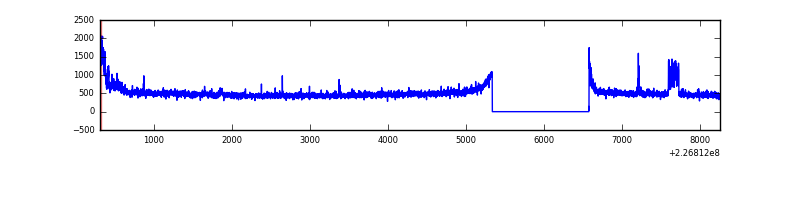 |
| D | 7950 | 6711 | 56 | 56 | 0.70% | 0.83% | 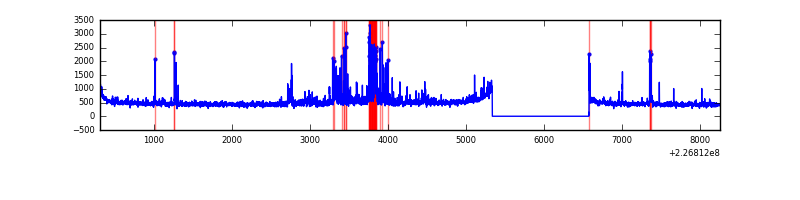 |
Top three noisy pixels from each quadrant. If the there are fewer than three noisy pixels in the level2.evt file, extra rows are filled as -1
| Pixel properties | Quadrant properties | ||||||
|---|---|---|---|---|---|---|---|
| Quadrant | DetID | PixID | Counts | Sigma | Mean | Median | Sigma |
| A | 15 | 239 | 301767 | 1819.28 | 822 | 806 | 165.4 |
| A | 6 | 16 | 22928 | 133.73 | 822 | 806 | 165.4 |
| A | 0 | 226 | 7805 | 42.31 | 822 | 806 | 165.4 |
| B | 0 | 219 | 87585 | 549.94 | 834 | 817 | 157.8 |
| B | 15 | 204 | 46170 | 287.45 | 834 | 817 | 157.8 |
| B | 4 | 81 | 38154 | 236.64 | 834 | 817 | 157.8 |
| C | 1 | 16 | 197767 | 1041.98 | 817 | 825 | 189.0 |
| C | 8 | 229 | 80368 | 420.85 | 817 | 825 | 189.0 |
| C | 12 | 4 | 6169 | 28.27 | 817 | 825 | 189.0 |
| D | 7 | 71 | 156291 | 782.29 | 809 | 786 | 198.8 |
| D | 2 | 136 | 136583 | 683.15 | 809 | 786 | 198.8 |
| D | 2 | 152 | 104466 | 521.58 | 809 | 786 | 198.8 |
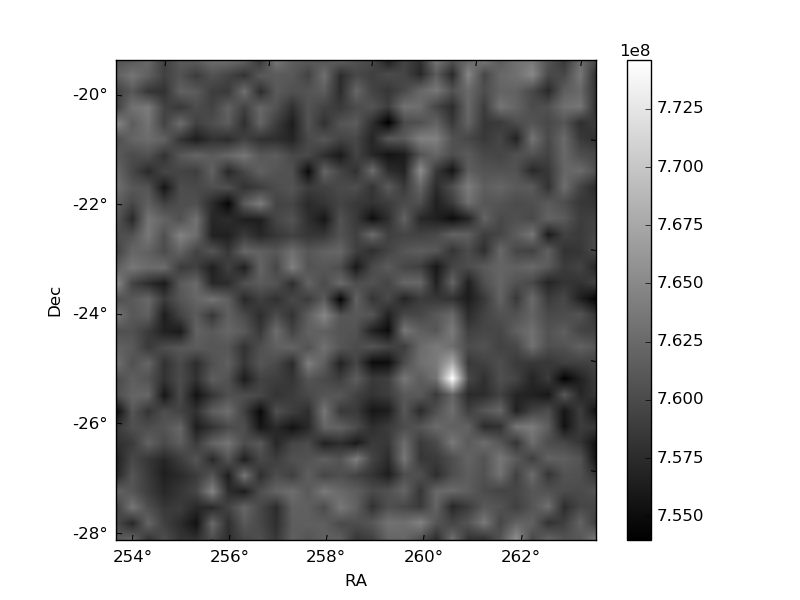
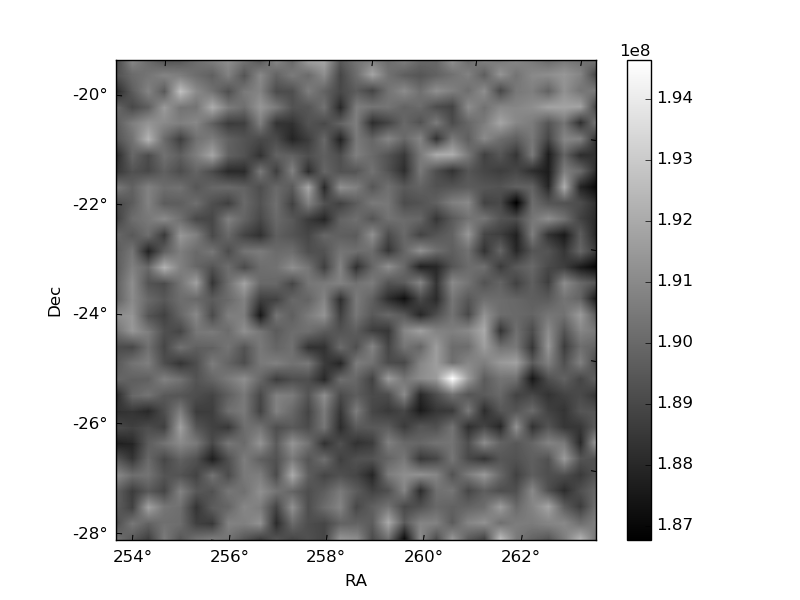
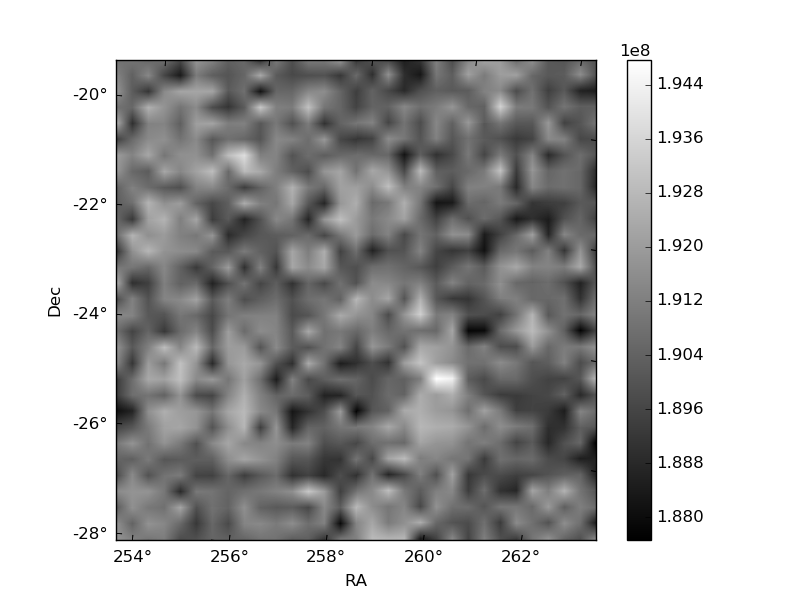
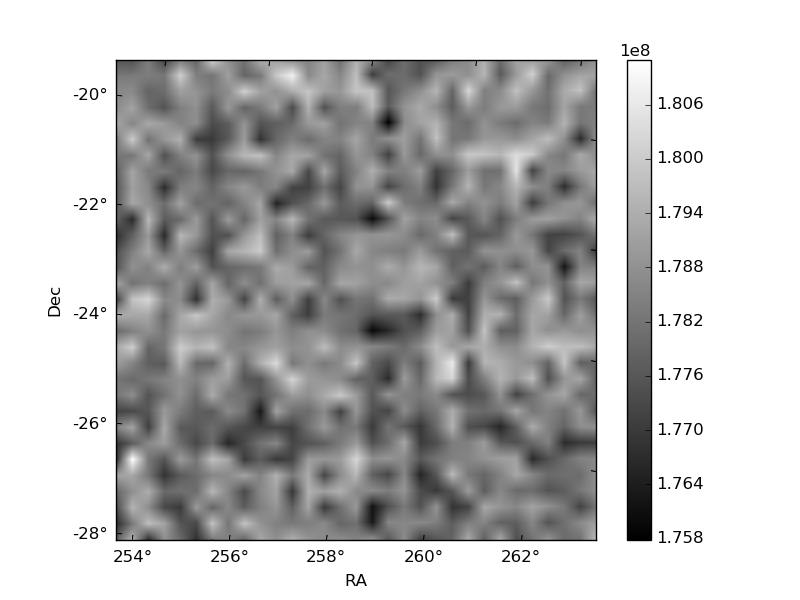
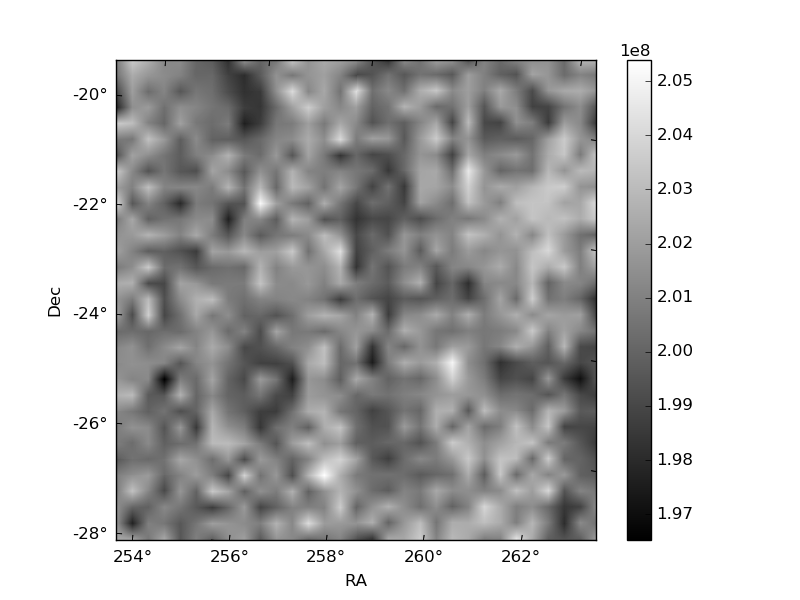
Histogram calculated using DETX and DETY for each event in the final _common_clean file
| Quadrant A | 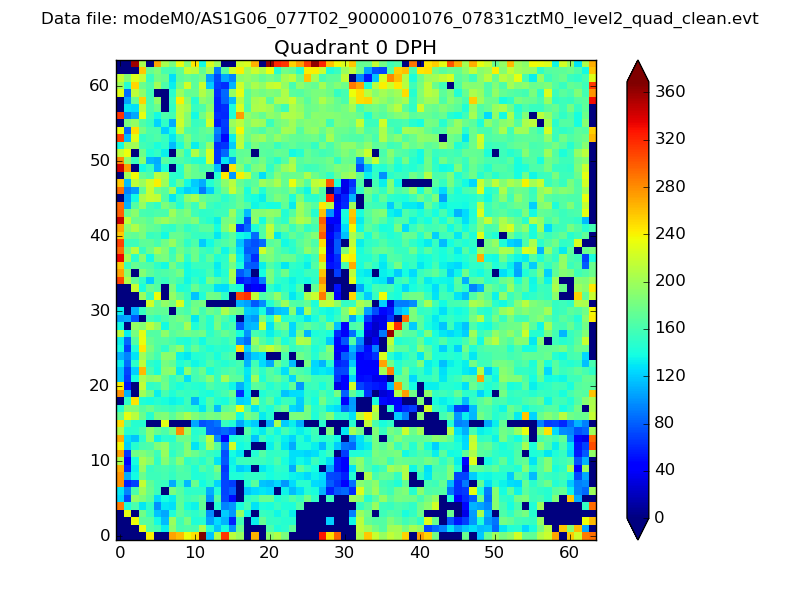 |
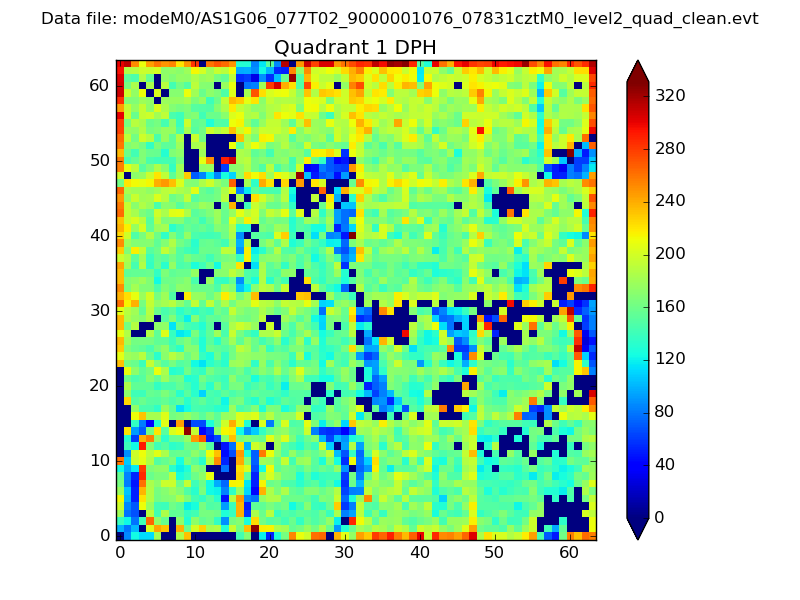 |
Quadrant B |
|---|---|---|---|
| Quadrant D | 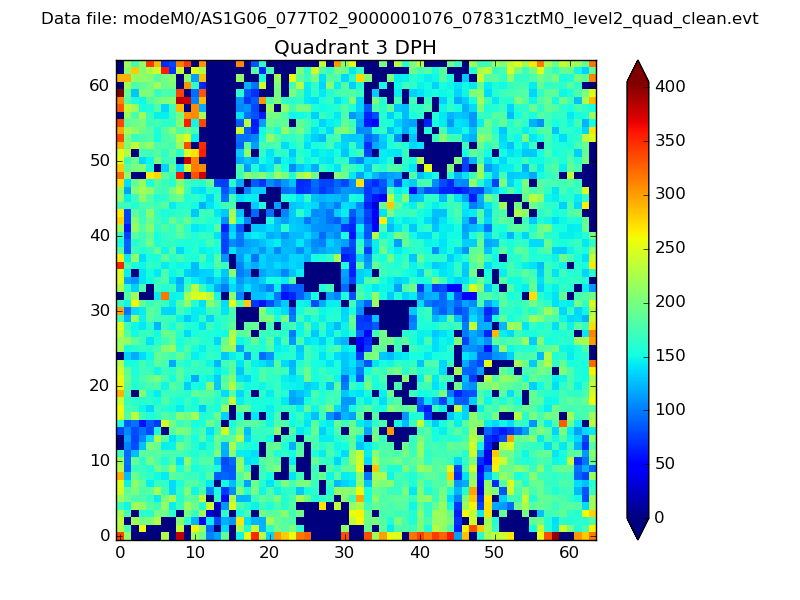 |
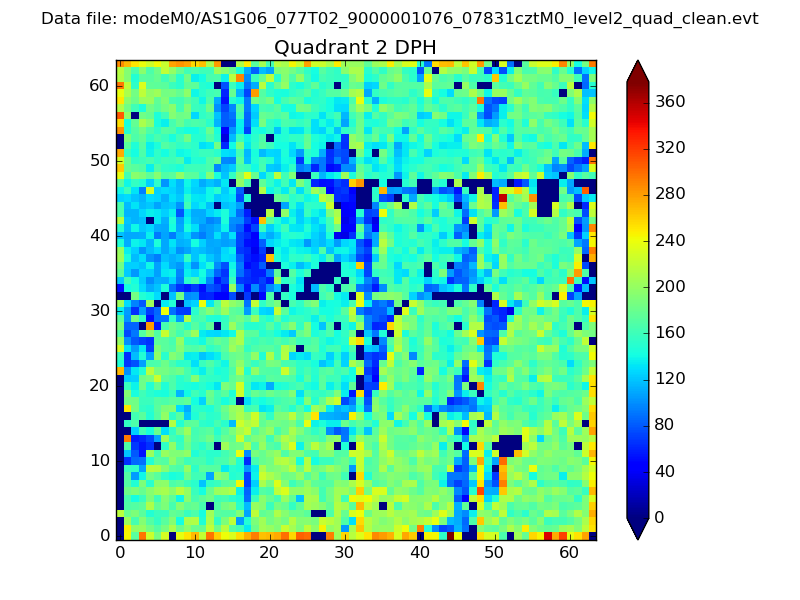 |
Quadrant C |
| Plot type | Count rate plots | Images |
|---|---|---|
| Comparison with Poisson distribution Blue bars denote a histogram of data divided into 1 sec bins. Red curve is a Poisson curve with rate = median count rate of data. |
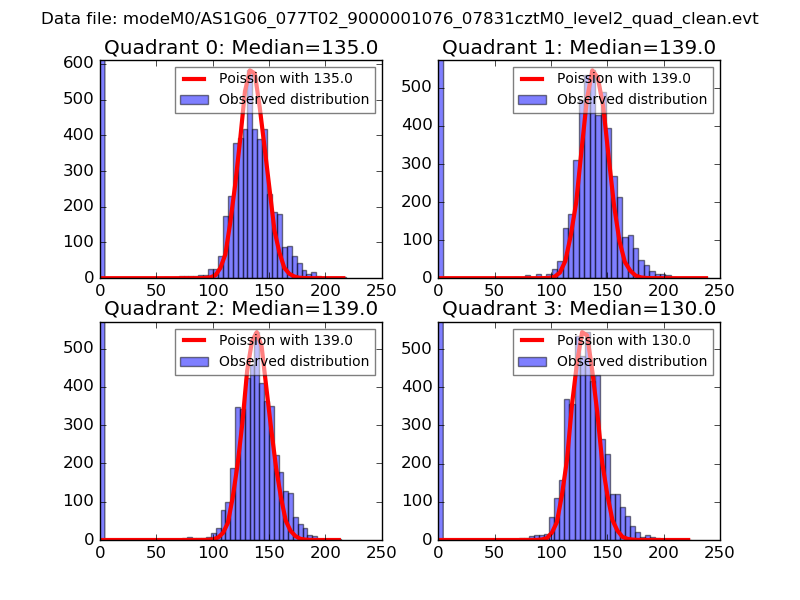 |
 |
| Quadrant-wise count rates Data is divided into 100 sec bins |
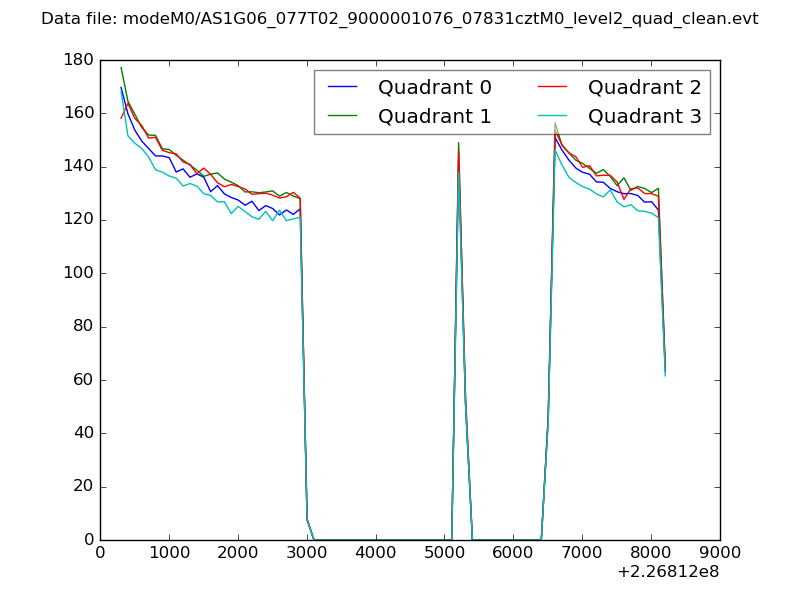 |
|
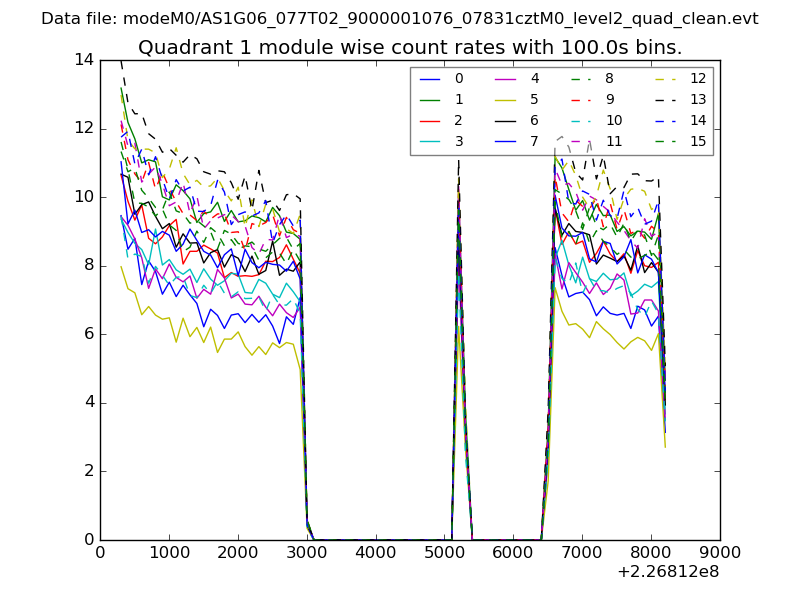
| Module-wise count rates for Quadrant A Data is divided into 100 sec bins |
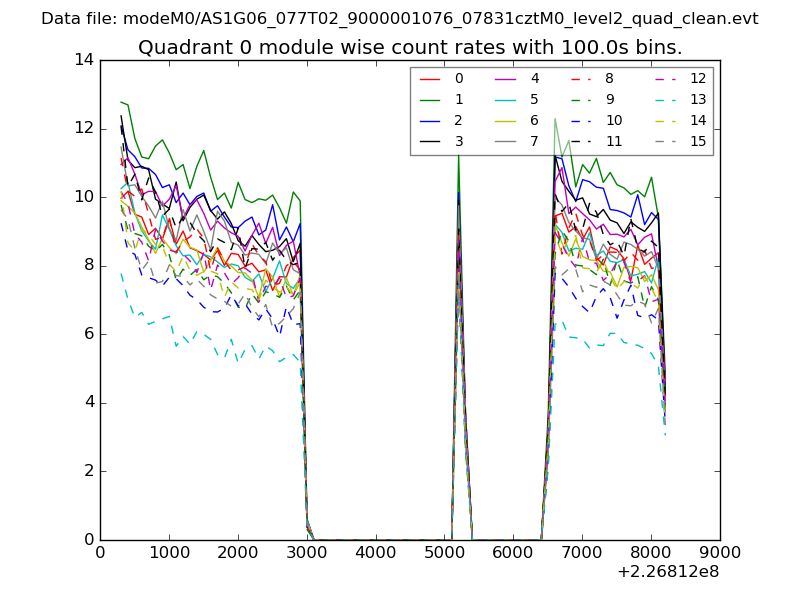 |
 |
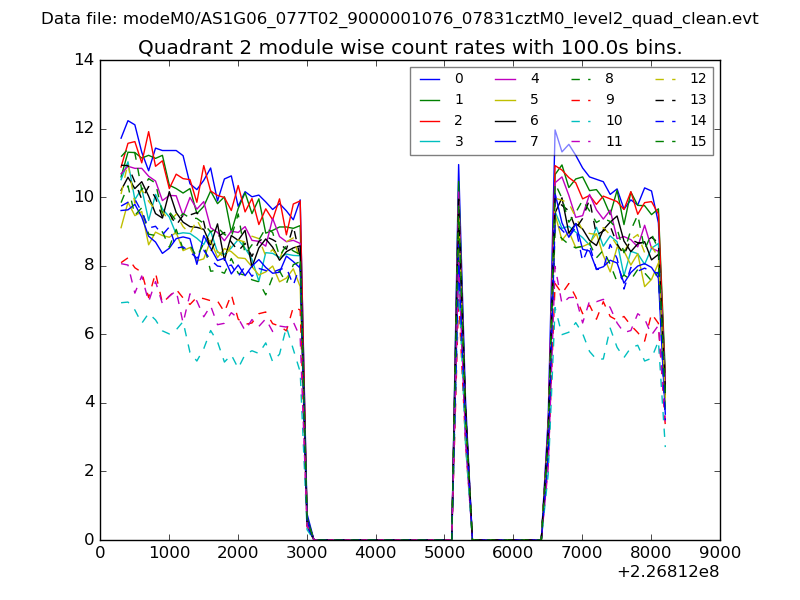
| Module-wise count rates for Quadrant B Data is divided into 100 sec bins |
 |
 |
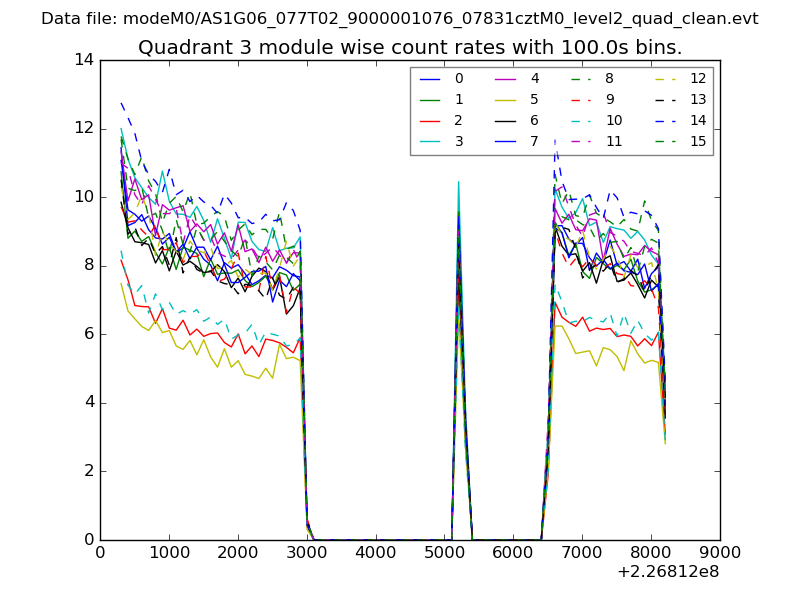
| Module-wise count rates for Quadrant C Data is divided into 100 sec bins |
 |
 |
| Module-wise count rates for Quadrant D Data is divided into 100 sec bins |
 |
 |
| Parameter | Plot |
|---|---|
| CZT HV Monitor | 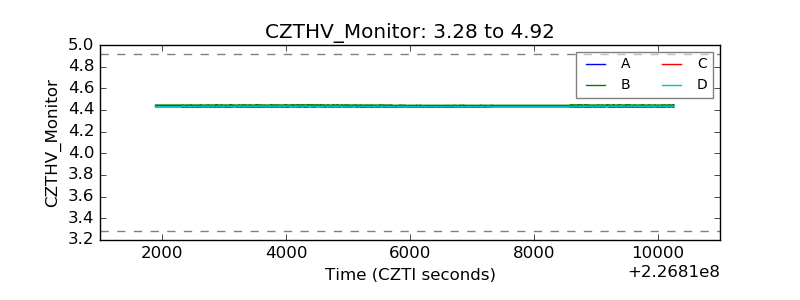 |
| D_VDD | 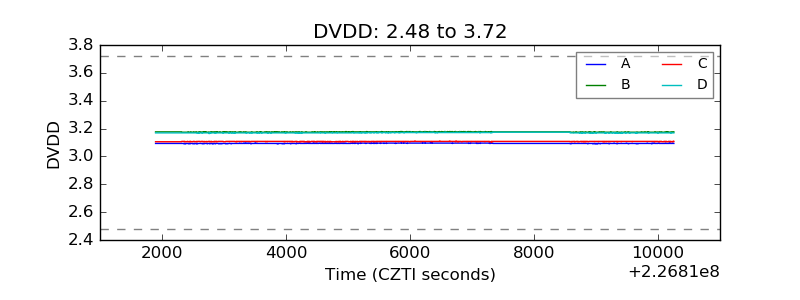 |
| Temperature 1 | 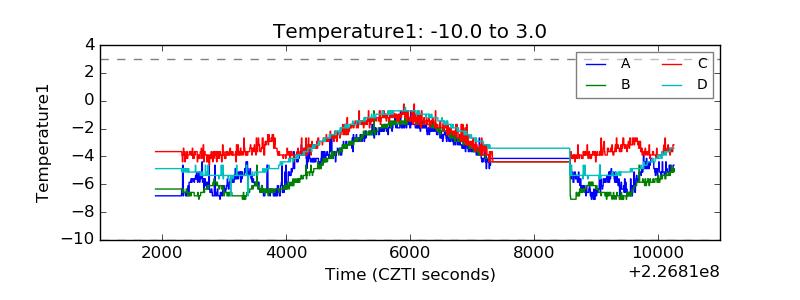 |
| Veto HV Monitor | 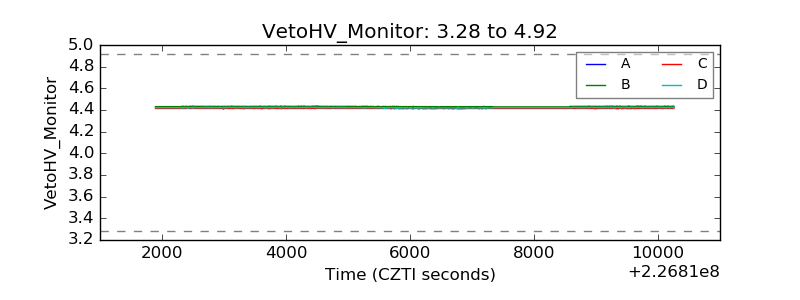 |
| Veto LLD | 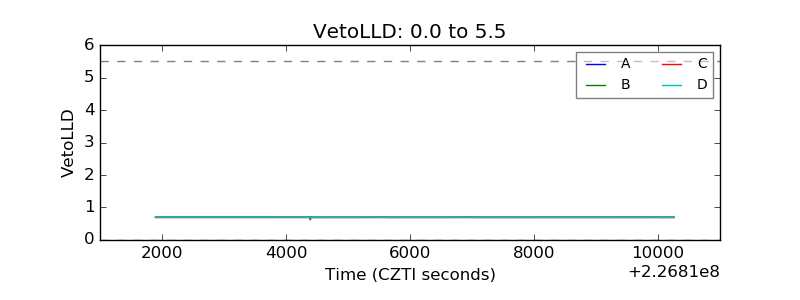 |
| Alpha Counter | 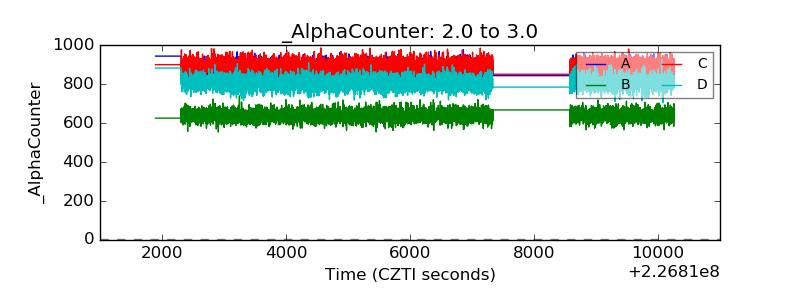 |
| _CPM_Rate | 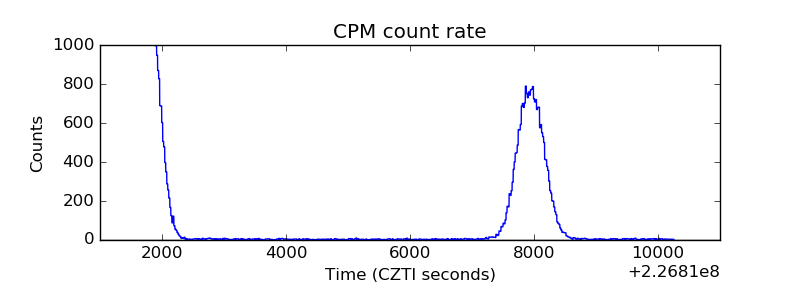 |
| CZT Counter | 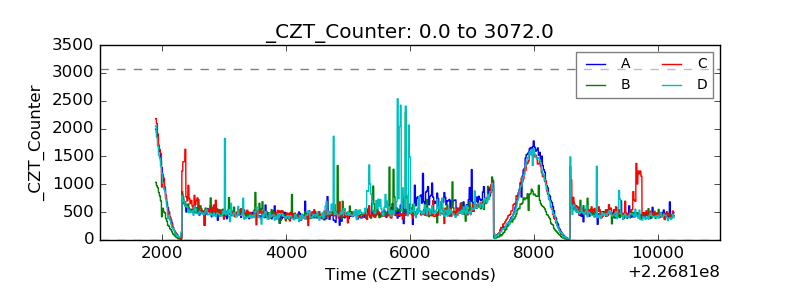 |
| +2.5 Volts monitor |  |
| +5 Volts monitor |  |
| _ROLL_ROT | 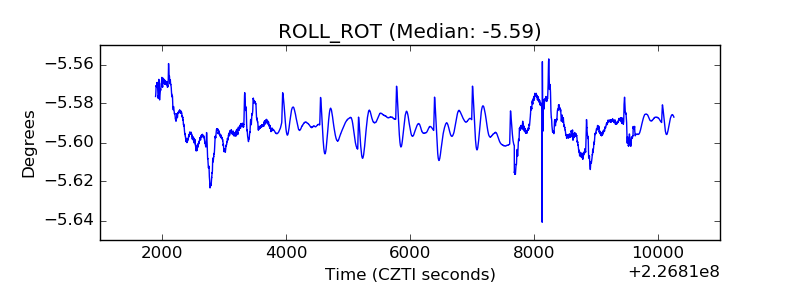 |
| _Roll_DEC | 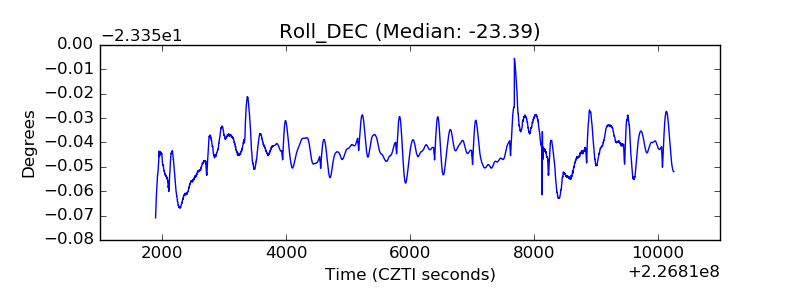 |
| _Roll_RA | 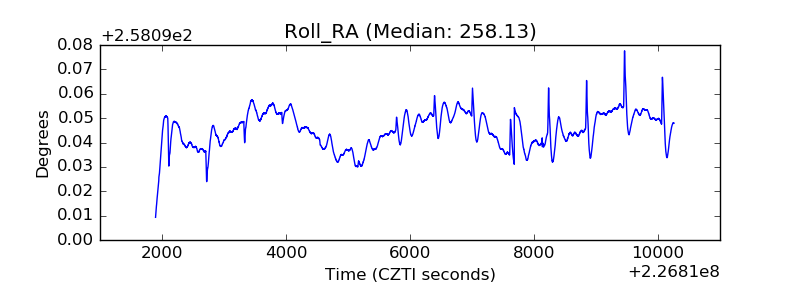 |
| Veto Counter | 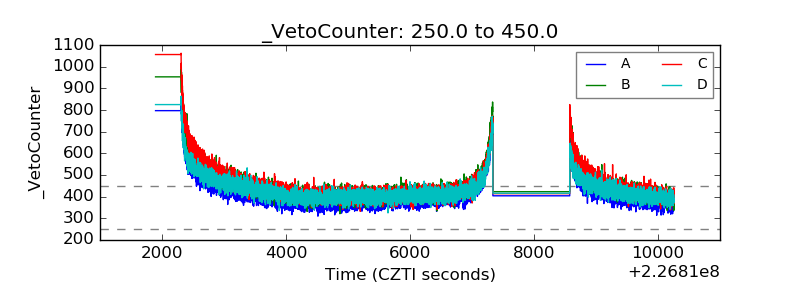 |