| Param | Original file | Final file |
|---|---|---|
| Filename | modeM0/AS1G06_077T02_9000001076_07832cztM0_level2.evt | modeM0/AS1G06_077T02_9000001076_07832cztM0_level2_quad_clean.evt |
| Size (bytes) | 218,341,440 | 32,425,920 |
| Size | 208.2 MB | 30.9 MB |
| Events in quadrant A | 1,481,844 | 184,166 |
| Events in quadrant B | 1,574,775 | 191,037 |
| Events in quadrant C | 1,601,371 | 189,446 |
| Events in quadrant D | 1,724,858 | 179,004 |
| Mode M0 | |||
|---|---|---|---|
| Quadrant | BADHDUFLAG | Total packets | Discarded packets |
| A | 0 | 6719 | 1 |
| B | 0 | 6839 | 0 |
| C | 0 | 7070 | 0 |
| D | 0 | 7421 | 0 |
| Mode SS | |||
|---|---|---|---|
| Quadrant | BADHDUFLAG | Total packets | Discarded packets |
| A | 0 | 68 | 0 |
| B | 0 | 68 | 0 |
| C | 0 | 68 | 0 |
| D | 0 | 68 | 0 |
| Quadrant | Total seconds | Saturated seconds | Saturation percentage |
|---|---|---|---|
| A | 3345 | 1 | 0.029895% |
| B | 3345 | 3 | 0.089686% |
| C | 3345 | 1 | 0.029895% |
| D | 3345 | 21 | 0.627803% |
Noise dominated data is calculated using 1-second bins in cleaned event files. If a bin has >2000 counts, and if more than 50% of those come from <1% of pixels, then it is considered to be noise-dominated and hence unusable.
| Quadrant | # 1 sec bins | Bins with >0 counts | Bins with >2000 counts | High rate bins dominated by noise | Noise dominated (total time) | Noise dominated (detector-on time) | Marked lightcurve |
|---|---|---|---|---|---|---|---|
| A | 3345 | 3345 | 0 | 0 | 0.00% | 0.00% | 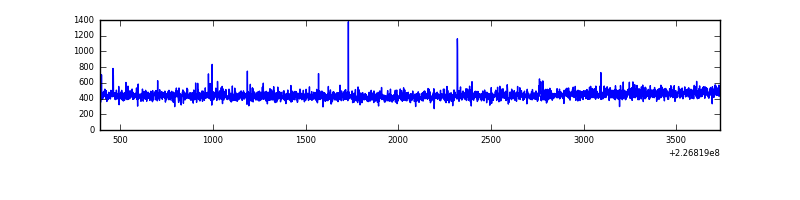 |
| B | 3345 | 3345 | 0 | 0 | 0.00% | 0.00% | 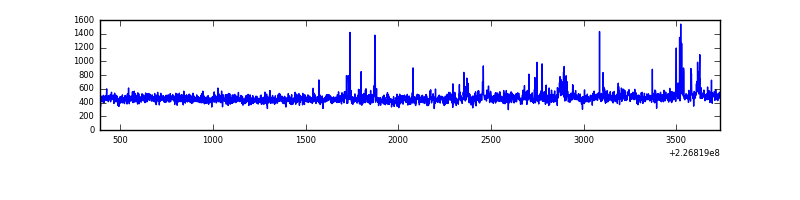 |
| C | 3345 | 3345 | 0 | 0 | 0.00% | 0.00% | 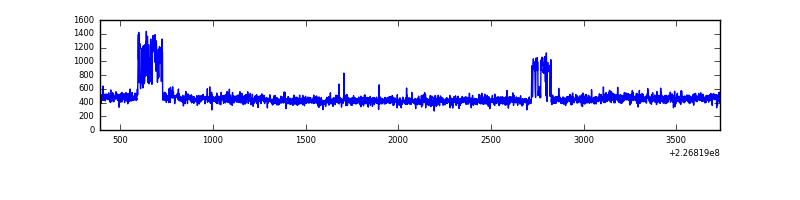 |
| D | 3345 | 3345 | 12 | 12 | 0.36% | 0.36% | 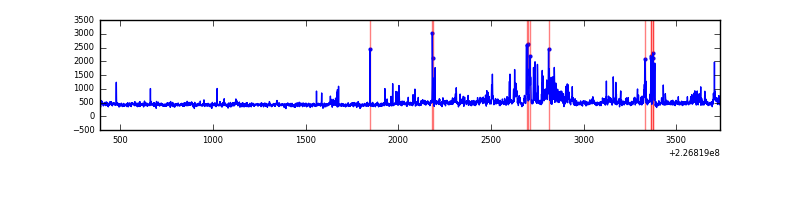 |
Top three noisy pixels from each quadrant. If the there are fewer than three noisy pixels in the level2.evt file, extra rows are filled as -1
| Pixel properties | Quadrant properties | ||||||
|---|---|---|---|---|---|---|---|
| Quadrant | DetID | PixID | Counts | Sigma | Mean | Median | Sigma |
| A | 0 | 128 | 8874 | 109.41 | 380 | 372 | 77.7 |
| A | 0 | 226 | 3703 | 42.87 | 380 | 372 | 77.7 |
| A | 12 | 194 | 3665 | 42.38 | 380 | 372 | 77.7 |
| B | 0 | 219 | 27927 | 373.51 | 381 | 372 | 73.8 |
| B | 4 | 239 | 19944 | 265.3 | 381 | 372 | 73.8 |
| B | 0 | 214 | 18798 | 249.76 | 381 | 372 | 73.8 |
| C | 8 | 229 | 114670 | 1316.14 | 373 | 375 | 86.8 |
| C | 1 | 16 | 28961 | 329.18 | 373 | 375 | 86.8 |
| C | 13 | 61 | 2832 | 28.29 | 373 | 375 | 86.8 |
| D | 2 | 136 | 103596 | 1124.82 | 374 | 363 | 91.8 |
| D | 2 | 152 | 67403 | 730.46 | 374 | 363 | 91.8 |
| D | 7 | 71 | 52061 | 563.3 | 374 | 363 | 91.8 |
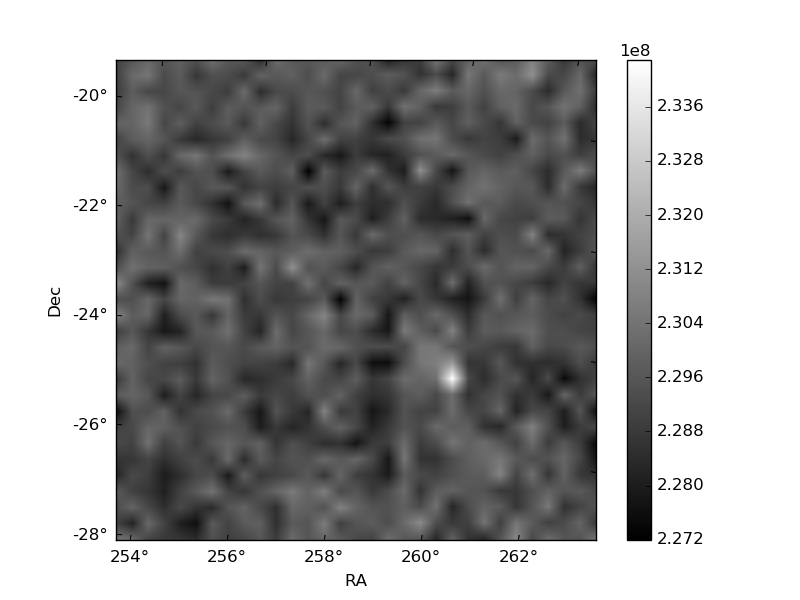
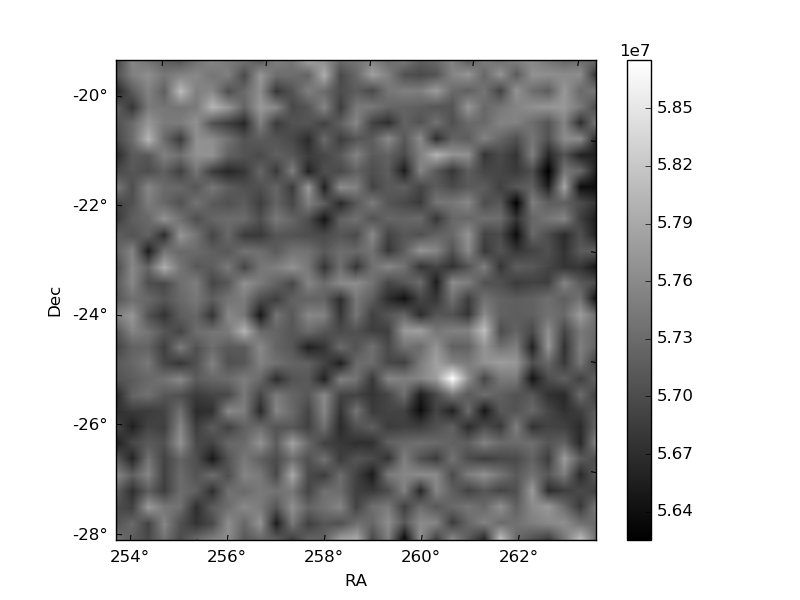
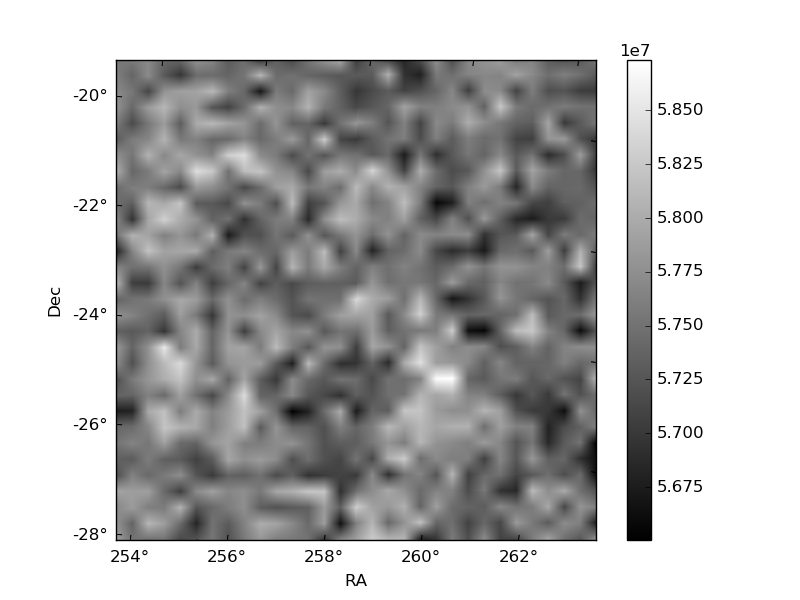
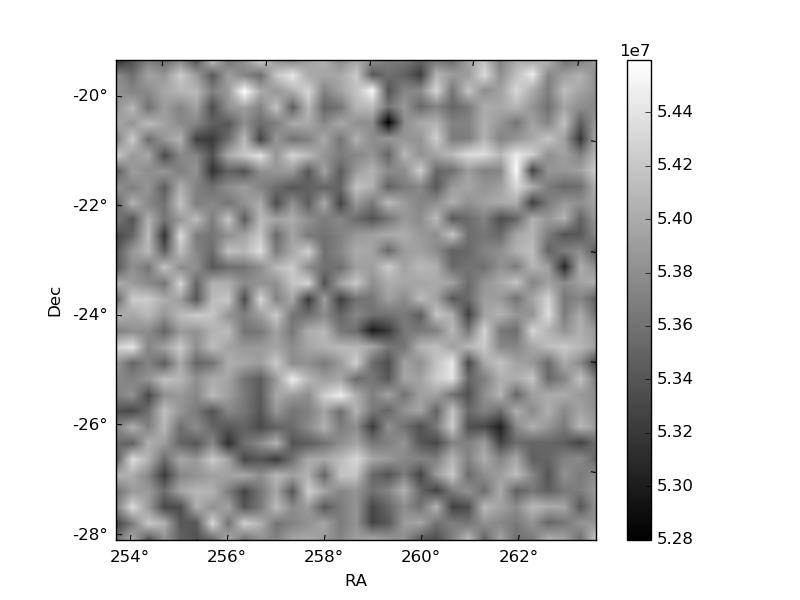
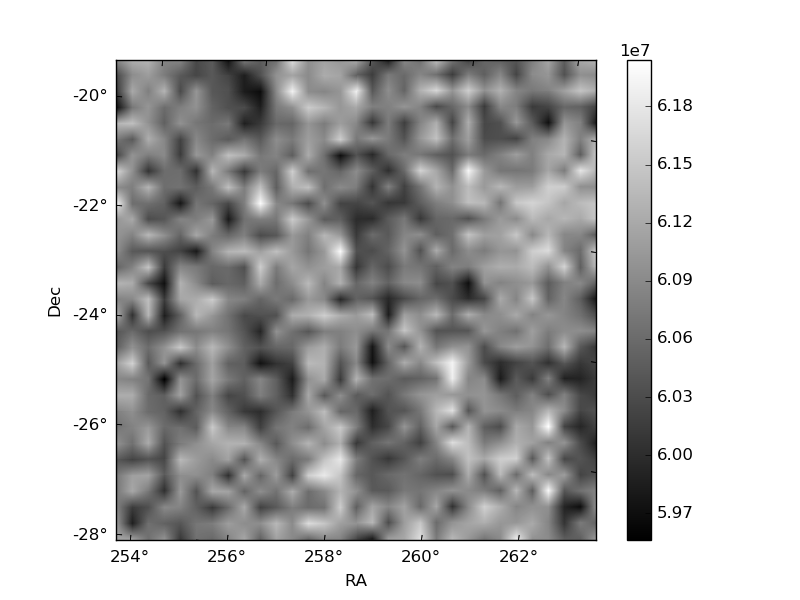
Histogram calculated using DETX and DETY for each event in the final _common_clean file
| Quadrant A | 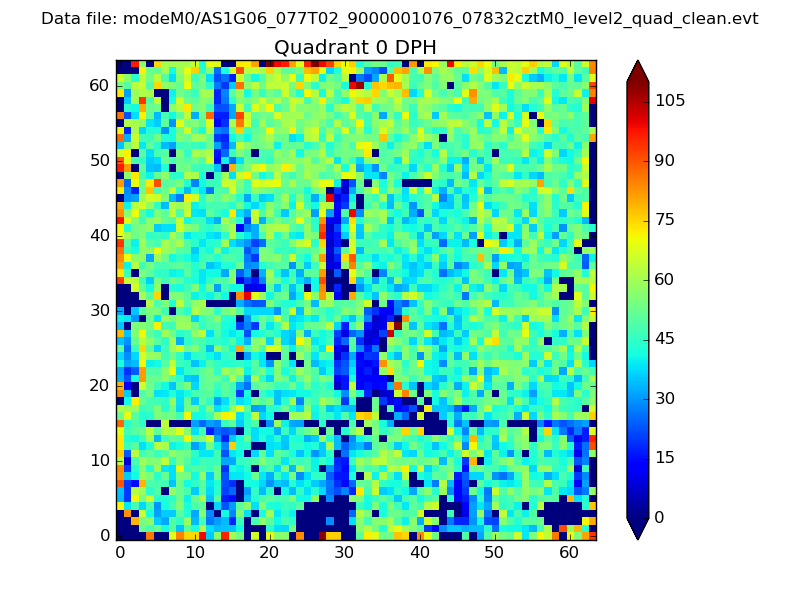 |
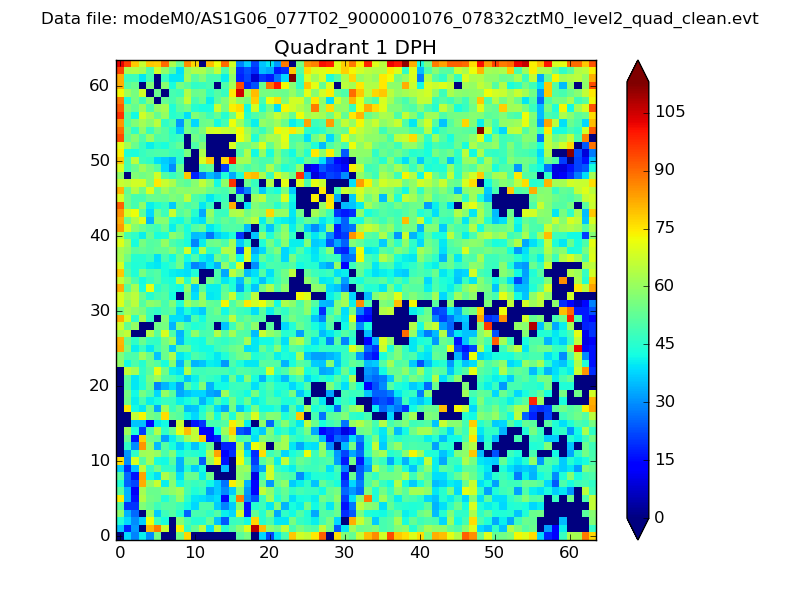 |
Quadrant B |
|---|---|---|---|
| Quadrant D | 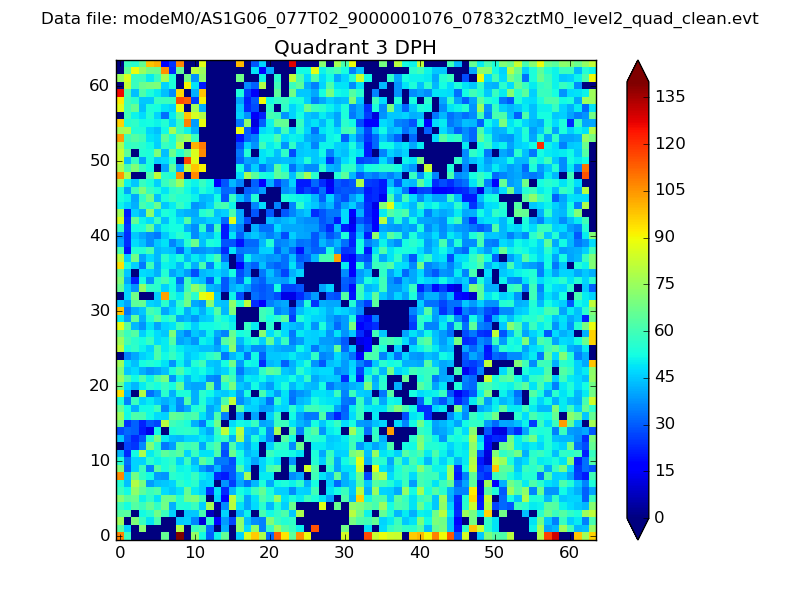 |
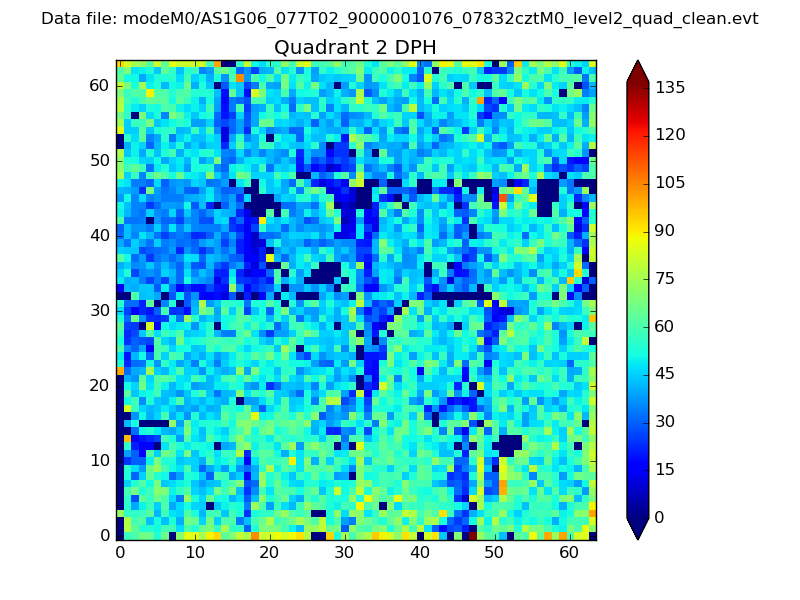 |
Quadrant C |
| Plot type | Count rate plots | Images |
|---|---|---|
| Comparison with Poisson distribution Blue bars denote a histogram of data divided into 1 sec bins. Red curve is a Poisson curve with rate = median count rate of data. |
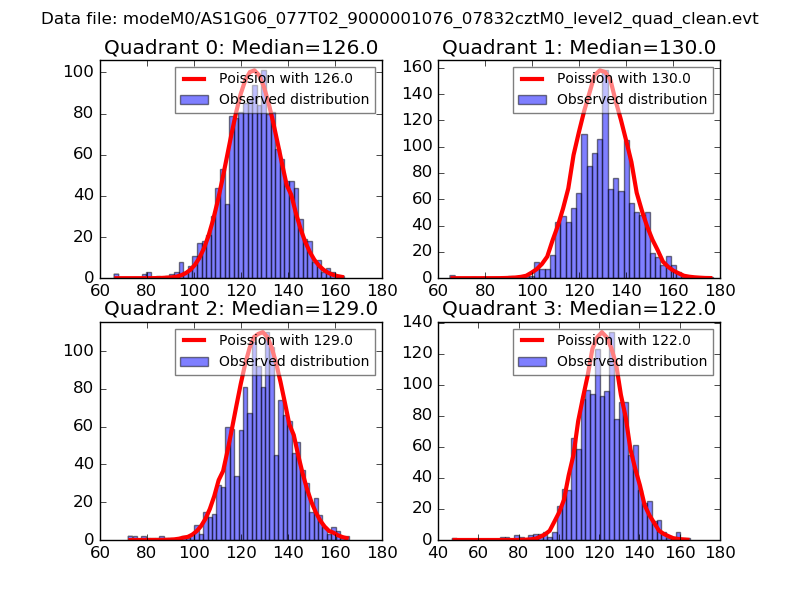 |
 |
| Quadrant-wise count rates Data is divided into 100 sec bins |
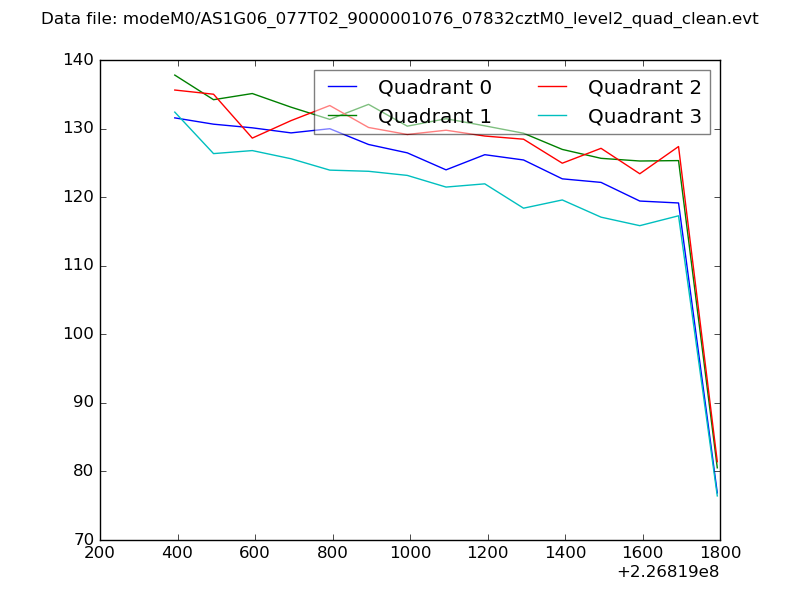 |
|
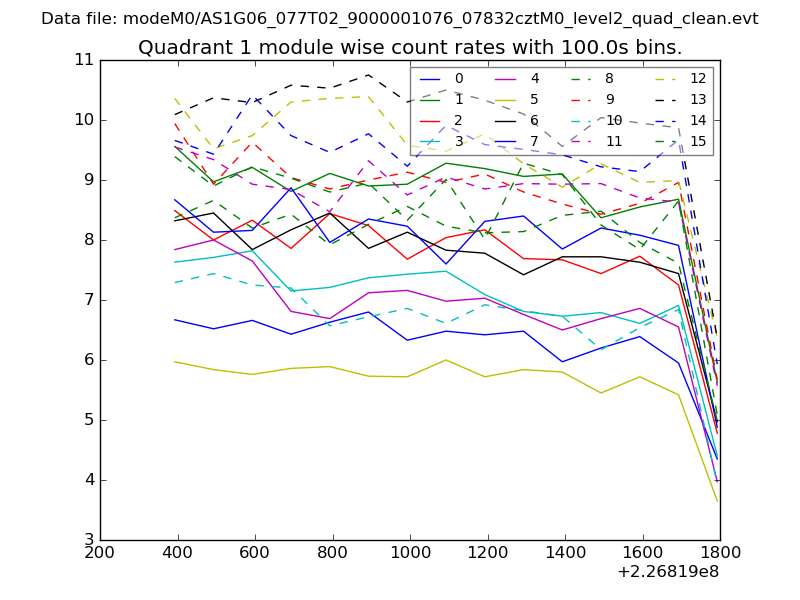
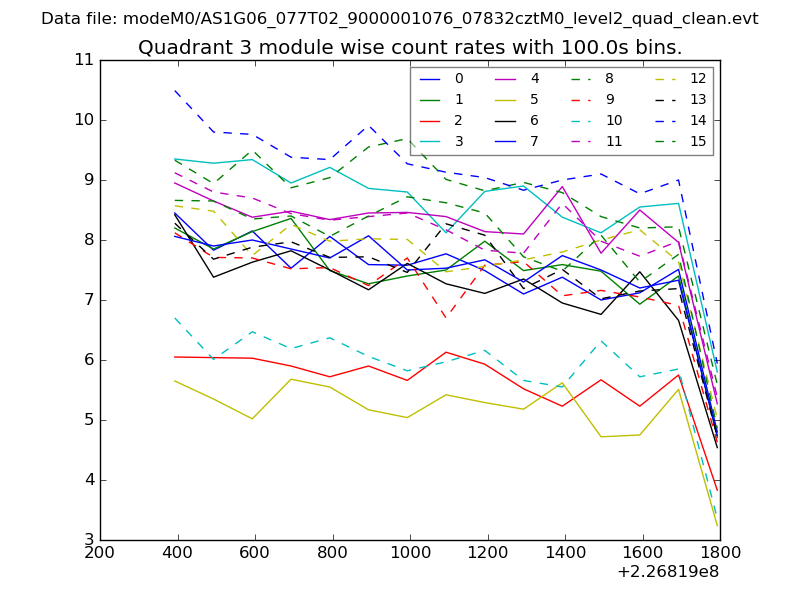
| Module-wise count rates for Quadrant A Data is divided into 100 sec bins |
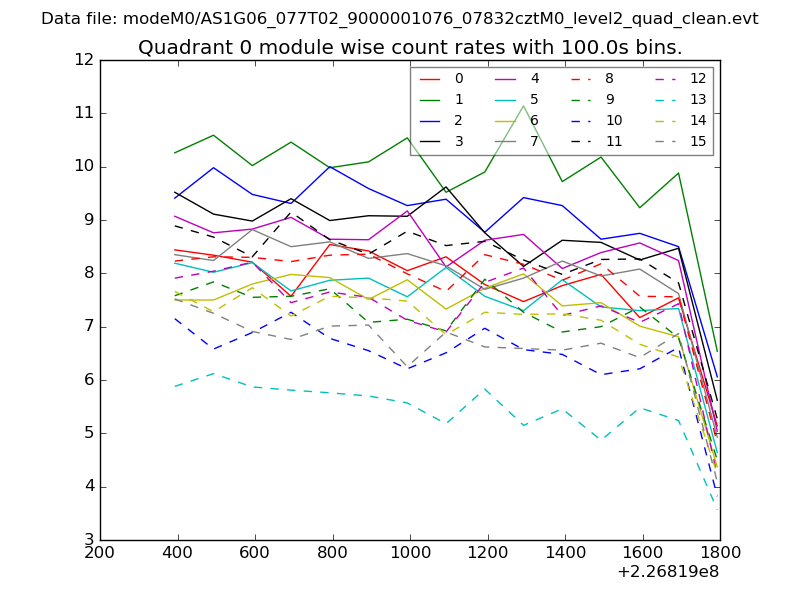 |
 |
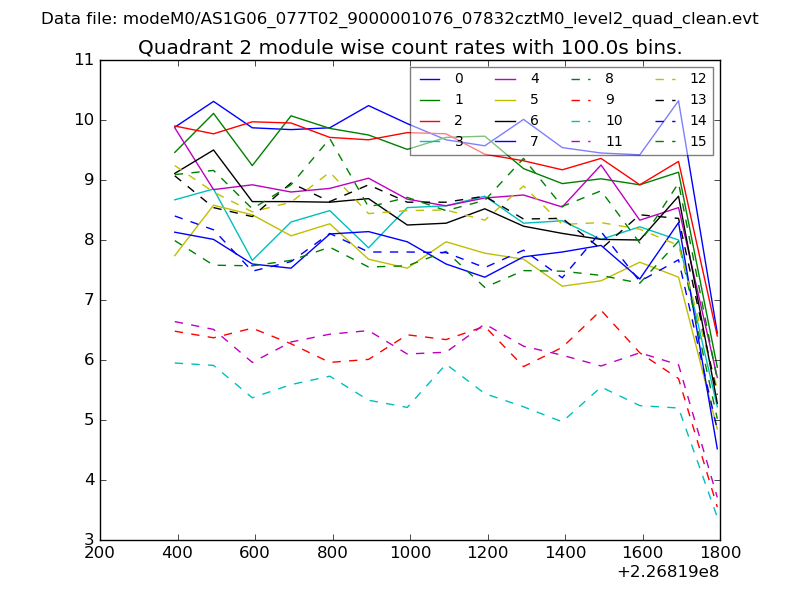
| Module-wise count rates for Quadrant B Data is divided into 100 sec bins |
 |
 |
| Module-wise count rates for Quadrant C Data is divided into 100 sec bins |
 |
 |
| Module-wise count rates for Quadrant D Data is divided into 100 sec bins |
 |
 |
| Parameter | Plot |
|---|---|
| CZT HV Monitor | 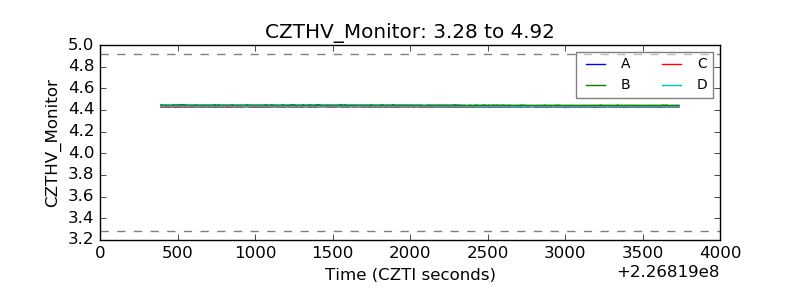 |
| D_VDD |  |
| Temperature 1 | 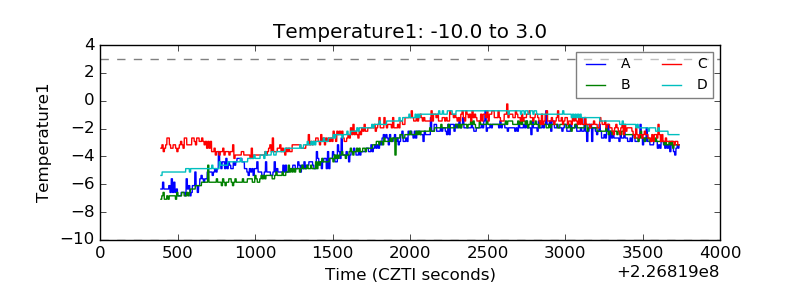 |
| Veto HV Monitor | 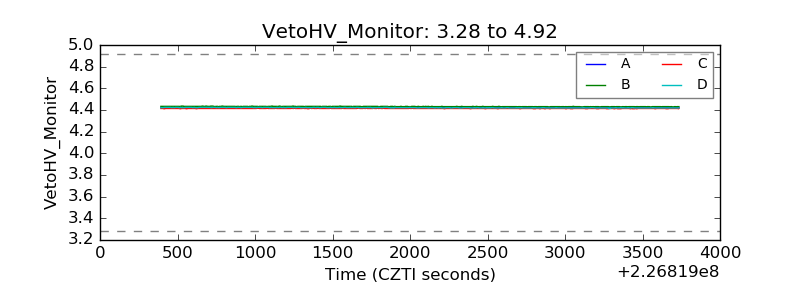 |
| Veto LLD | 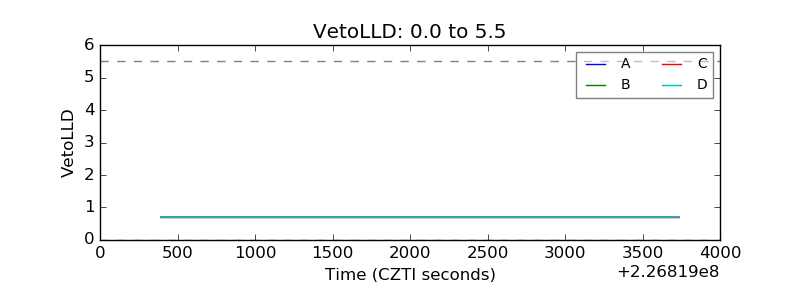 |
| Alpha Counter | 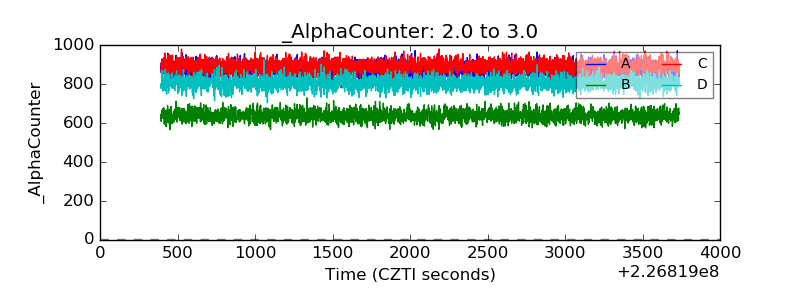 |
| _CPM_Rate | 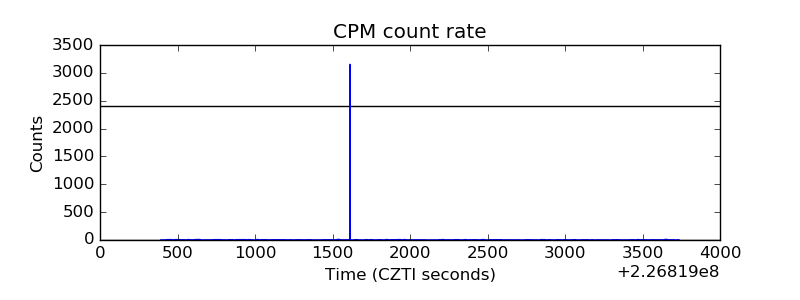 |
| CZT Counter | 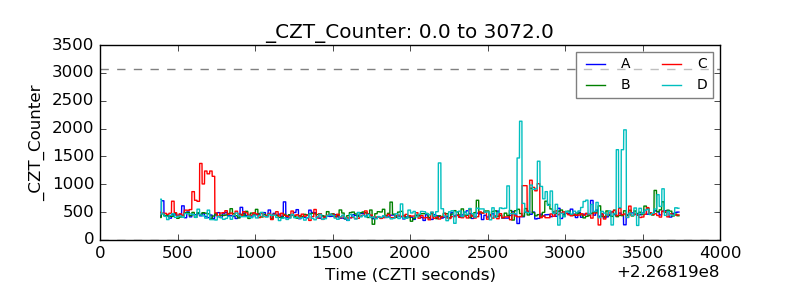 |
| +2.5 Volts monitor |  |
| +5 Volts monitor |  |
| _ROLL_ROT | 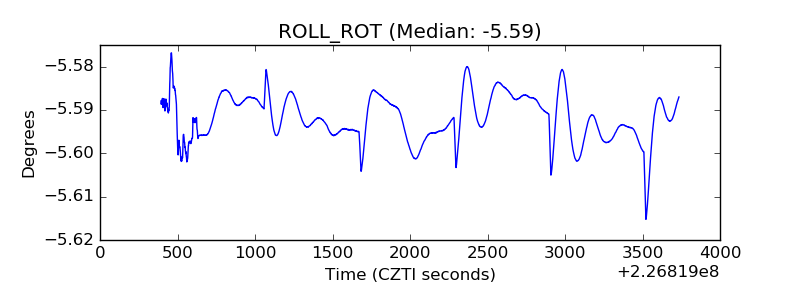 |
| _Roll_DEC | 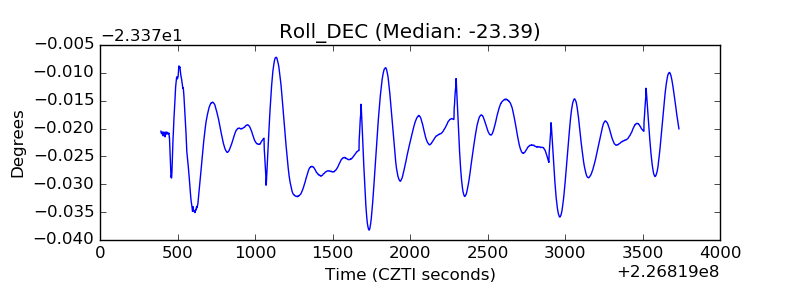 |
| _Roll_RA | 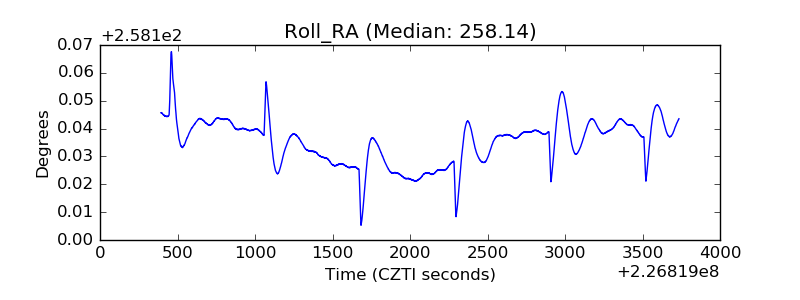 |
| Veto Counter | 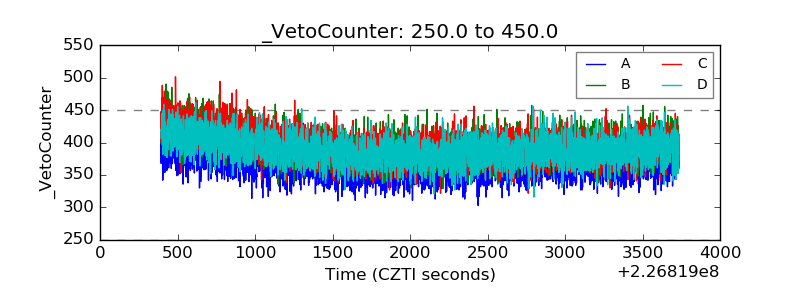 |