| Param | Original file | Final file |
|---|---|---|
| Filename | modeM0/AS1G06_077T02_9000001076_07834cztM0_level2.evt | modeM0/AS1G06_077T02_9000001076_07834cztM0_level2_quad_clean.evt |
| Size (bytes) | 433,653,120 | 75,836,160 |
| Size | 413.6 MB | 72.3 MB |
| Events in quadrant A | 2,737,453 | 468,052 |
| Events in quadrant B | 2,934,782 | 478,445 |
| Events in quadrant C | 4,105,306 | 479,489 |
| Events in quadrant D | 2,952,942 | 456,245 |
| Mode M9 | |||
|---|---|---|---|
| Quadrant | BADHDUFLAG | Total packets | Discarded packets |
| A | 0 | 3 | 0 |
| B | 0 | 3 | 0 |
| C | 0 | 3 | 0 |
| D | 0 | 3 | 0 |
| Mode M0 | |||
|---|---|---|---|
| Quadrant | BADHDUFLAG | Total packets | Discarded packets |
| A | 0 | 12220 | 2 |
| B | 0 | 12520 | 1 |
| C | 0 | 16195 | 1 |
| D | 0 | 12846 | 1 |
| Mode SS | |||
|---|---|---|---|
| Quadrant | BADHDUFLAG | Total packets | Discarded packets |
| A | 0 | 120 | 0 |
| B | 0 | 120 | 0 |
| C | 0 | 120 | 0 |
| D | 0 | 120 | 0 |
| Quadrant | Total seconds | Saturated seconds | Saturation percentage |
|---|---|---|---|
| A | 5926 | 162 | 2.733716% |
| B | 5926 | 184 | 3.104961% |
| C | 5926 | 133 | 2.244347% |
| D | 5926 | 134 | 2.261222% |
Noise dominated data is calculated using 1-second bins in cleaned event files. If a bin has >2000 counts, and if more than 50% of those come from <1% of pixels, then it is considered to be noise-dominated and hence unusable.
| Quadrant | # 1 sec bins | Bins with >0 counts | Bins with >2000 counts | High rate bins dominated by noise | Noise dominated (total time) | Noise dominated (detector-on time) | Marked lightcurve |
|---|---|---|---|---|---|---|---|
| A | 6196 | 5928 | 0 | 0 | 0.00% | 0.00% | 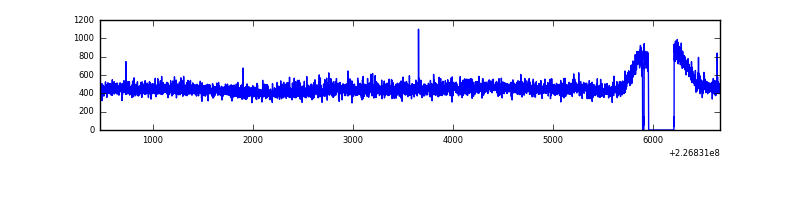 |
| B | 6196 | 5928 | 25 | 25 | 0.40% | 0.42% | 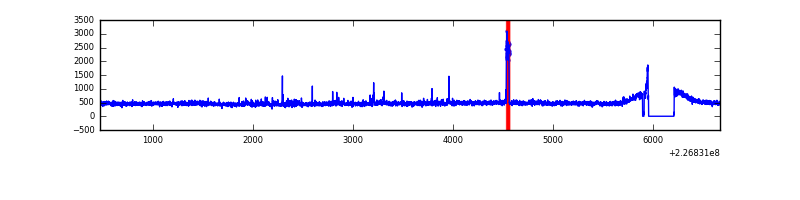 |
| C | 6196 | 5928 | 0 | 0 | 0.00% | 0.00% | 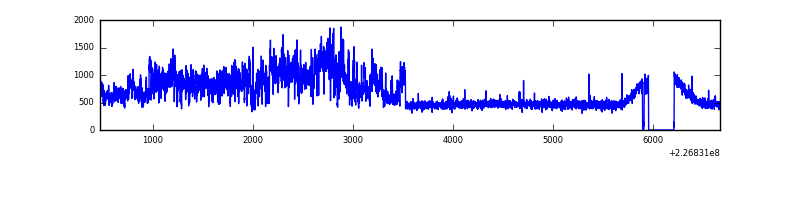 |
| D | 6196 | 5928 | 12 | 12 | 0.19% | 0.20% | 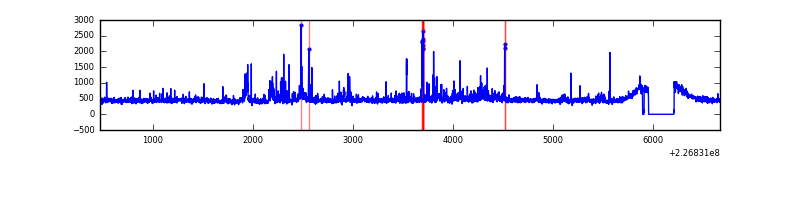 |
Top three noisy pixels from each quadrant. If the there are fewer than three noisy pixels in the level2.evt file, extra rows are filled as -1
| Pixel properties | Quadrant properties | ||||||
|---|---|---|---|---|---|---|---|
| Quadrant | DetID | PixID | Counts | Sigma | Mean | Median | Sigma |
| A | 13 | 14 | 9028 | 58.16 | 707 | 693 | 143.3 |
| A | 0 | 226 | 6540 | 40.8 | 707 | 693 | 143.3 |
| A | 12 | 194 | 6412 | 39.91 | 707 | 693 | 143.3 |
| B | 4 | 239 | 77109 | 557.31 | 712 | 695 | 137.1 |
| B | 0 | 219 | 29565 | 210.56 | 712 | 695 | 137.1 |
| B | 10 | 16 | 21050 | 148.46 | 712 | 695 | 137.1 |
| C | 1 | 16 | 1355751 | 8358.25 | 696 | 700 | 162.1 |
| C | 9 | 243 | 12971 | 75.69 | 696 | 700 | 162.1 |
| C | 9 | 54 | 7355 | 41.05 | 696 | 700 | 162.1 |
| D | 2 | 14 | 56222 | 322.33 | 695 | 671 | 172.3 |
| D | 2 | 152 | 52057 | 298.16 | 695 | 671 | 172.3 |
| D | 12 | 33 | 48229 | 275.95 | 695 | 671 | 172.3 |
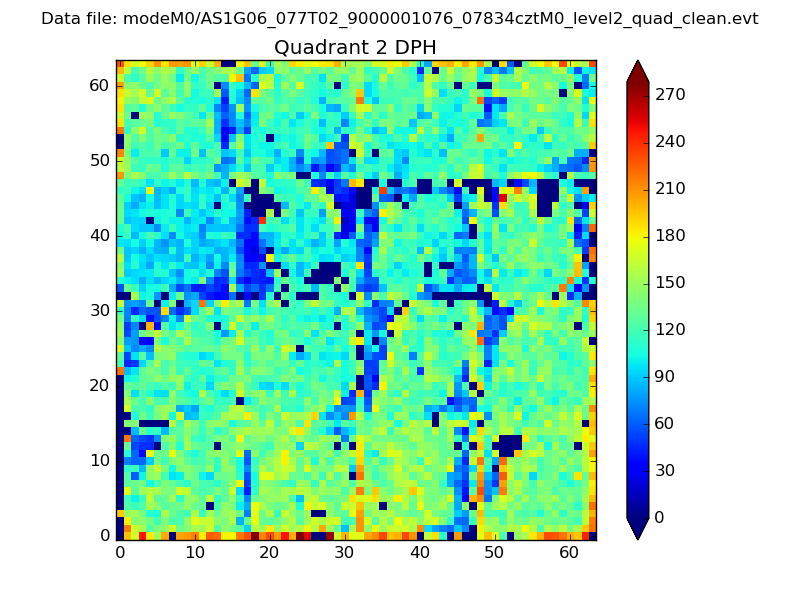
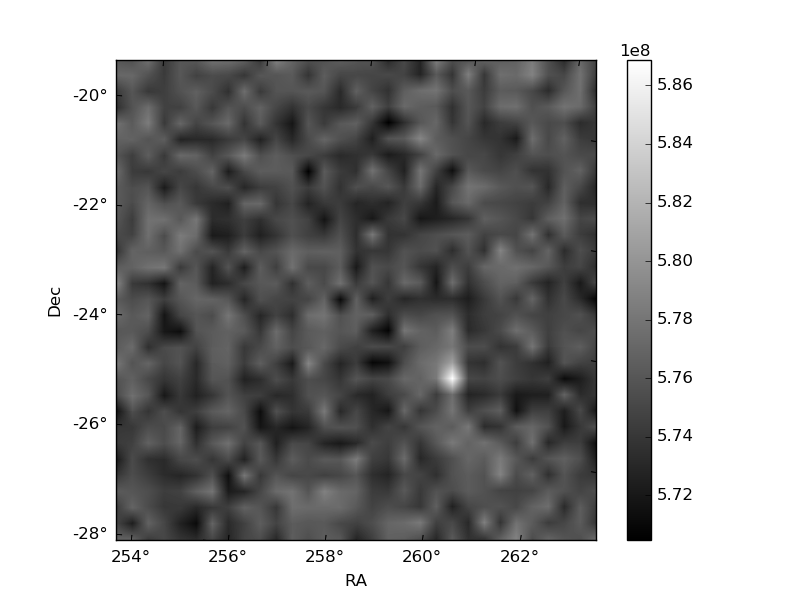
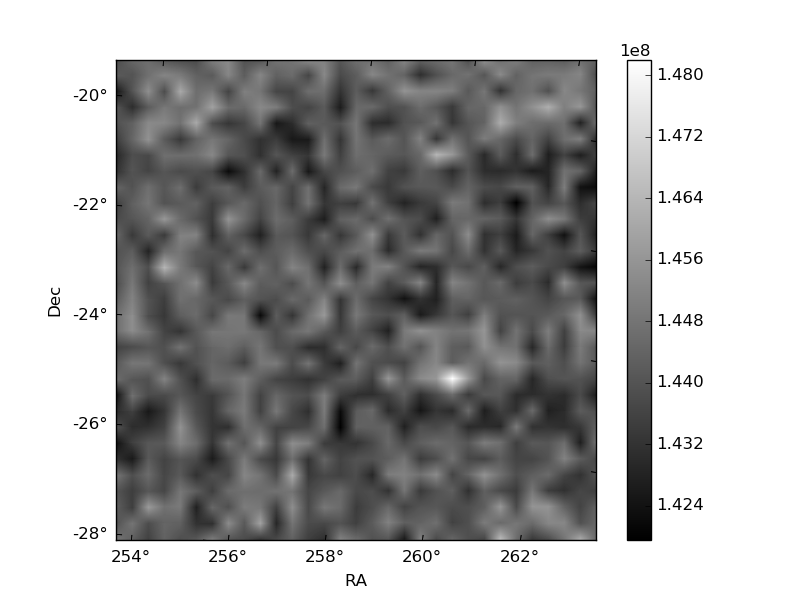
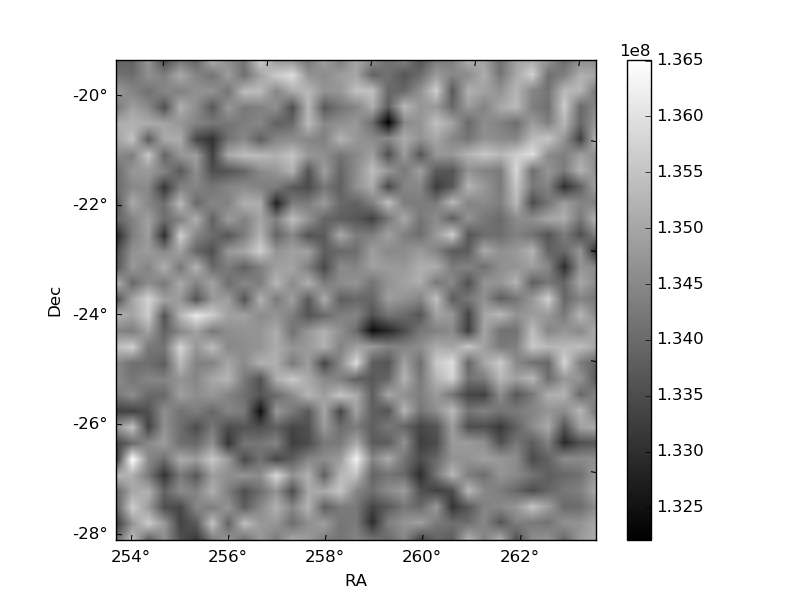
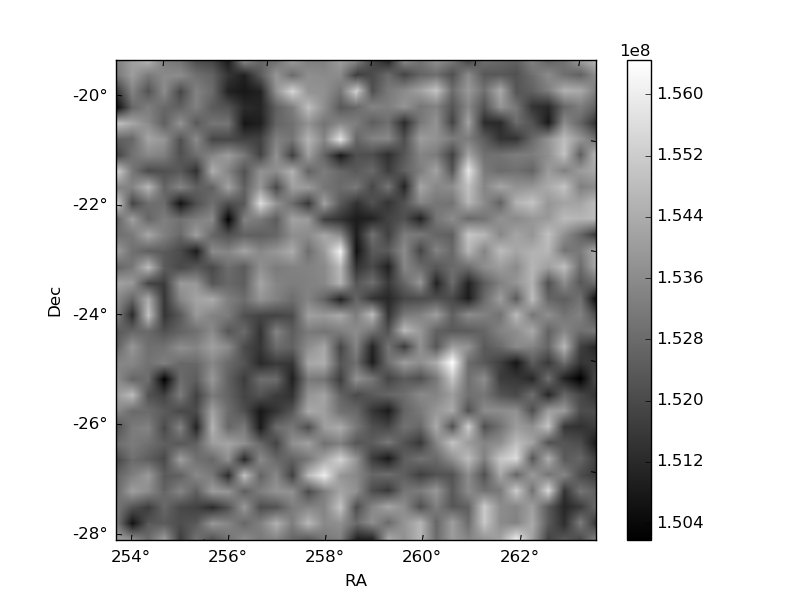
Histogram calculated using DETX and DETY for each event in the final _common_clean file
| Quadrant A | 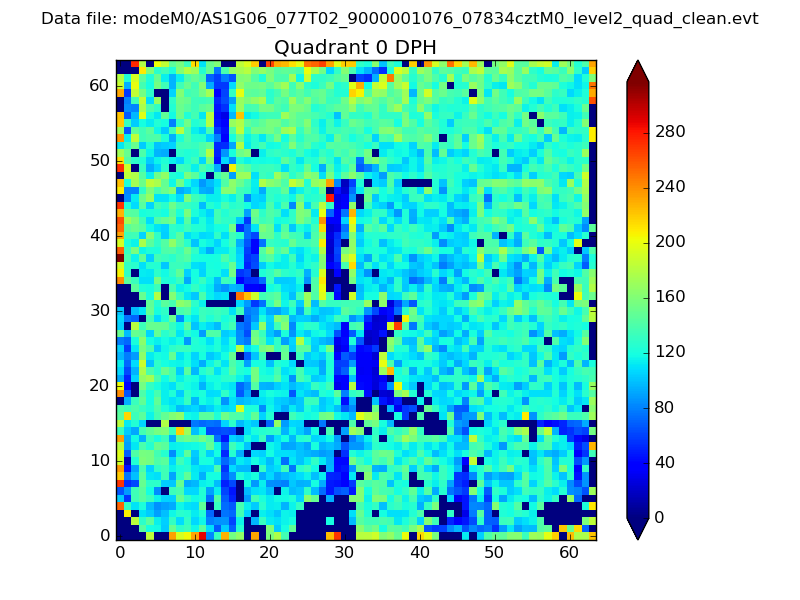 |
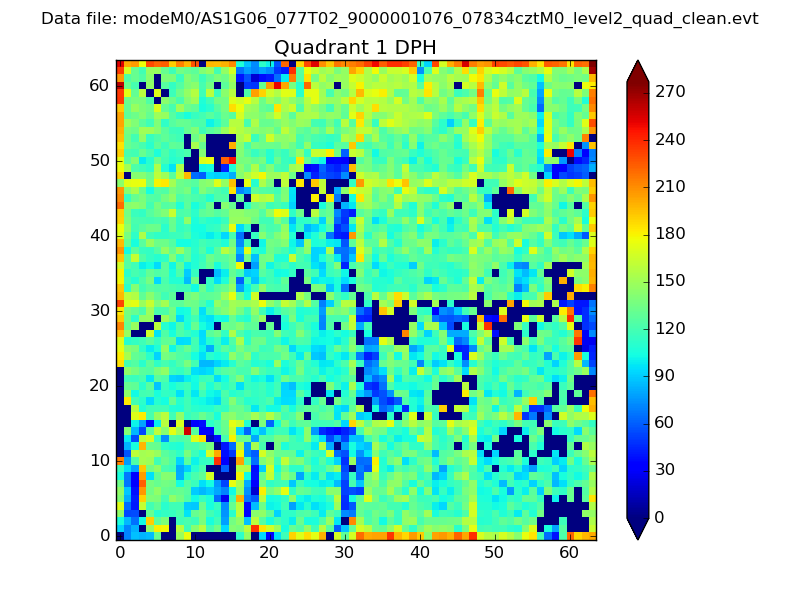 |
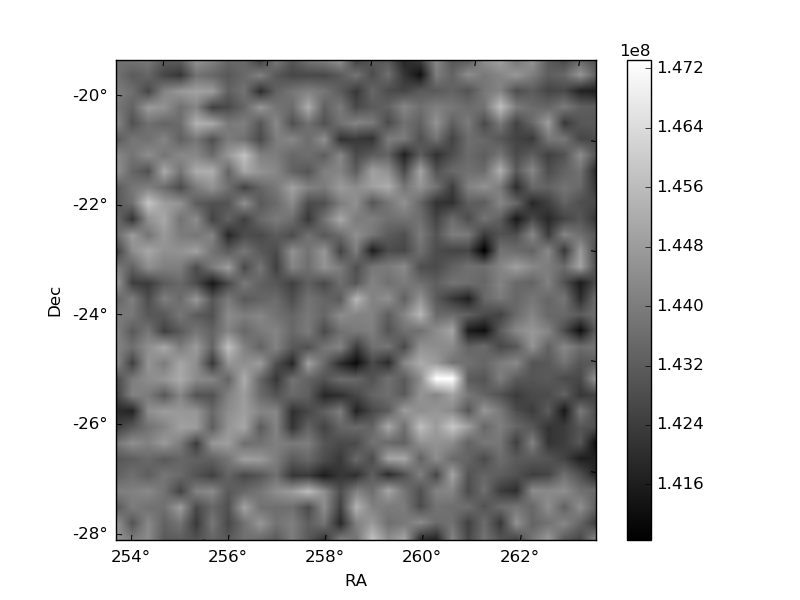
Quadrant B |
|---|---|---|---|
| Quadrant D | 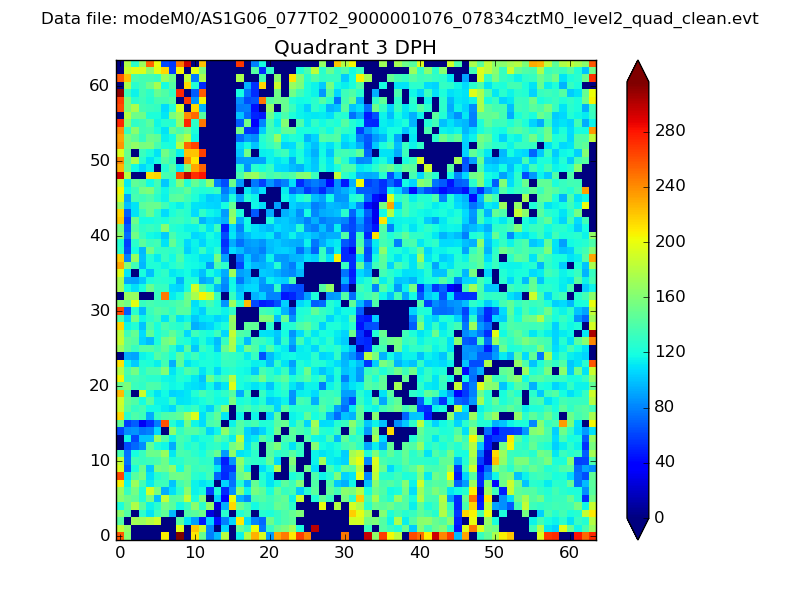 |
 |
Quadrant C |
| Plot type | Count rate plots | Images |
|---|---|---|
| Comparison with Poisson distribution Blue bars denote a histogram of data divided into 1 sec bins. Red curve is a Poisson curve with rate = median count rate of data. |
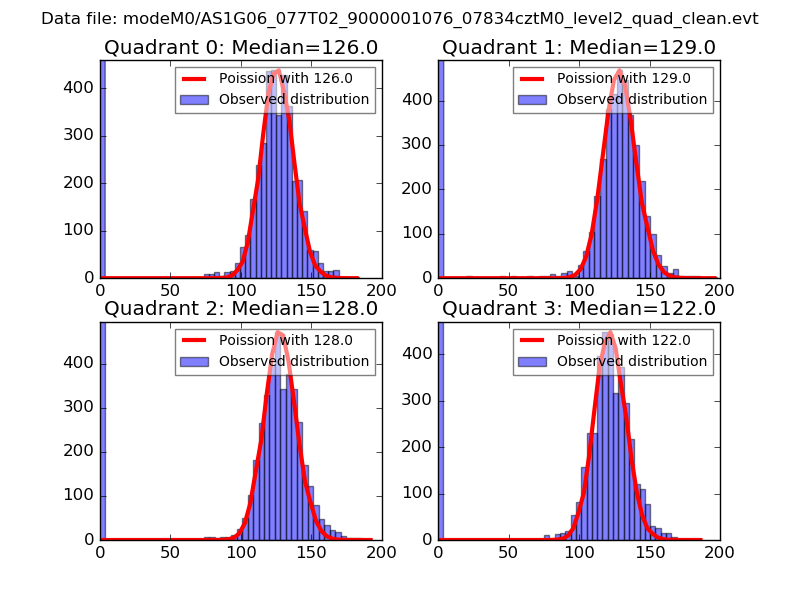 |
 |
| Quadrant-wise count rates Data is divided into 100 sec bins |
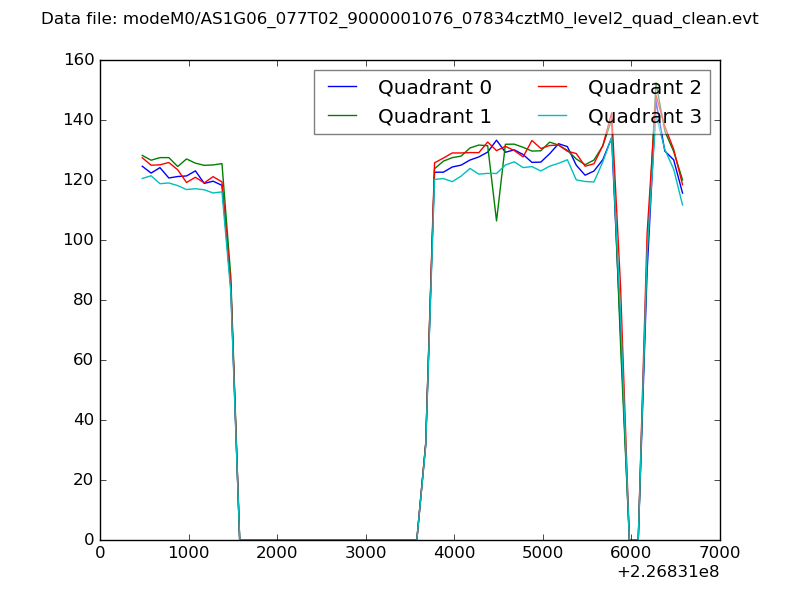 |
|
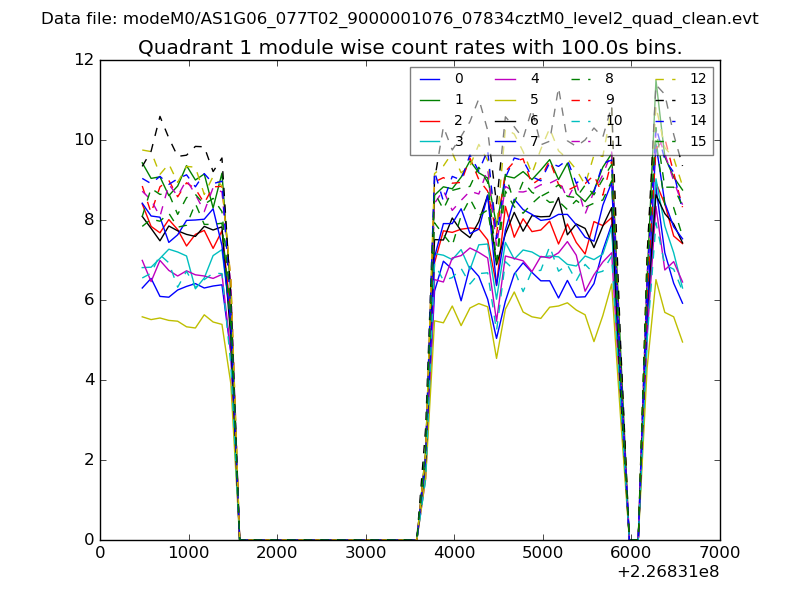
| Module-wise count rates for Quadrant A Data is divided into 100 sec bins |
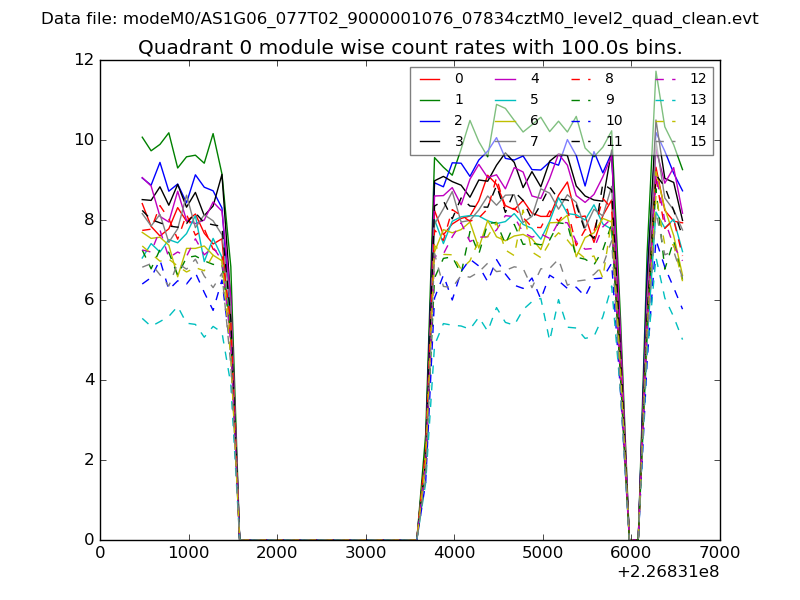 |
 |
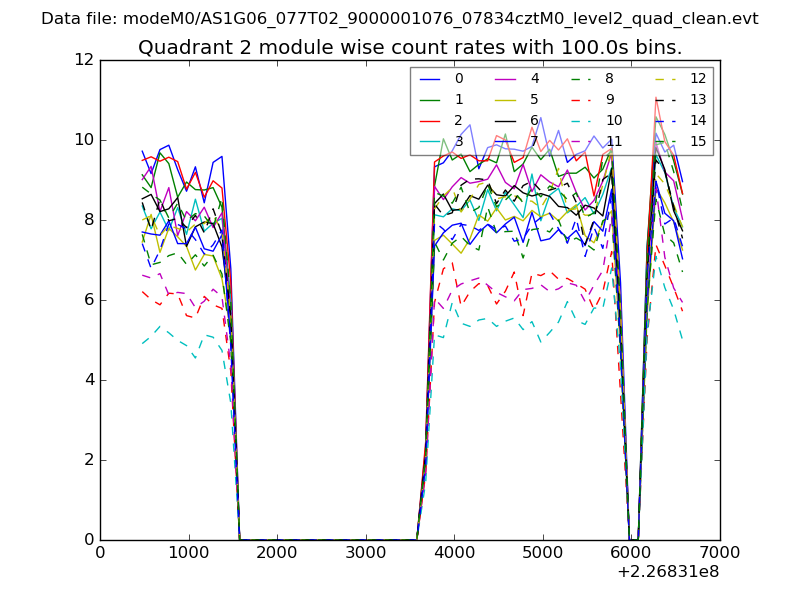
| Module-wise count rates for Quadrant B Data is divided into 100 sec bins |
 |
 |
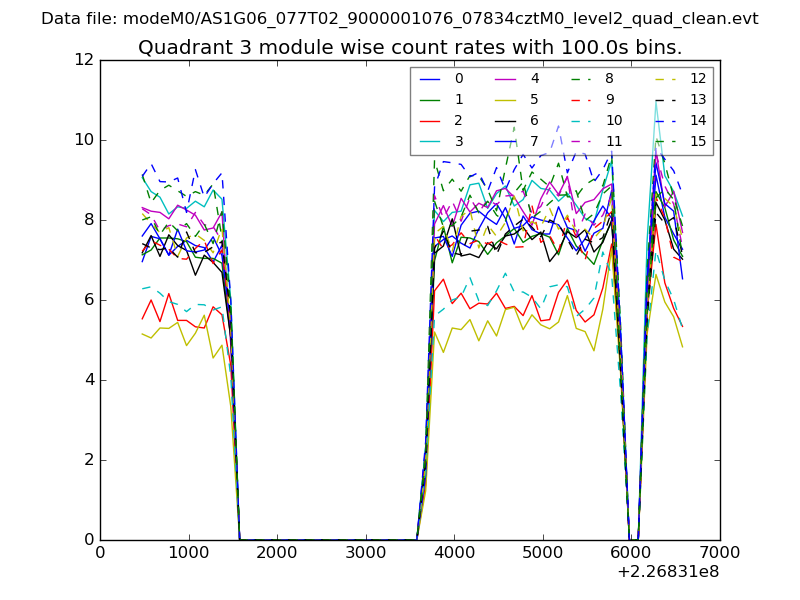
| Module-wise count rates for Quadrant C Data is divided into 100 sec bins |
 |
 |
| Module-wise count rates for Quadrant D Data is divided into 100 sec bins |
 |
 |
| Parameter | Plot |
|---|---|
| CZT HV Monitor | 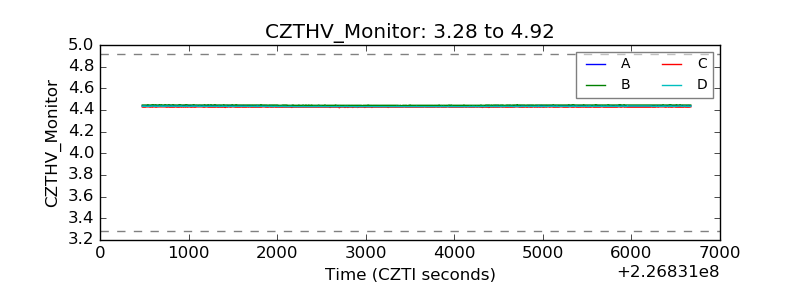 |
| D_VDD | 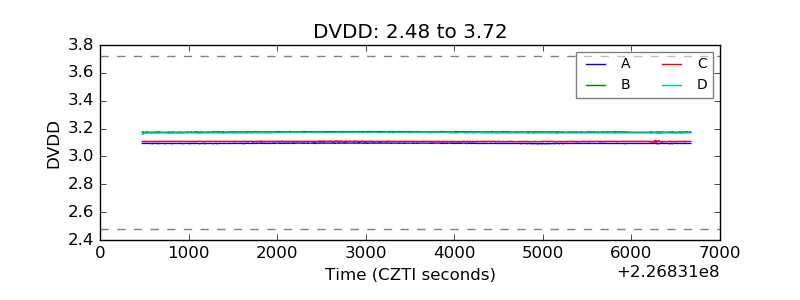 |
| Temperature 1 | 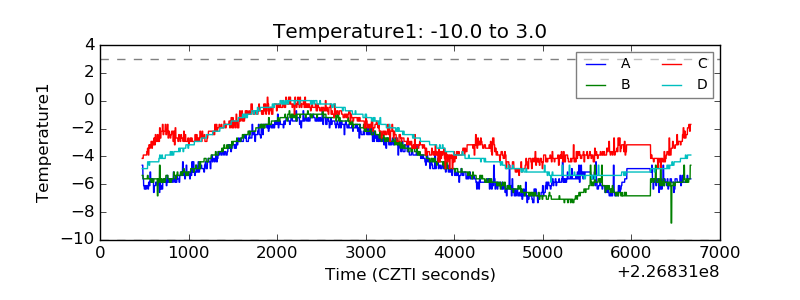 |
| Veto HV Monitor |  |
| Veto LLD | 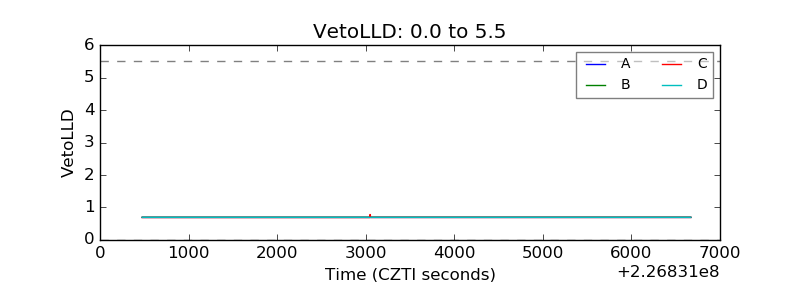 |
| Alpha Counter | 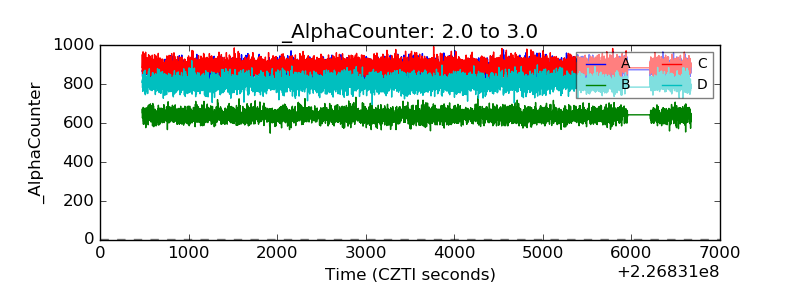 |
| _CPM_Rate | 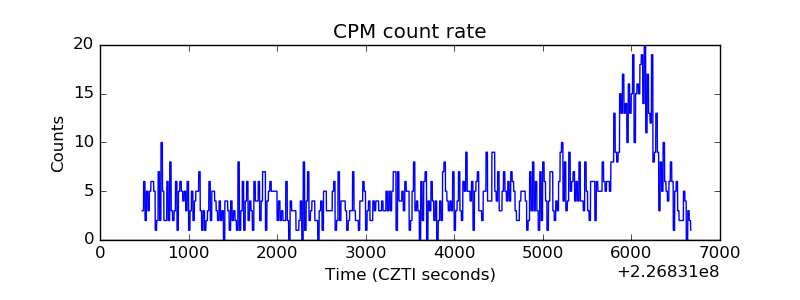 |
| CZT Counter | 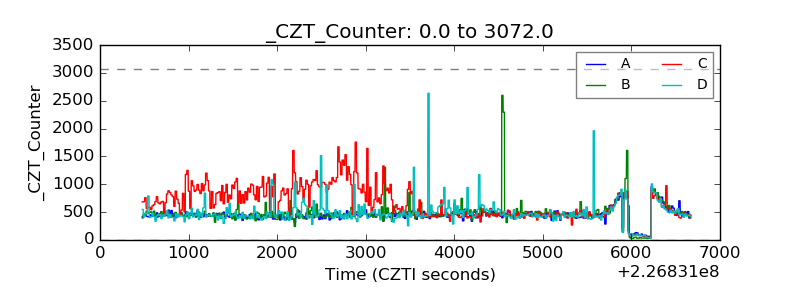 |
| +2.5 Volts monitor |  |
| +5 Volts monitor |  |
| _ROLL_ROT | 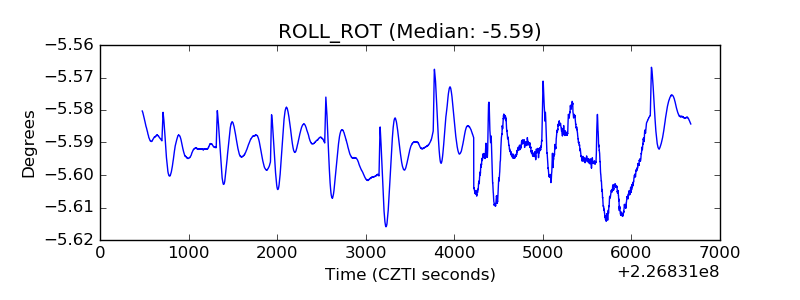 |
| _Roll_DEC | 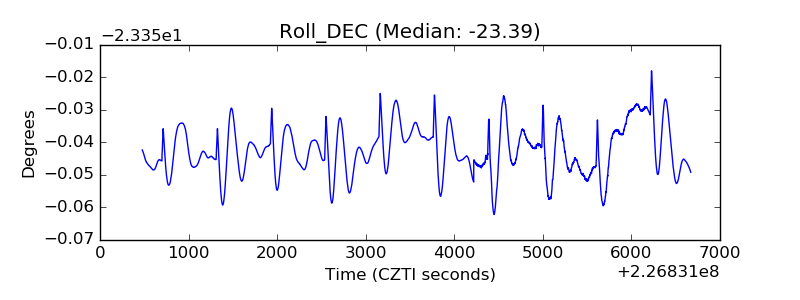 |
| _Roll_RA | 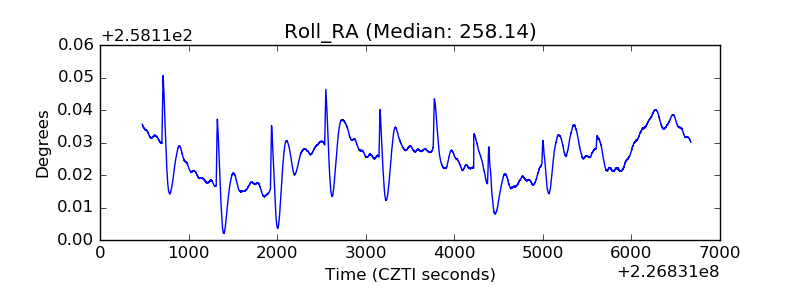 |
| Veto Counter | 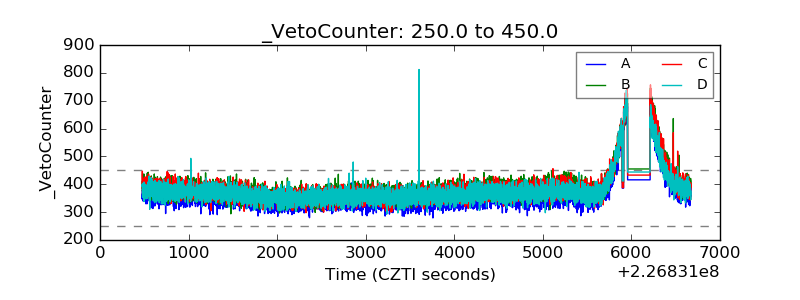 |