| Param | Original file | Final file |
|---|---|---|
| Filename | modeM0/AS1G06_077T02_9000001076_07839cztM0_level2.evt | modeM0/AS1G06_077T02_9000001076_07839cztM0_level2_quad_clean.evt |
| Size (bytes) | 1,912,639,680 | 354,343,680 |
| Size | 1.8 GB | 337.9 MB |
| Events in quadrant A | 13,036,543 | 2,209,082 |
| Events in quadrant B | 14,314,086 | 2,249,028 |
| Events in quadrant C | 14,502,343 | 2,246,055 |
| Events in quadrant D | 14,217,664 | 2,141,211 |
| Mode M9 | |||
|---|---|---|---|
| Quadrant | BADHDUFLAG | Total packets | Discarded packets |
| A | 0 | 27 | 0 |
| B | 0 | 27 | 0 |
| C | 0 | 27 | 0 |
| D | 0 | 27 | 0 |
| Mode M0 | |||
|---|---|---|---|
| Quadrant | BADHDUFLAG | Total packets | Discarded packets |
| A | 0 | 57599 | 6 |
| B | 0 | 60350 | 5 |
| C | 0 | 61673 | 5 |
| D | 0 | 61408 | 5 |
| Mode SS | |||
|---|---|---|---|
| Quadrant | BADHDUFLAG | Total packets | Discarded packets |
| A | 0 | 558 | 0 |
| B | 0 | 558 | 0 |
| C | 0 | 558 | 0 |
| D | 0 | 558 | 0 |
| Quadrant | Total seconds | Saturated seconds | Saturation percentage |
|---|---|---|---|
| A | 27451 | 581 | 2.116498% |
| B | 27451 | 768 | 2.797712% |
| C | 27451 | 533 | 1.941641% |
| D | 27451 | 582 | 2.120141% |
Noise dominated data is calculated using 1-second bins in cleaned event files. If a bin has >2000 counts, and if more than 50% of those come from <1% of pixels, then it is considered to be noise-dominated and hence unusable.
| Quadrant | # 1 sec bins | Bins with >0 counts | Bins with >2000 counts | High rate bins dominated by noise | Noise dominated (total time) | Noise dominated (detector-on time) | Marked lightcurve |
|---|---|---|---|---|---|---|---|
| A | 30071 | 27456 | 86 | 86 | 0.29% | 0.31% | 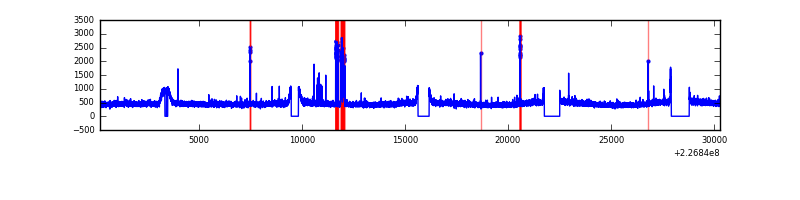 |
| B | 30071 | 27457 | 222 | 222 | 0.74% | 0.81% | 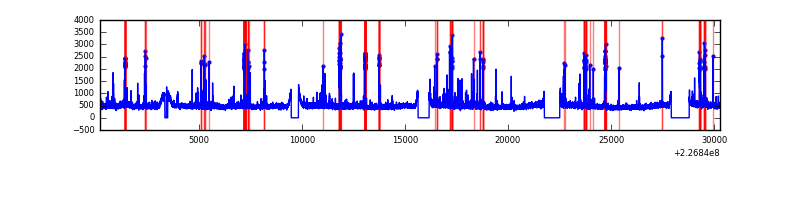 |
| C | 30071 | 27457 | 151 | 151 | 0.50% | 0.55% | 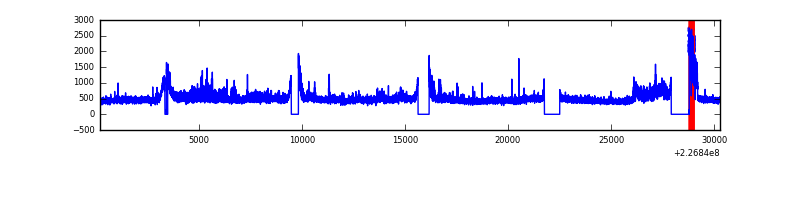 |
| D | 30071 | 27457 | 221 | 221 | 0.73% | 0.80% | 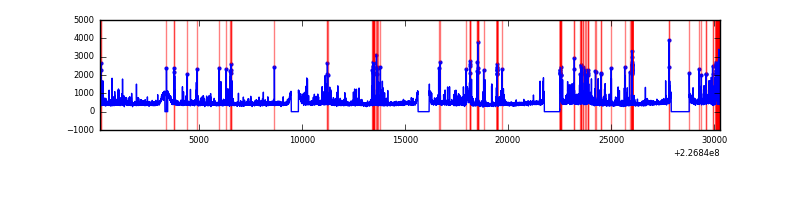 |
Top three noisy pixels from each quadrant. If the there are fewer than three noisy pixels in the level2.evt file, extra rows are filled as -1
| Pixel properties | Quadrant properties | ||||||
|---|---|---|---|---|---|---|---|
| Quadrant | DetID | PixID | Counts | Sigma | Mean | Median | Sigma |
| A | 0 | 128 | 380263 | 573.2 | 3263 | 3197 | 657.8 |
| A | 8 | 6 | 41792 | 58.67 | 3263 | 3197 | 657.8 |
| A | 0 | 226 | 30560 | 41.6 | 3263 | 3197 | 657.8 |
| B | 4 | 239 | 951288 | 1515.2 | 3290 | 3215 | 625.7 |
| B | 0 | 219 | 140438 | 219.31 | 3290 | 3215 | 625.7 |
| B | 4 | 173 | 121457 | 188.97 | 3290 | 3215 | 625.7 |
| C | 1 | 16 | 1919007 | 2595.54 | 3198 | 3222 | 738.1 |
| C | 8 | 229 | 75767 | 98.28 | 3198 | 3222 | 738.1 |
| C | 13 | 61 | 24771 | 29.19 | 3198 | 3222 | 738.1 |
| D | 2 | 152 | 599805 | 771.23 | 3188 | 3093 | 773.7 |
| D | 2 | 136 | 528169 | 678.64 | 3188 | 3093 | 773.7 |
| D | 13 | 137 | 255555 | 326.3 | 3188 | 3093 | 773.7 |
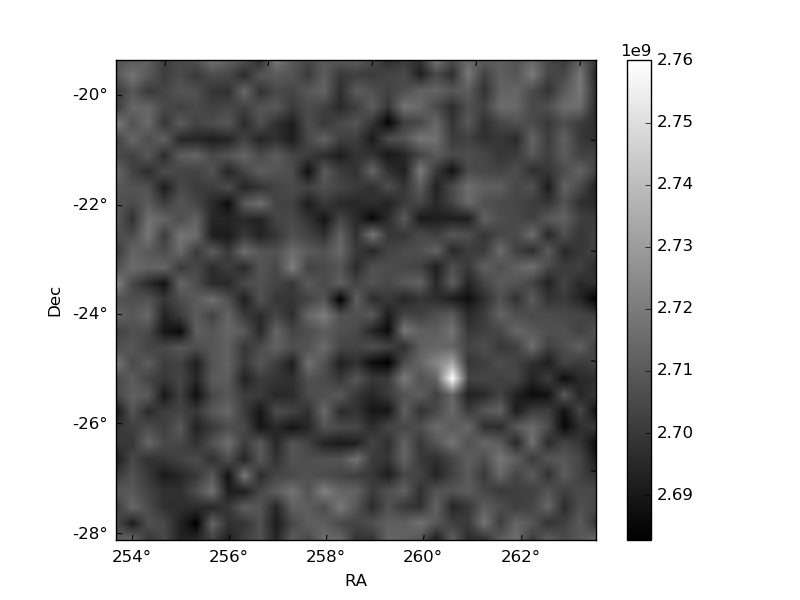
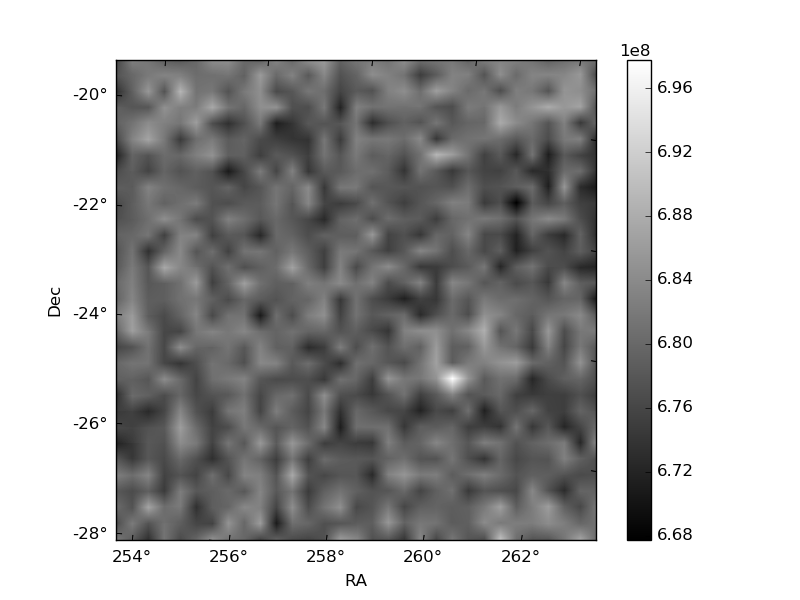
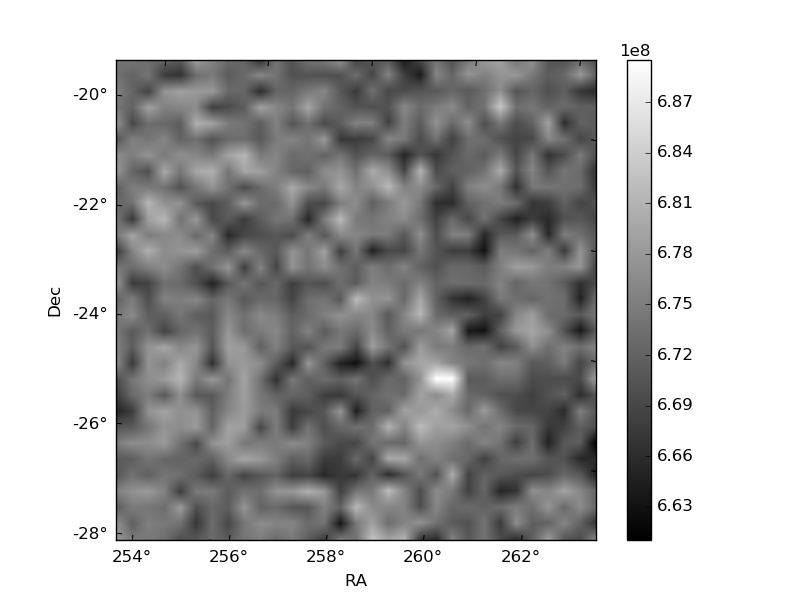
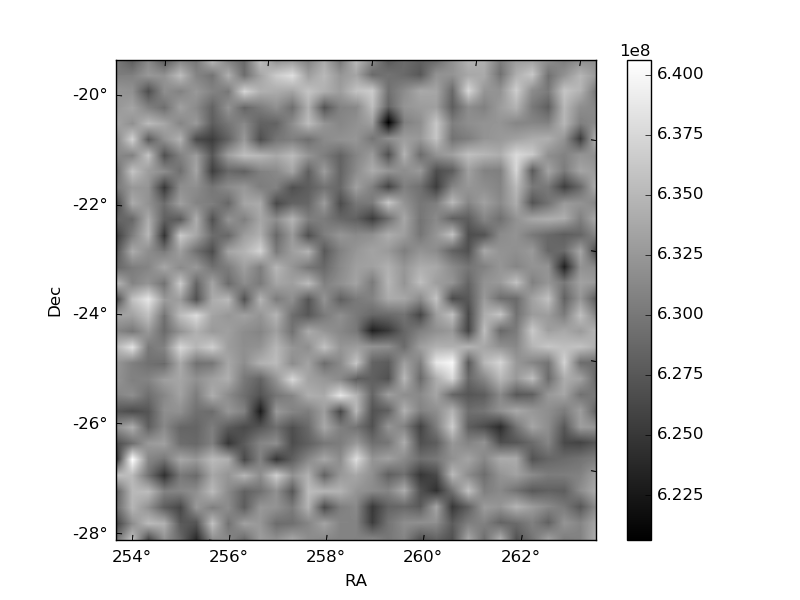
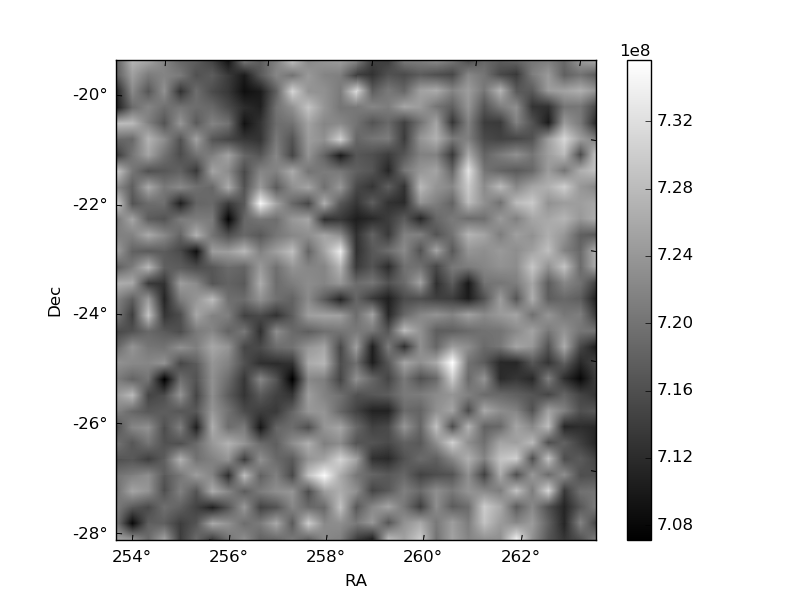
Histogram calculated using DETX and DETY for each event in the final _common_clean file
| Quadrant A | 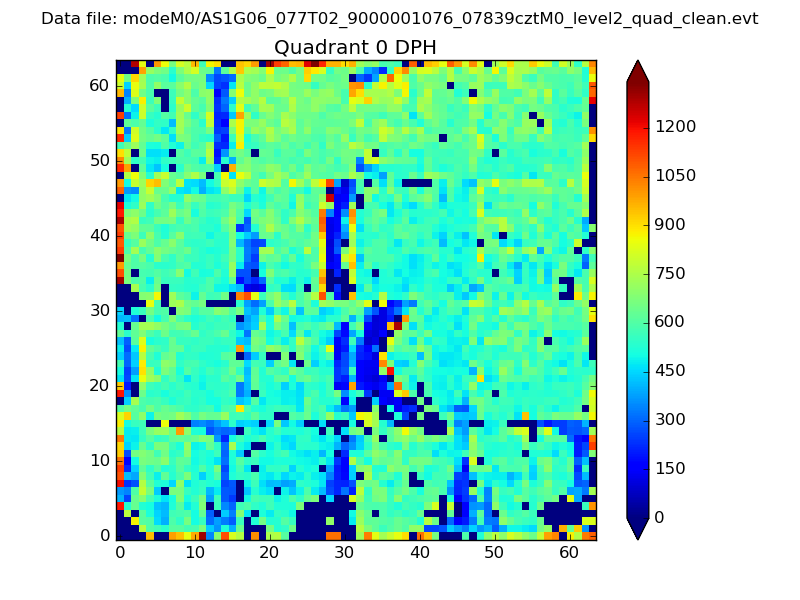 |
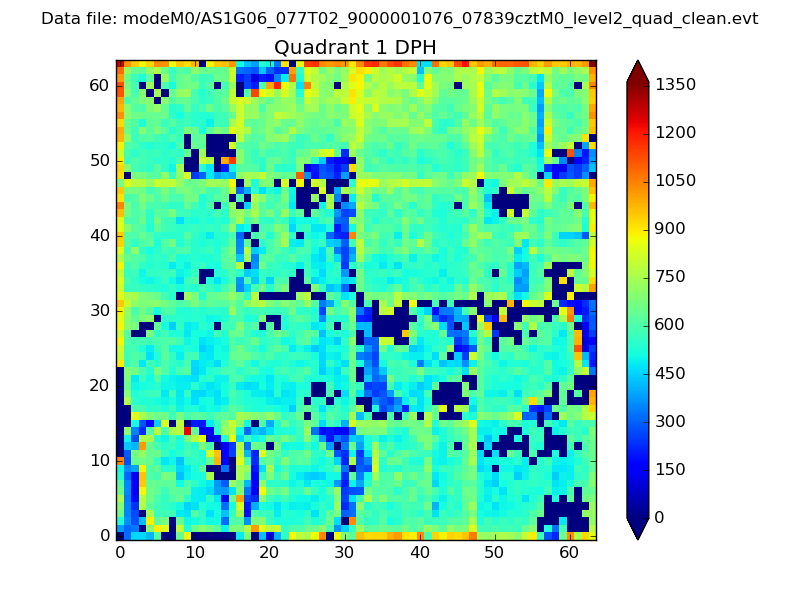 |
Quadrant B |
|---|---|---|---|
| Quadrant D | 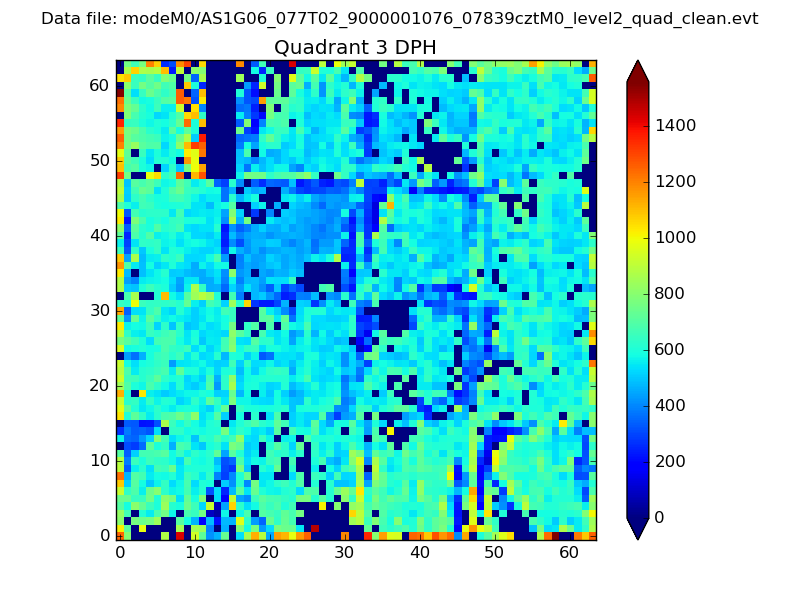 |
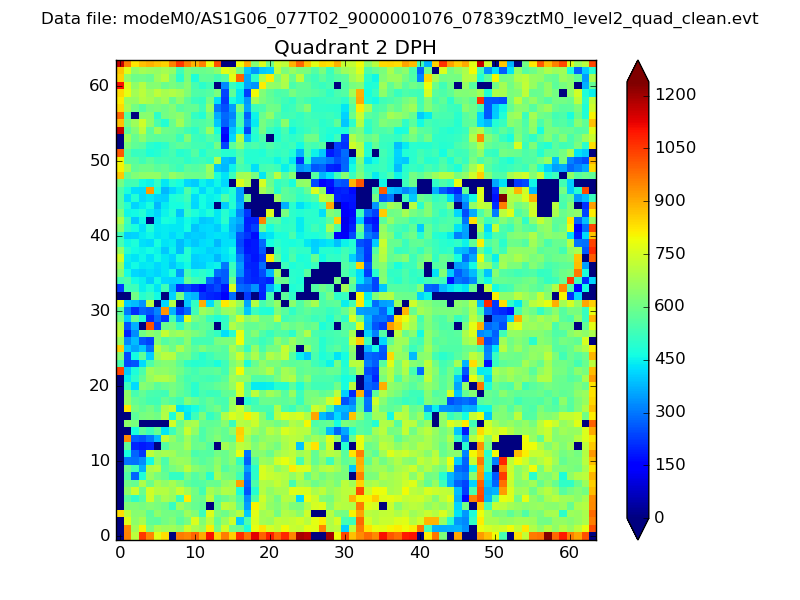 |
Quadrant C |
| Plot type | Count rate plots | Images |
|---|---|---|
| Comparison with Poisson distribution Blue bars denote a histogram of data divided into 1 sec bins. Red curve is a Poisson curve with rate = median count rate of data. |
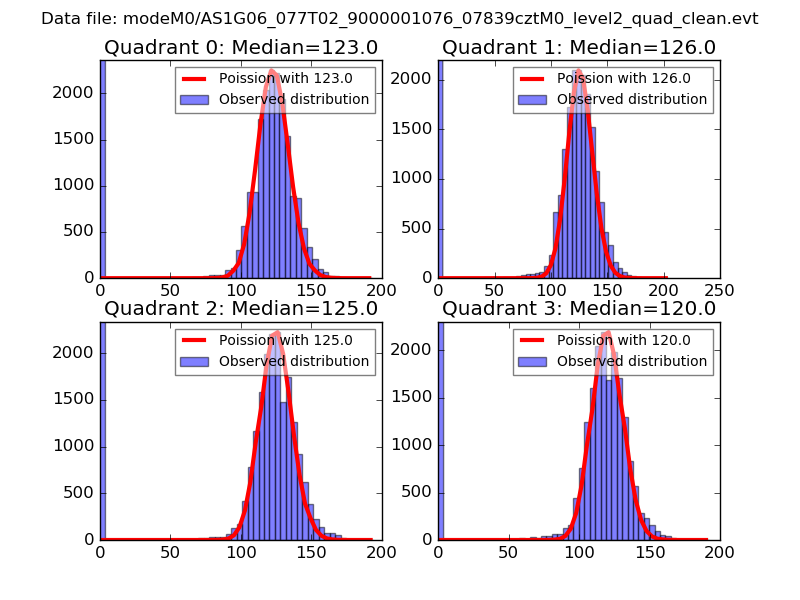 |
 |
| Quadrant-wise count rates Data is divided into 100 sec bins |
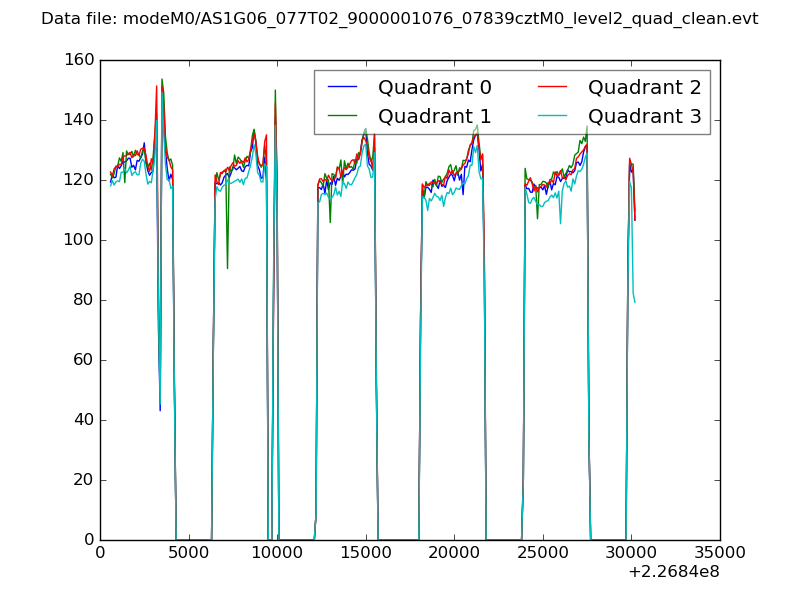 |
|
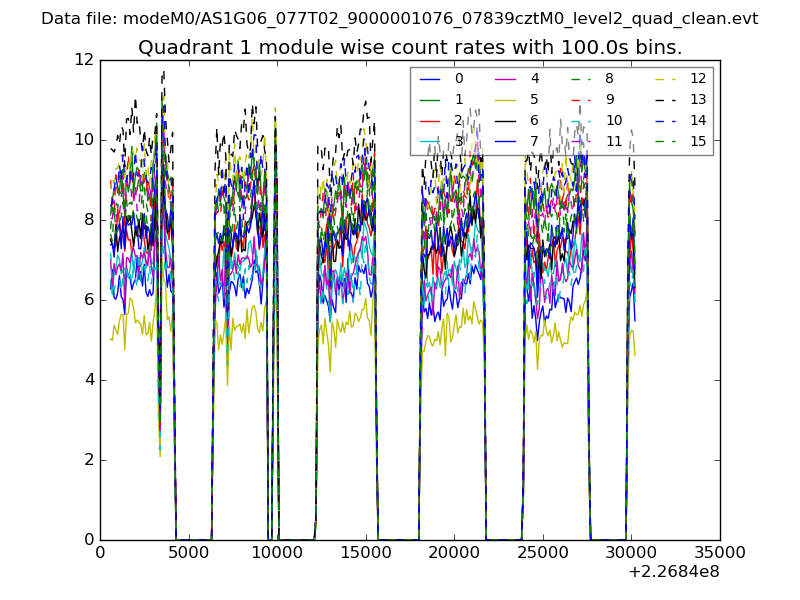
| Module-wise count rates for Quadrant A Data is divided into 100 sec bins |
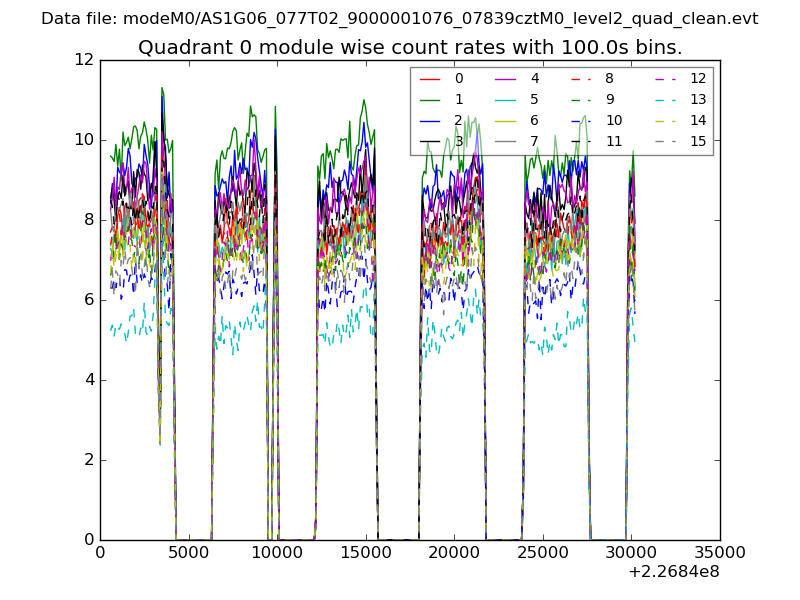 |
 |
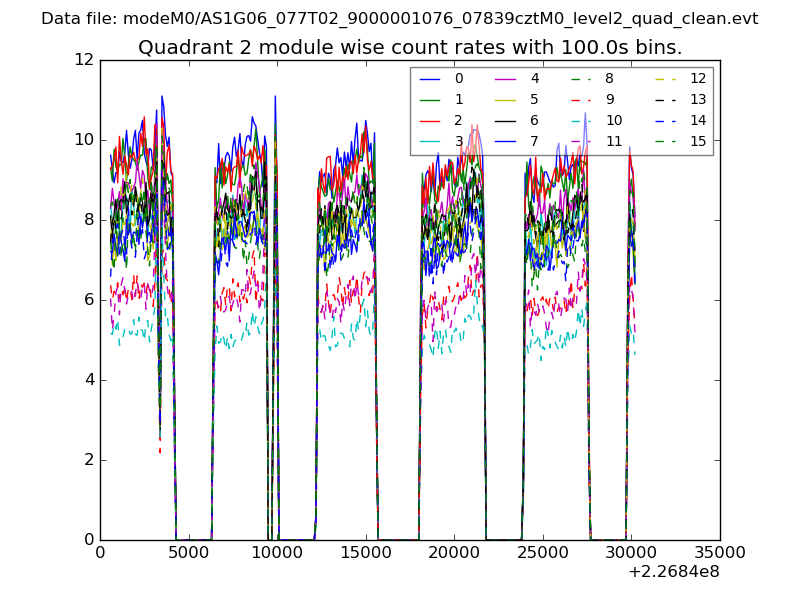
| Module-wise count rates for Quadrant B Data is divided into 100 sec bins |
 |
 |
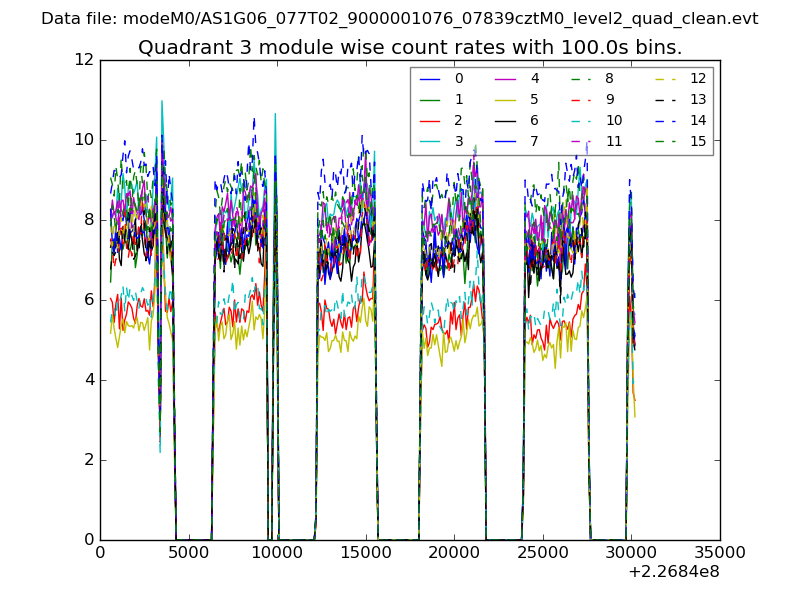
| Module-wise count rates for Quadrant C Data is divided into 100 sec bins |
 |
 |
| Module-wise count rates for Quadrant D Data is divided into 100 sec bins |
 |
 |
| Parameter | Plot |
|---|---|
| CZT HV Monitor |  |
| D_VDD | 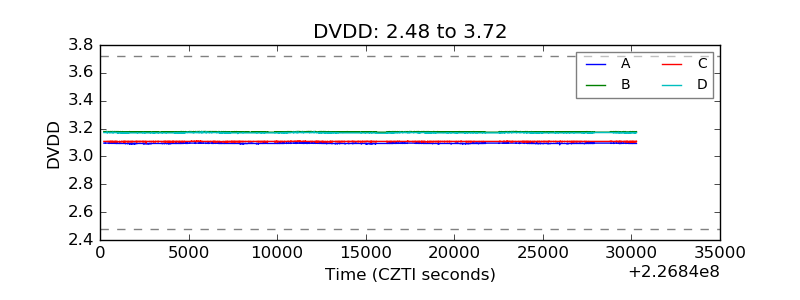 |
| Temperature 1 | 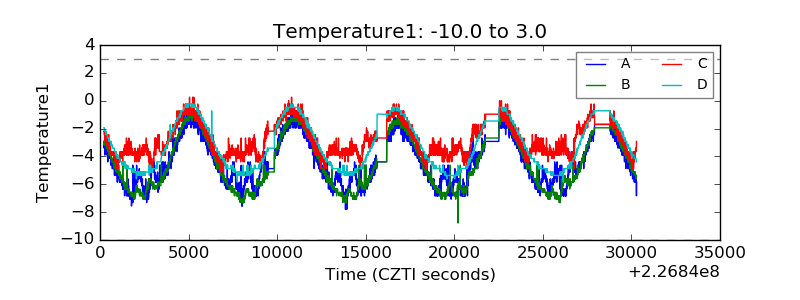 |
| Veto HV Monitor | 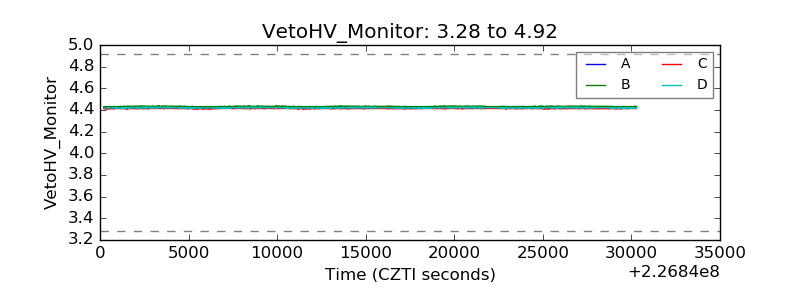 |
| Veto LLD | 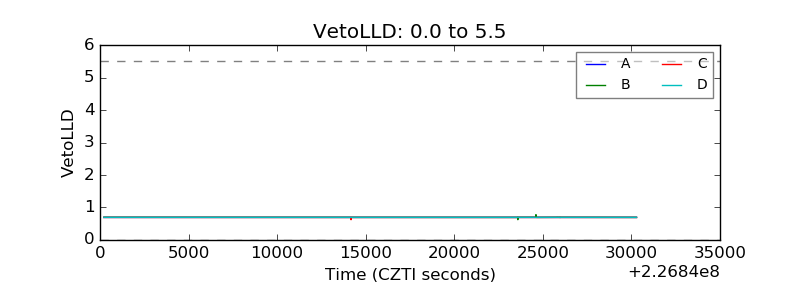 |
| Alpha Counter | 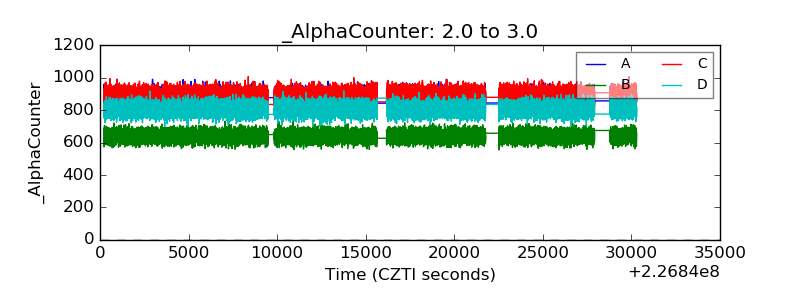 |
| _CPM_Rate | 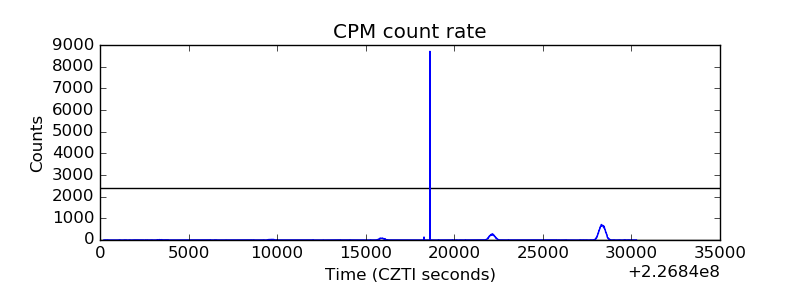 |
| CZT Counter | 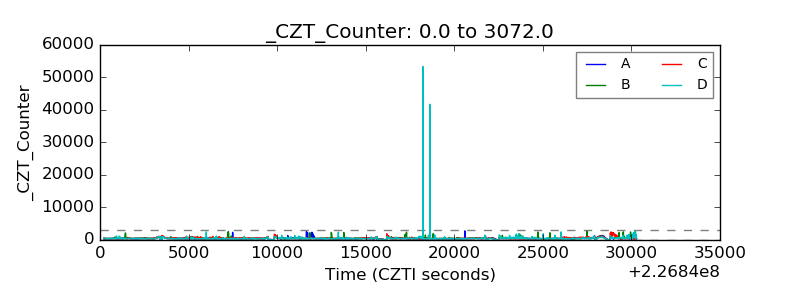 |
| +2.5 Volts monitor |  |
| +5 Volts monitor |  |
| _ROLL_ROT | 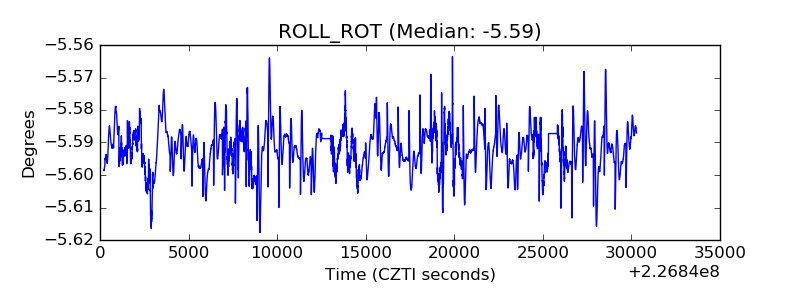 |
| _Roll_DEC | 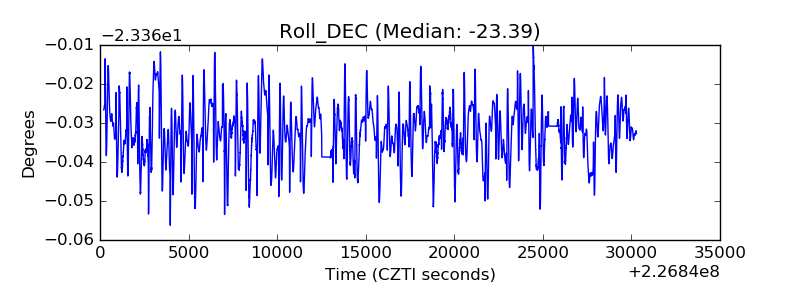 |
| _Roll_RA | 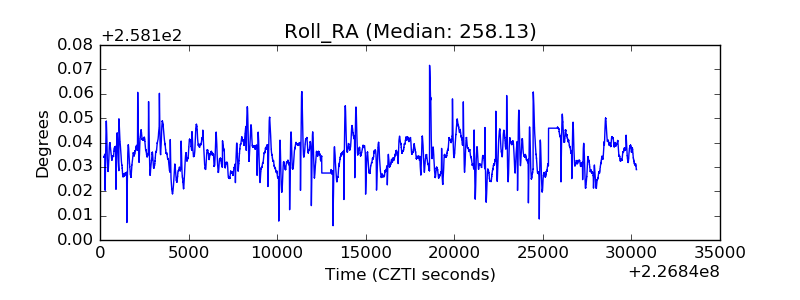 |
| Veto Counter | 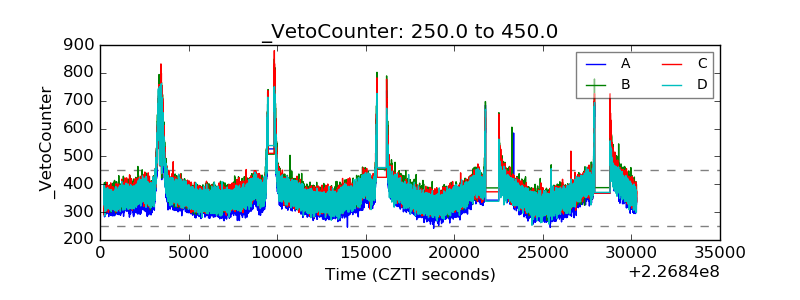 |