| Param | Original file | Final file |
|---|---|---|
| Filename | modeM0/AS1G06_077T02_9000001076_07840cztM0_level2.evt | modeM0/AS1G06_077T02_9000001076_07840cztM0_level2_quad_clean.evt |
| Size (bytes) | 534,968,640 | 87,013,440 |
| Size | 510.2 MB | 83.0 MB |
| Events in quadrant A | 3,124,599 | 549,066 |
| Events in quadrant B | 3,572,570 | 558,712 |
| Events in quadrant C | 4,692,524 | 548,841 |
| Events in quadrant D | 4,358,151 | 512,310 |
| Mode M9 | |||
|---|---|---|---|
| Quadrant | BADHDUFLAG | Total packets | Discarded packets |
| A | 0 | 16 | 0 |
| B | 0 | 16 | 0 |
| C | 0 | 16 | 0 |
| D | 0 | 17 | 0 |
| Mode M0 | |||
|---|---|---|---|
| Quadrant | BADHDUFLAG | Total packets | Discarded packets |
| A | 0 | 13759 | 3 |
| B | 0 | 15023 | 2 |
| C | 0 | 18357 | 2 |
| D | 0 | 17485 | 2 |
| Mode SS | |||
|---|---|---|---|
| Quadrant | BADHDUFLAG | Total packets | Discarded packets |
| A | 0 | 136 | 0 |
| B | 0 | 136 | 0 |
| C | 0 | 136 | 0 |
| D | 0 | 136 | 0 |
| Quadrant | Total seconds | Saturated seconds | Saturation percentage |
|---|---|---|---|
| A | 6683 | 49 | 0.733204% |
| B | 6683 | 175 | 2.618584% |
| C | 6683 | 492 | 7.361963% |
| D | 6683 | 325 | 4.863085% |
Noise dominated data is calculated using 1-second bins in cleaned event files. If a bin has >2000 counts, and if more than 50% of those come from <1% of pixels, then it is considered to be noise-dominated and hence unusable.
| Quadrant | # 1 sec bins | Bins with >0 counts | Bins with >2000 counts | High rate bins dominated by noise | Noise dominated (total time) | Noise dominated (detector-on time) | Marked lightcurve |
|---|---|---|---|---|---|---|---|
| A | 7688 | 6683 | 0 | 0 | 0.00% | 0.00% | 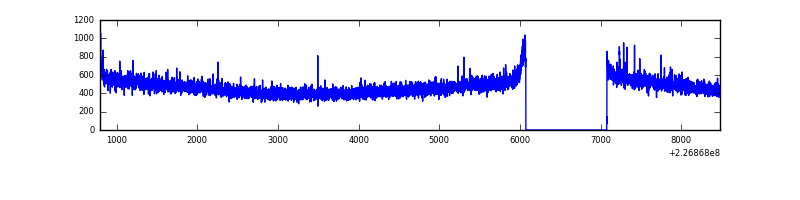 |
| B | 7688 | 6684 | 63 | 63 | 0.82% | 0.94% | 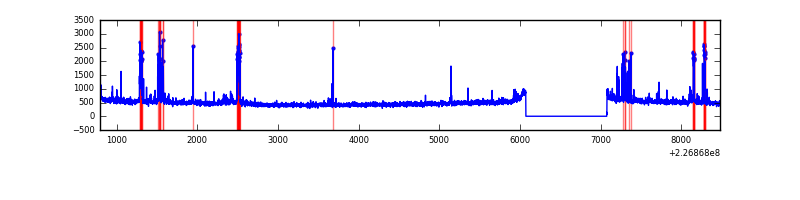 |
| C | 7688 | 6684 | 362 | 362 | 4.71% | 5.42% | 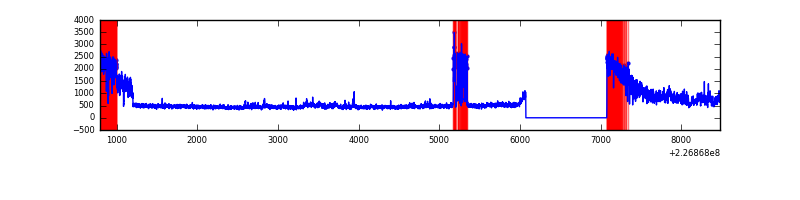 |
| D | 7688 | 6684 | 288 | 288 | 3.75% | 4.31% | 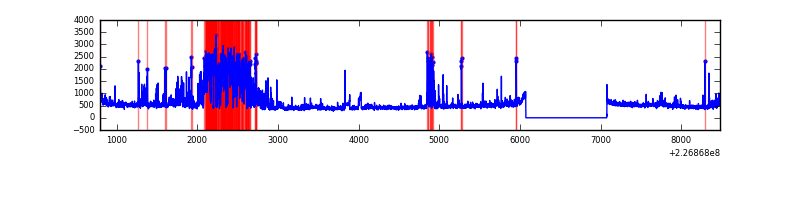 |
Top three noisy pixels from each quadrant. If the there are fewer than three noisy pixels in the level2.evt file, extra rows are filled as -1
| Pixel properties | Quadrant properties | ||||||
|---|---|---|---|---|---|---|---|
| Quadrant | DetID | PixID | Counts | Sigma | Mean | Median | Sigma |
| A | 8 | 15 | 27796 | 166.1 | 803 | 788 | 162.6 |
| A | 0 | 226 | 7833 | 43.33 | 803 | 788 | 162.6 |
| A | 12 | 194 | 7010 | 38.27 | 803 | 788 | 162.6 |
| B | 4 | 239 | 282818 | 1826.85 | 810 | 791 | 154.4 |
| B | 4 | 81 | 43131 | 274.26 | 810 | 791 | 154.4 |
| B | 0 | 219 | 39566 | 251.17 | 810 | 791 | 154.4 |
| C | 1 | 16 | 1450454 | 8198.77 | 767 | 770 | 176.8 |
| C | 9 | 54 | 210386 | 1185.49 | 767 | 770 | 176.8 |
| C | 8 | 229 | 34317 | 189.73 | 767 | 770 | 176.8 |
| D | 2 | 152 | 1062509 | 5600.17 | 771 | 747 | 189.6 |
| D | 12 | 233 | 115141 | 603.36 | 771 | 747 | 189.6 |
| D | 2 | 14 | 74749 | 390.32 | 771 | 747 | 189.6 |
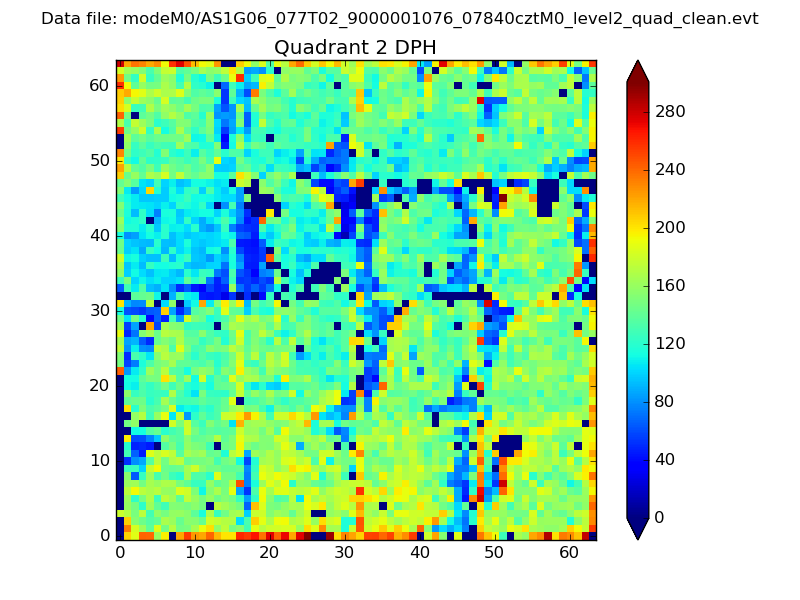
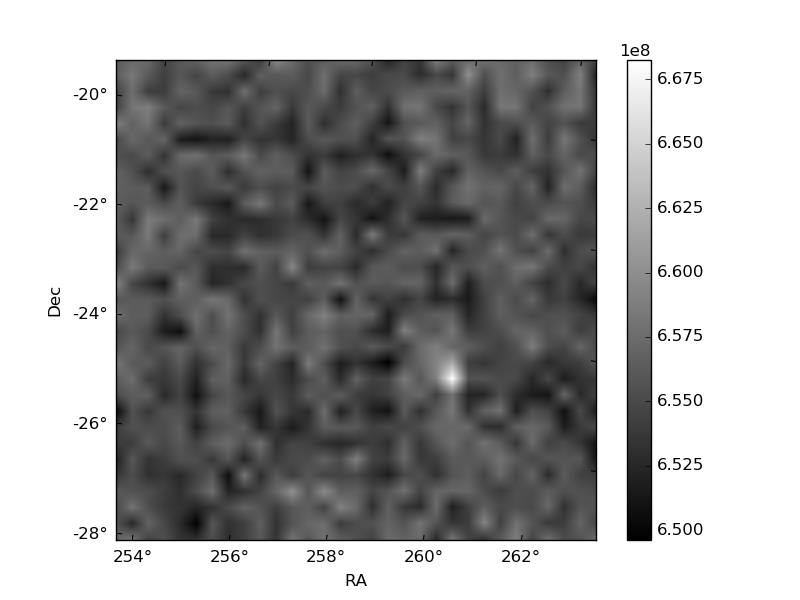
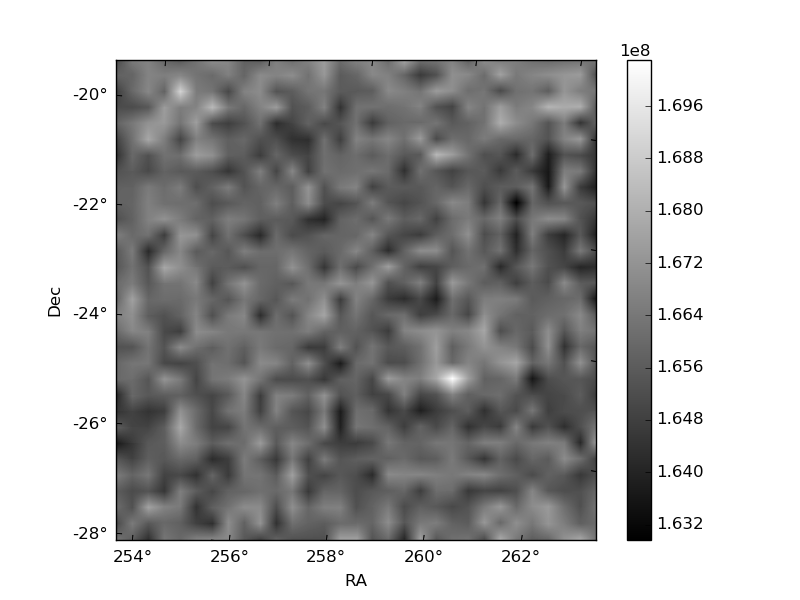
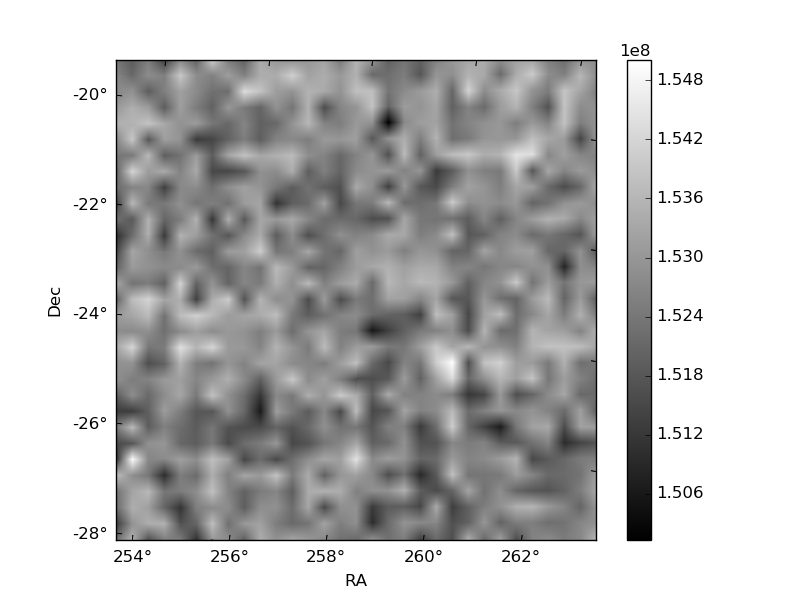
Histogram calculated using DETX and DETY for each event in the final _common_clean file
| Quadrant A | 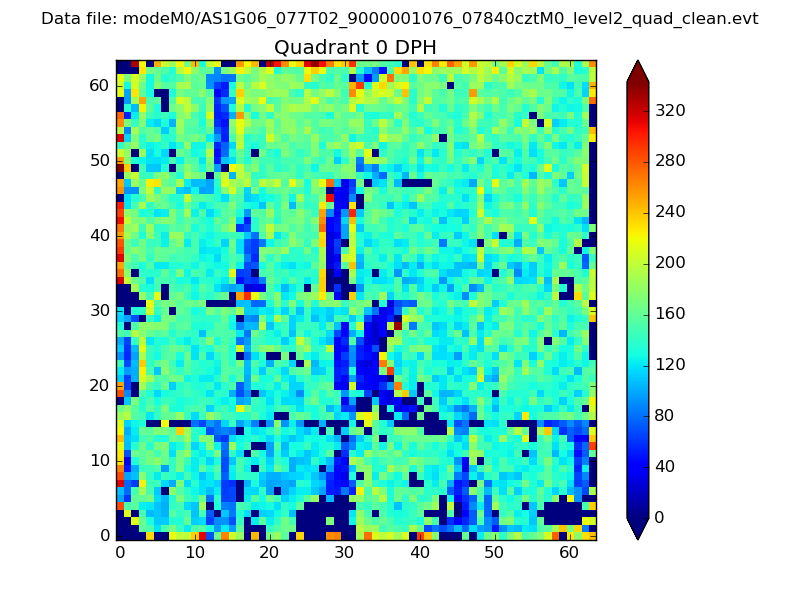 |
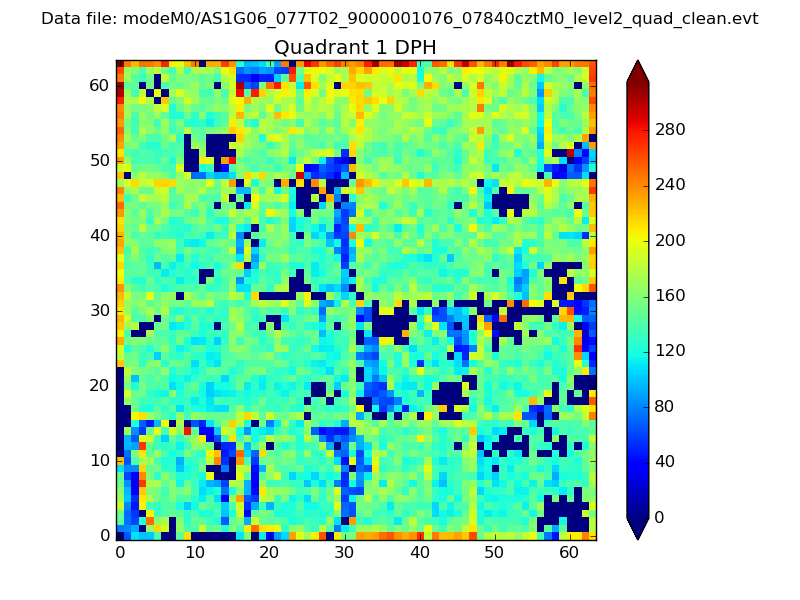 |
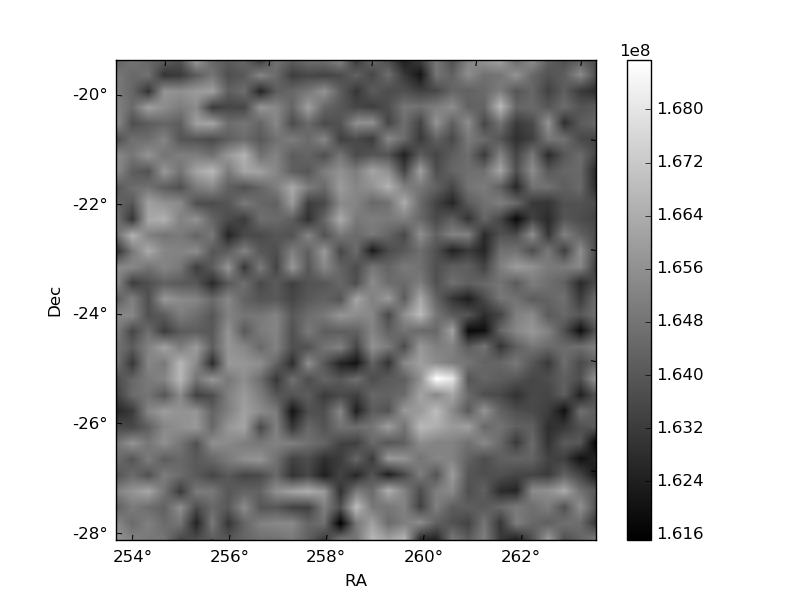
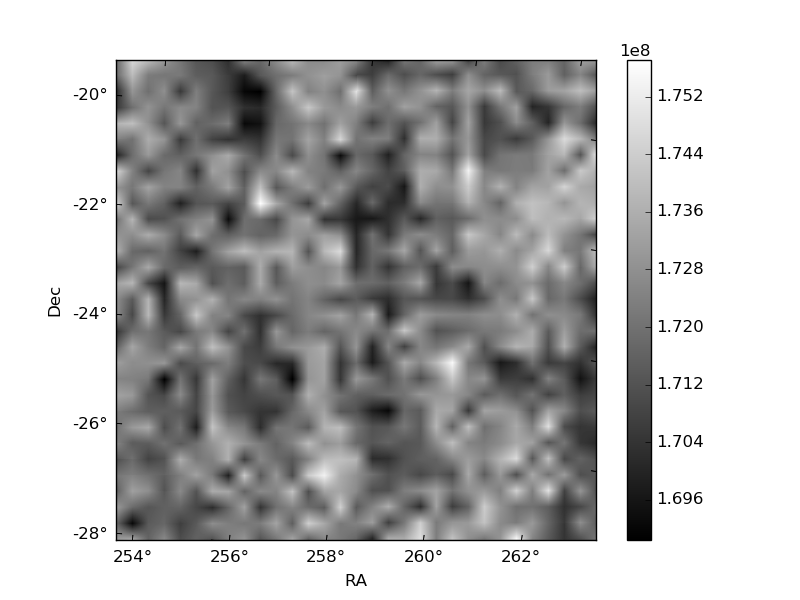
Quadrant B |
|---|---|---|---|
| Quadrant D | 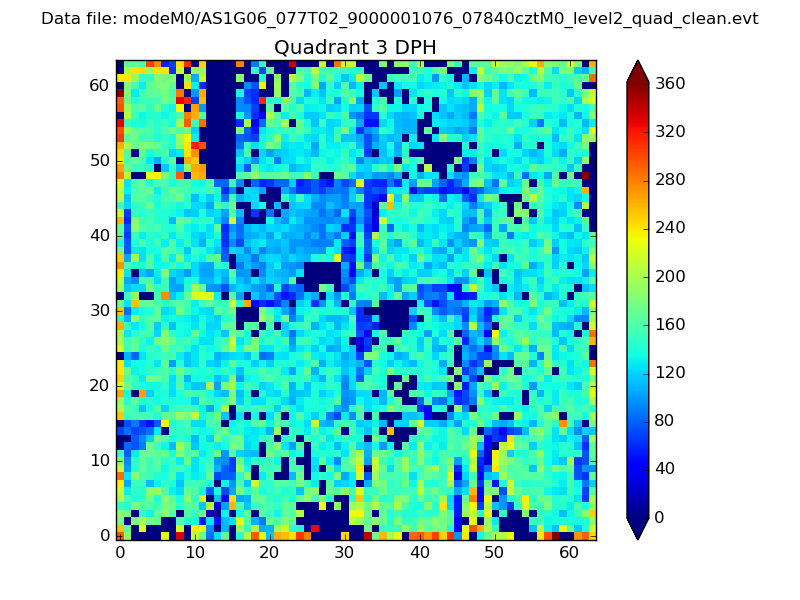 |
 |
Quadrant C |
| Plot type | Count rate plots | Images |
|---|---|---|
| Comparison with Poisson distribution Blue bars denote a histogram of data divided into 1 sec bins. Red curve is a Poisson curve with rate = median count rate of data. |
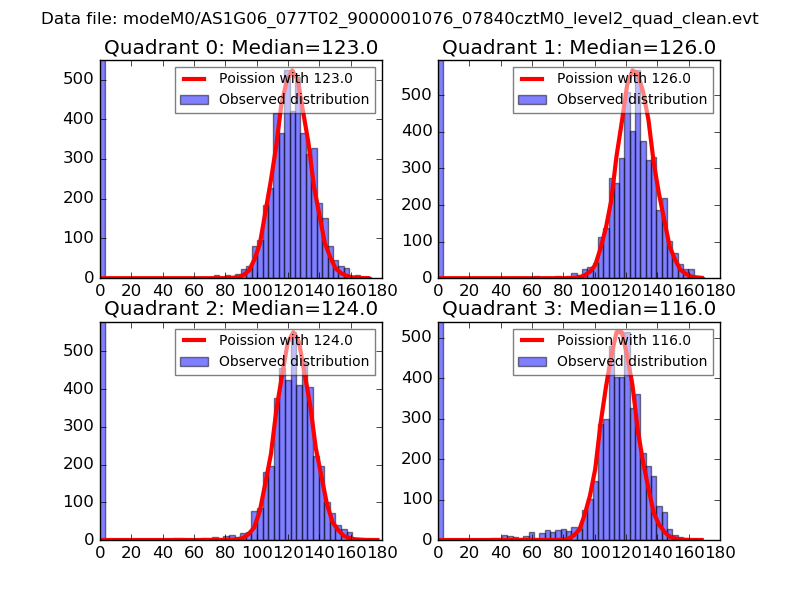 |
 |
| Quadrant-wise count rates Data is divided into 100 sec bins |
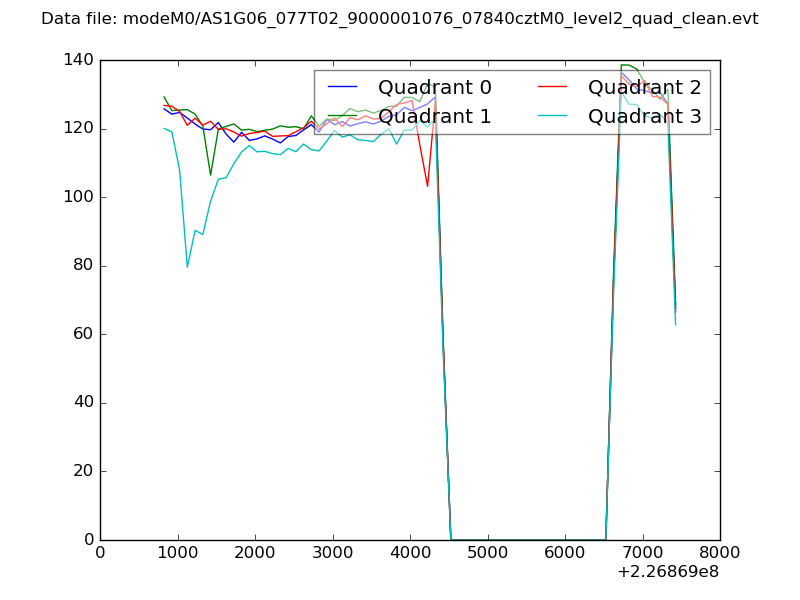 |
|
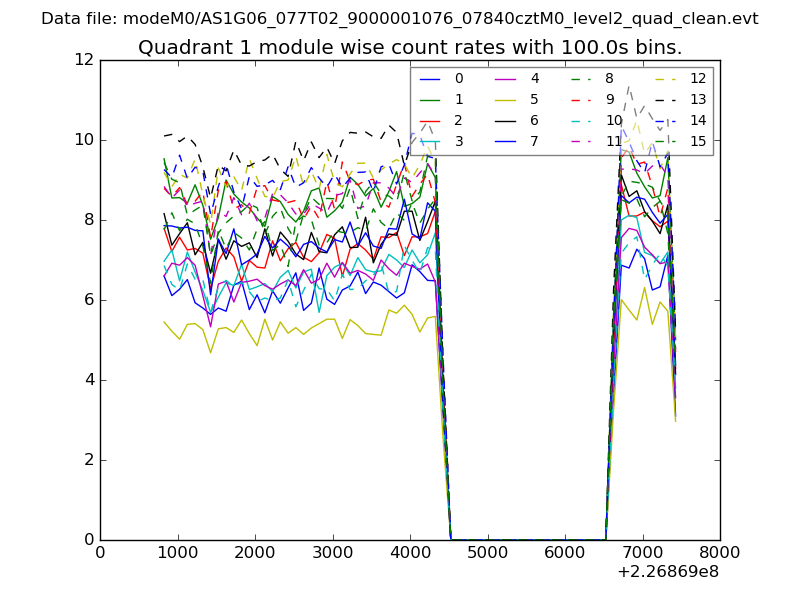
| Module-wise count rates for Quadrant A Data is divided into 100 sec bins |
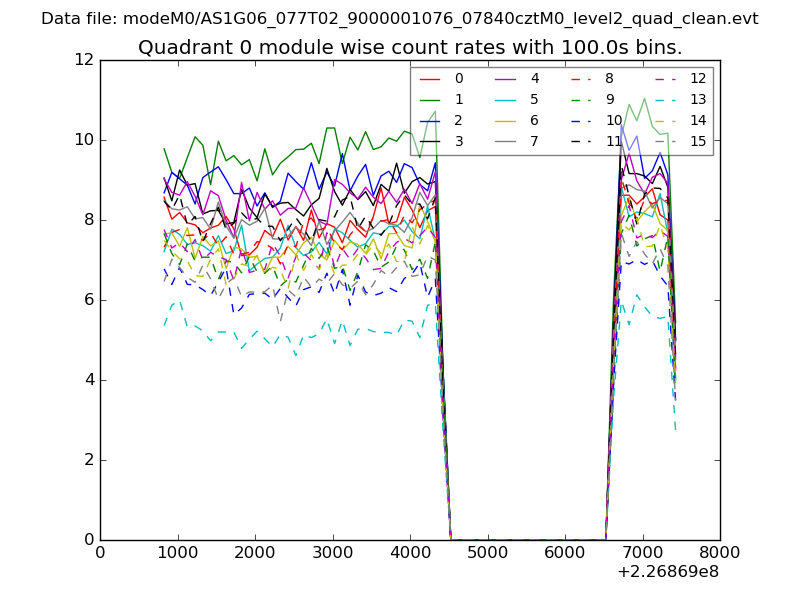 |
 |
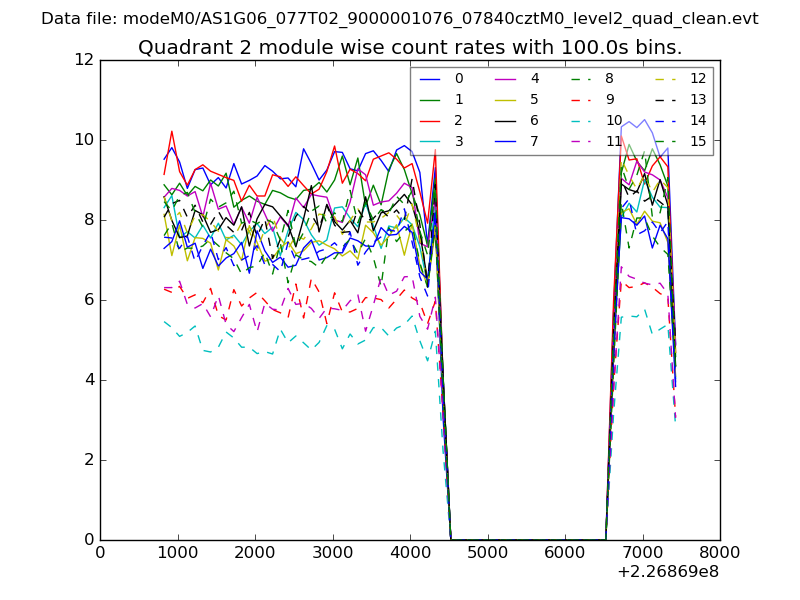
| Module-wise count rates for Quadrant B Data is divided into 100 sec bins |
 |
 |
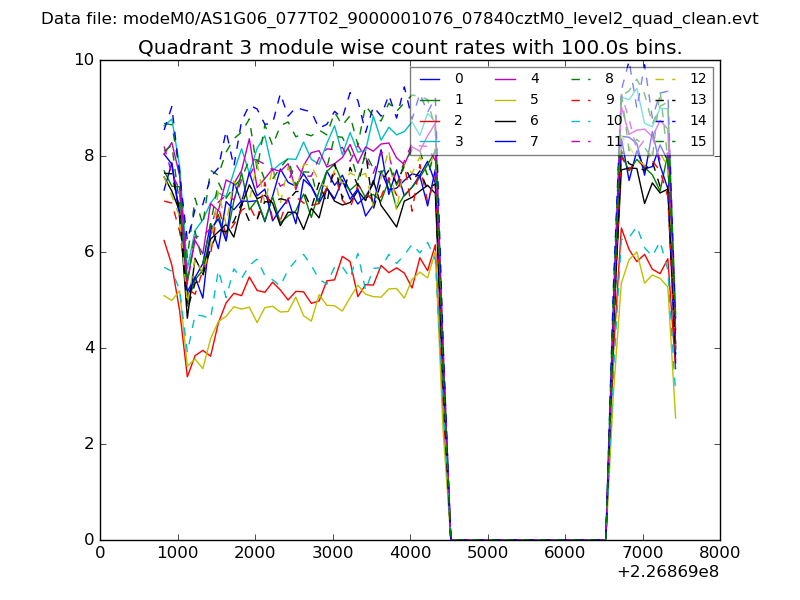
| Module-wise count rates for Quadrant C Data is divided into 100 sec bins |
 |
 |
| Module-wise count rates for Quadrant D Data is divided into 100 sec bins |
 |
 |
| Parameter | Plot |
|---|---|
| CZT HV Monitor | 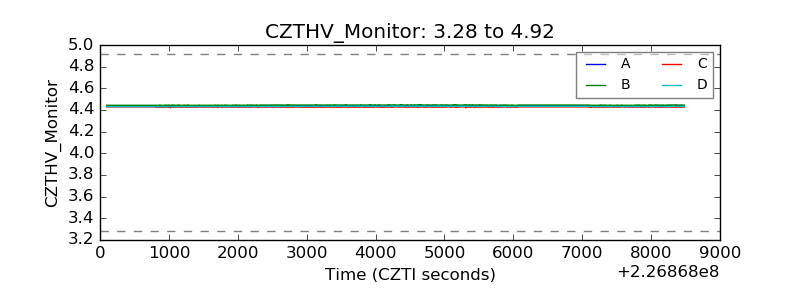 |
| D_VDD | 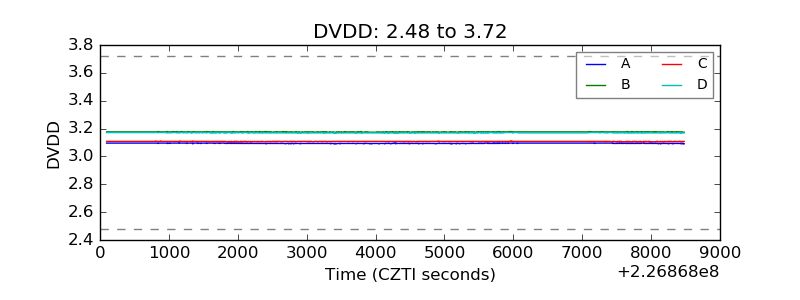 |
| Temperature 1 |  |
| Veto HV Monitor | 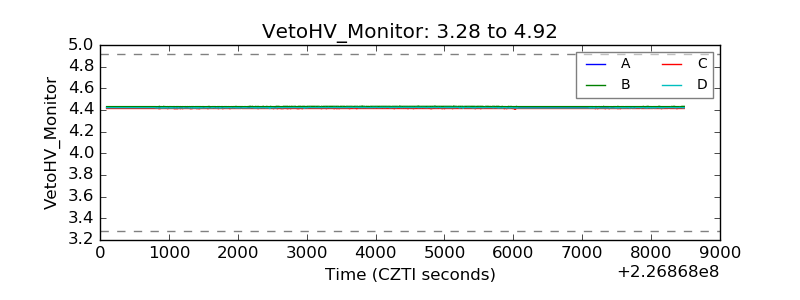 |
| Veto LLD | 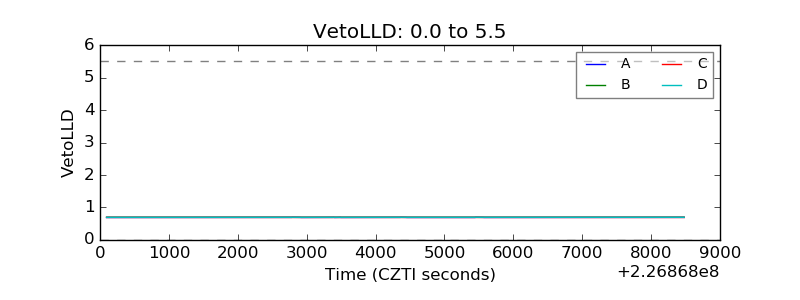 |
| Alpha Counter | 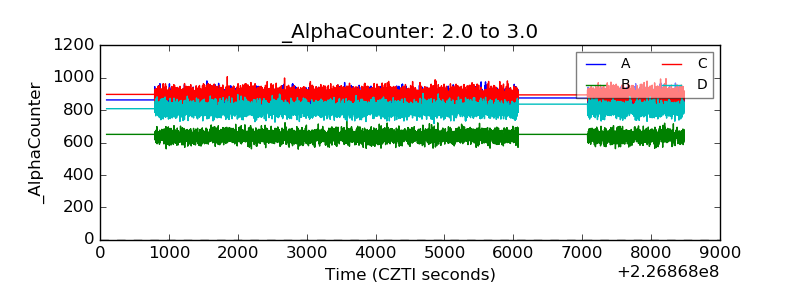 |
| _CPM_Rate | 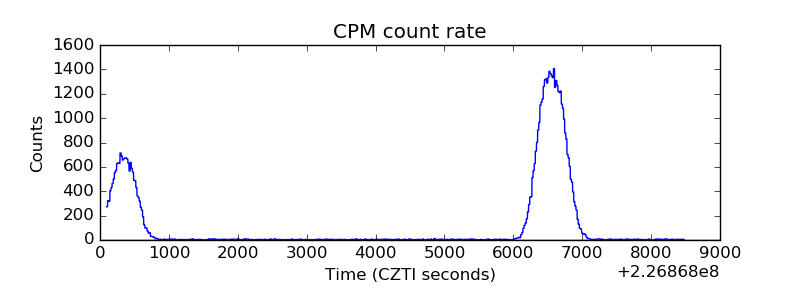 |
| CZT Counter | 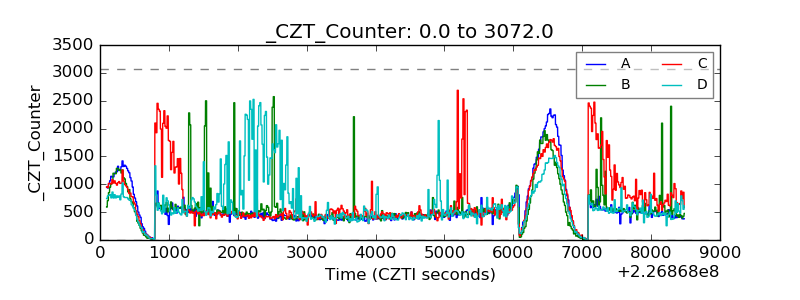 |
| +2.5 Volts monitor |  |
| +5 Volts monitor |  |
| _ROLL_ROT | 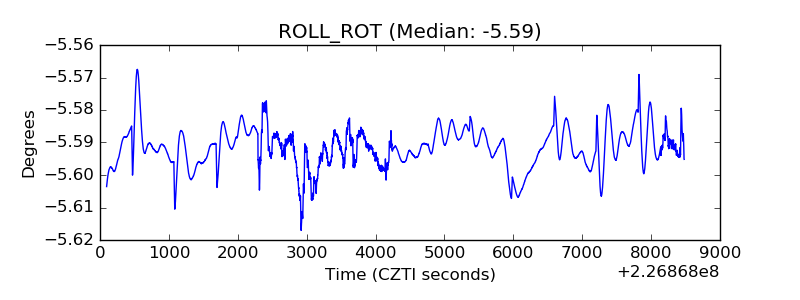 |
| _Roll_DEC | 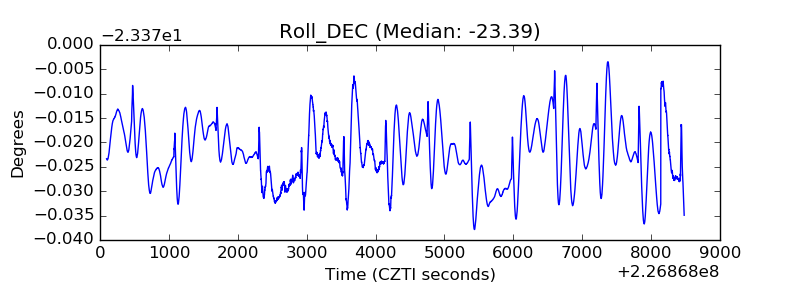 |
| _Roll_RA | 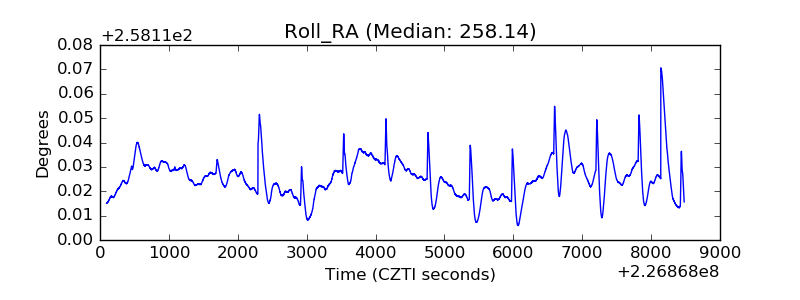 |
| Veto Counter | 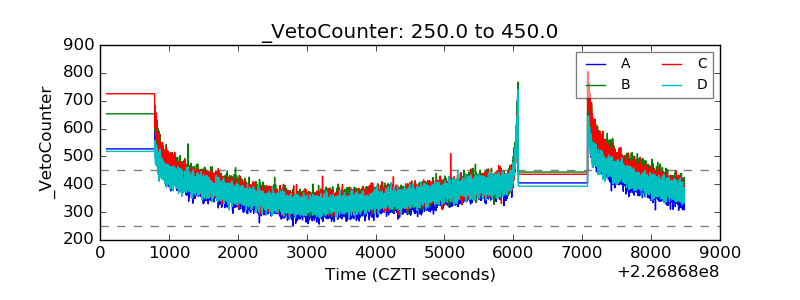 |