| Param | Original file | Final file |
|---|---|---|
| Filename | modeM0/AS1G06_077T02_9000001076_07842cztM0_level2.evt | modeM0/AS1G06_077T02_9000001076_07842cztM0_level2_quad_clean.evt |
| Size (bytes) | 518,152,320 | 98,161,920 |
| Size | 494.1 MB | 93.6 MB |
| Events in quadrant A | 3,265,743 | 625,113 |
| Events in quadrant B | 3,644,771 | 642,674 |
| Events in quadrant C | 4,896,519 | 632,175 |
| Events in quadrant D | 3,424,991 | 600,042 |
| Mode M9 | |||
|---|---|---|---|
| Quadrant | BADHDUFLAG | Total packets | Discarded packets |
| A | 0 | 21 | 0 |
| B | 0 | 21 | 0 |
| C | 0 | 21 | 0 |
| D | 0 | 21 | 0 |
| Mode M0 | |||
|---|---|---|---|
| Quadrant | BADHDUFLAG | Total packets | Discarded packets |
| A | 0 | 14222 | 3 |
| B | 0 | 15320 | 2 |
| C | 0 | 19231 | 2 |
| D | 0 | 14879 | 2 |
| Mode SS | |||
|---|---|---|---|
| Quadrant | BADHDUFLAG | Total packets | Discarded packets |
| A | 0 | 142 | 0 |
| B | 0 | 142 | 0 |
| C | 0 | 142 | 0 |
| D | 0 | 142 | 0 |
| Quadrant | Total seconds | Saturated seconds | Saturation percentage |
|---|---|---|---|
| A | 6777 | 63 | 0.929615% |
| B | 6777 | 145 | 2.139590% |
| C | 6777 | 283 | 4.175889% |
| D | 6777 | 67 | 0.988638% |
Noise dominated data is calculated using 1-second bins in cleaned event files. If a bin has >2000 counts, and if more than 50% of those come from <1% of pixels, then it is considered to be noise-dominated and hence unusable.
| Quadrant | # 1 sec bins | Bins with >0 counts | Bins with >2000 counts | High rate bins dominated by noise | Noise dominated (total time) | Noise dominated (detector-on time) | Marked lightcurve |
|---|---|---|---|---|---|---|---|
| A | 8947 | 6779 | 2 | 2 | 0.02% | 0.03% | 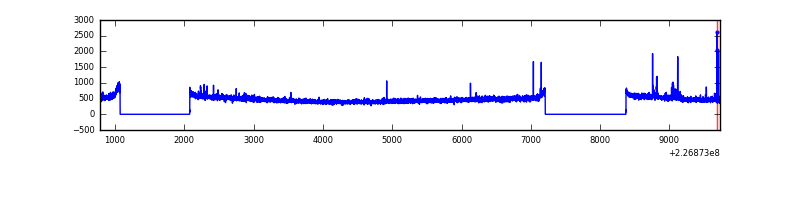 |
| B | 8947 | 6779 | 40 | 40 | 0.45% | 0.59% | 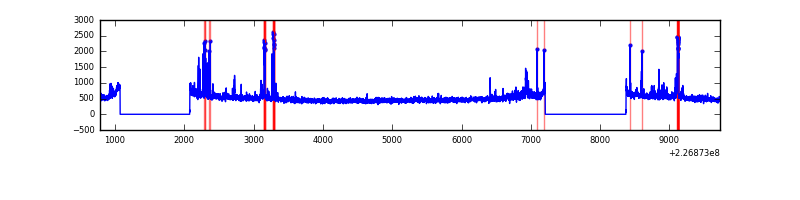 |
| C | 8947 | 6779 | 152 | 152 | 1.70% | 2.24% | 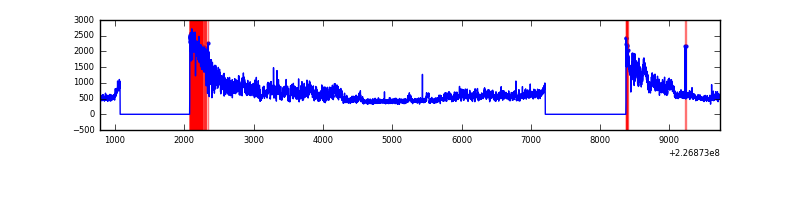 |
| D | 8947 | 6779 | 19 | 19 | 0.21% | 0.28% | 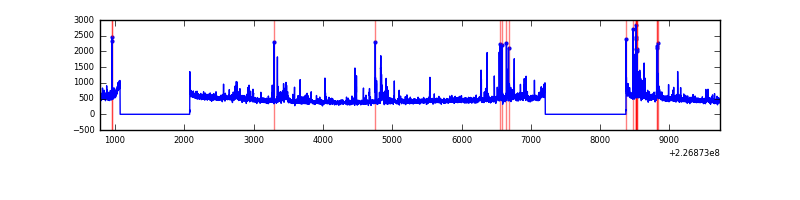 |
Top three noisy pixels from each quadrant. If the there are fewer than three noisy pixels in the level2.evt file, extra rows are filled as -1
| Pixel properties | Quadrant properties | ||||||
|---|---|---|---|---|---|---|---|
| Quadrant | DetID | PixID | Counts | Sigma | Mean | Median | Sigma |
| A | 15 | 234 | 50608 | 295.86 | 830 | 816 | 168.3 |
| A | 8 | 15 | 15455 | 86.98 | 830 | 816 | 168.3 |
| A | 0 | 226 | 7886 | 42.01 | 830 | 816 | 168.3 |
| B | 4 | 239 | 188056 | 1166.47 | 841 | 822 | 160.5 |
| B | 0 | 219 | 63789 | 392.28 | 841 | 822 | 160.5 |
| B | 4 | 173 | 36945 | 225.05 | 841 | 822 | 160.5 |
| C | 1 | 16 | 1724242 | 9246.18 | 806 | 811 | 186.4 |
| C | 8 | 229 | 12992 | 65.35 | 806 | 811 | 186.4 |
| C | 12 | 4 | 8415 | 40.8 | 806 | 811 | 186.4 |
| D | 2 | 152 | 87912 | 442.25 | 807 | 783 | 197.0 |
| D | 13 | 137 | 83612 | 420.42 | 807 | 783 | 197.0 |
| D | 2 | 136 | 56910 | 284.89 | 807 | 783 | 197.0 |
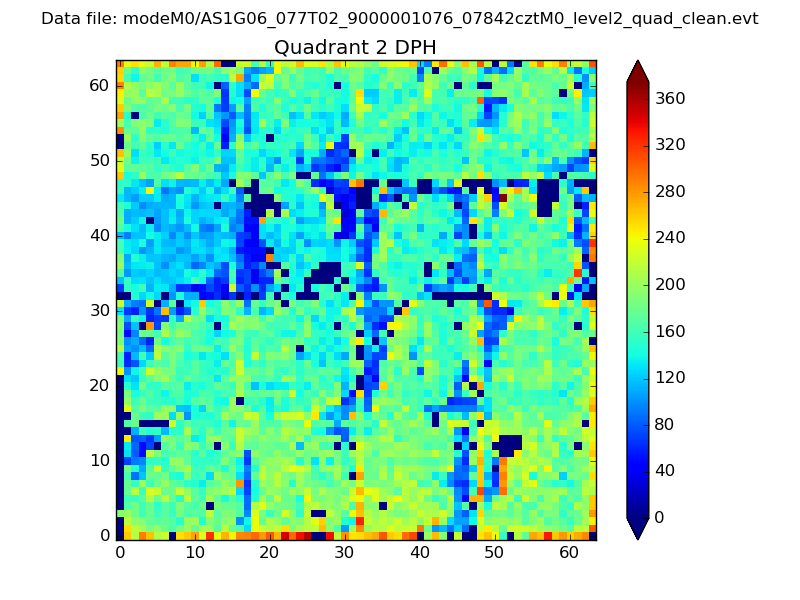
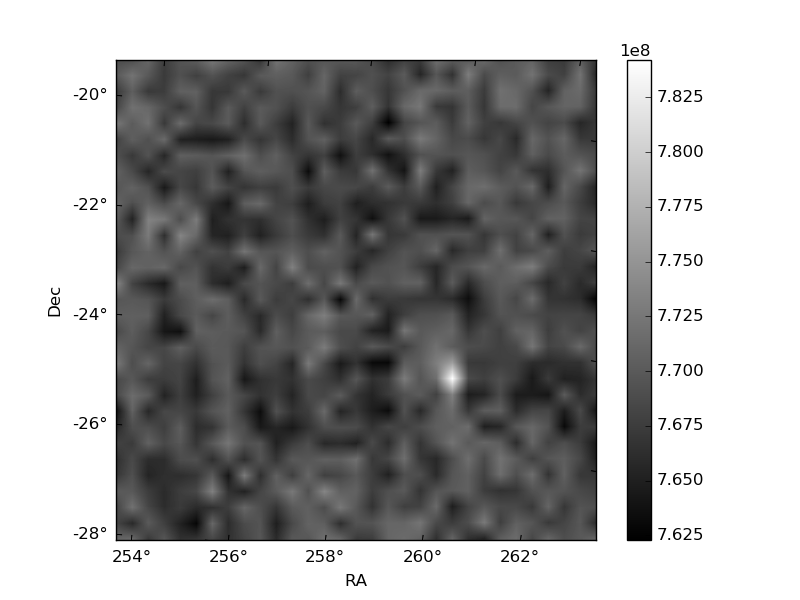
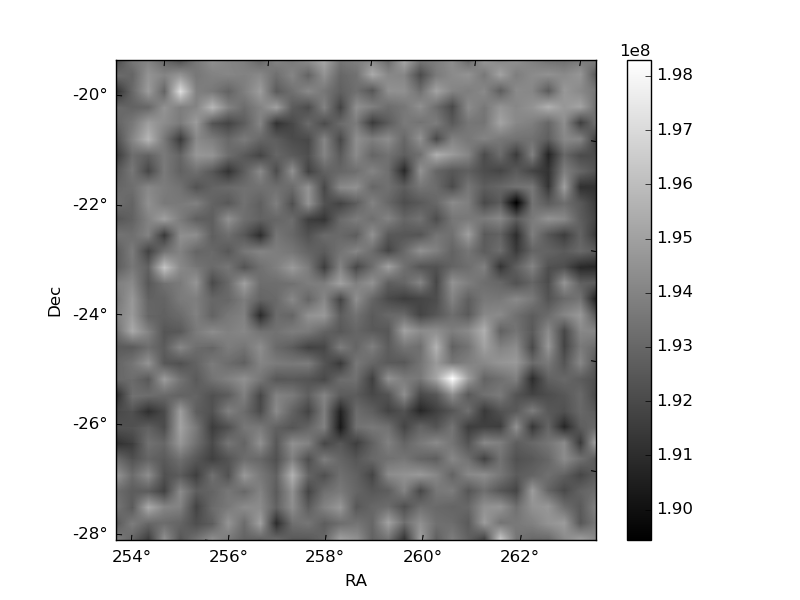
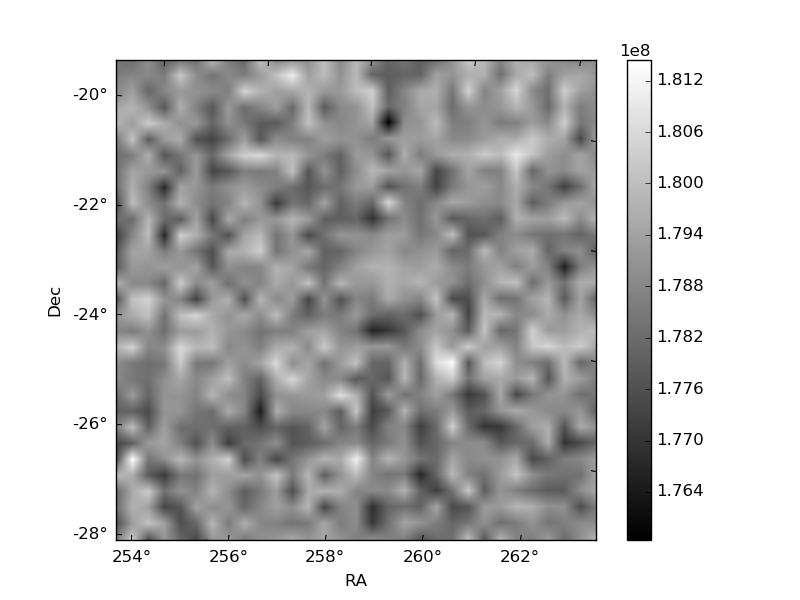
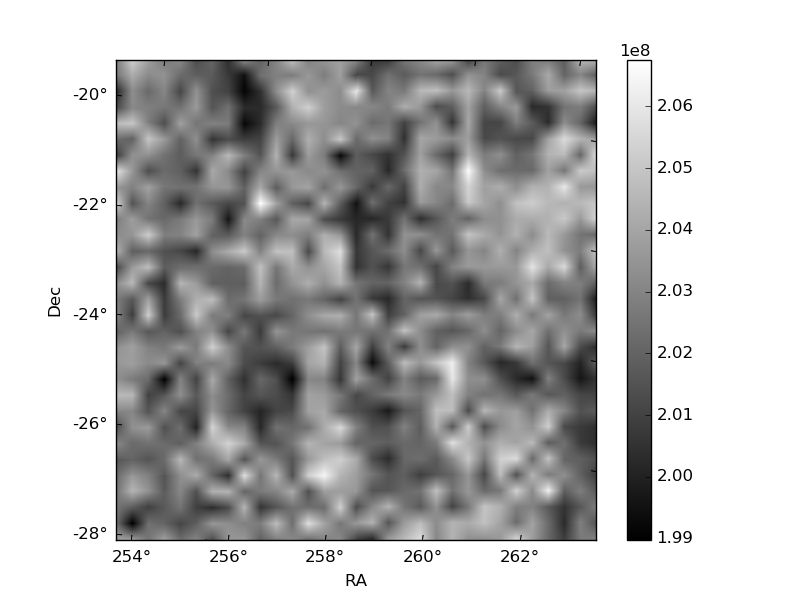
Histogram calculated using DETX and DETY for each event in the final _common_clean file
| Quadrant A | 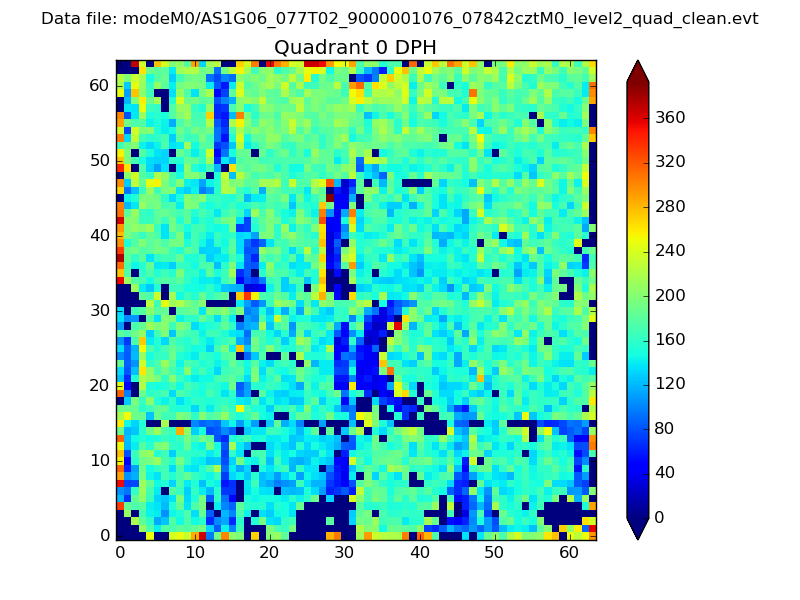 |
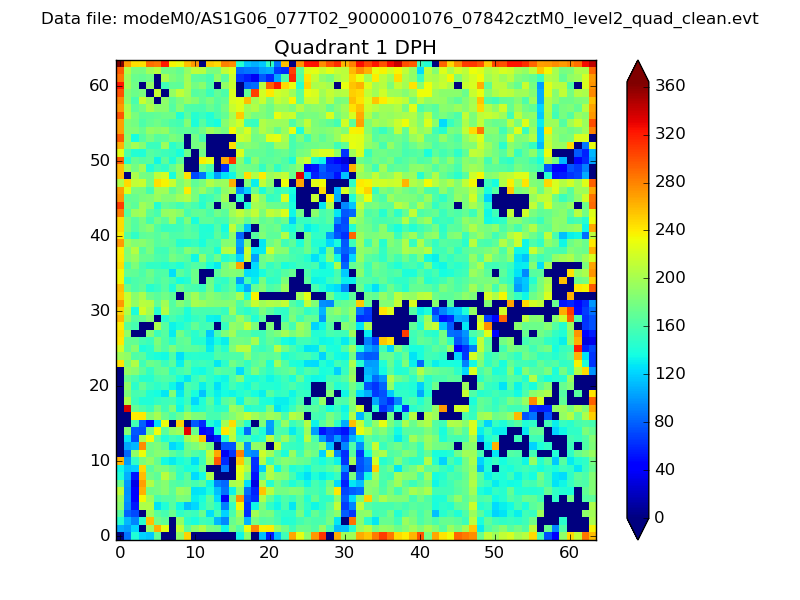 |
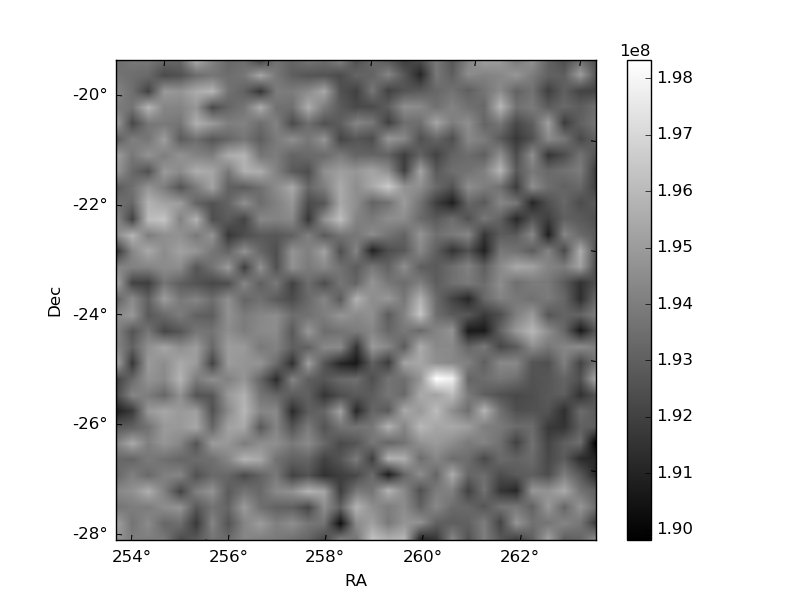
Quadrant B |
|---|---|---|---|
| Quadrant D | 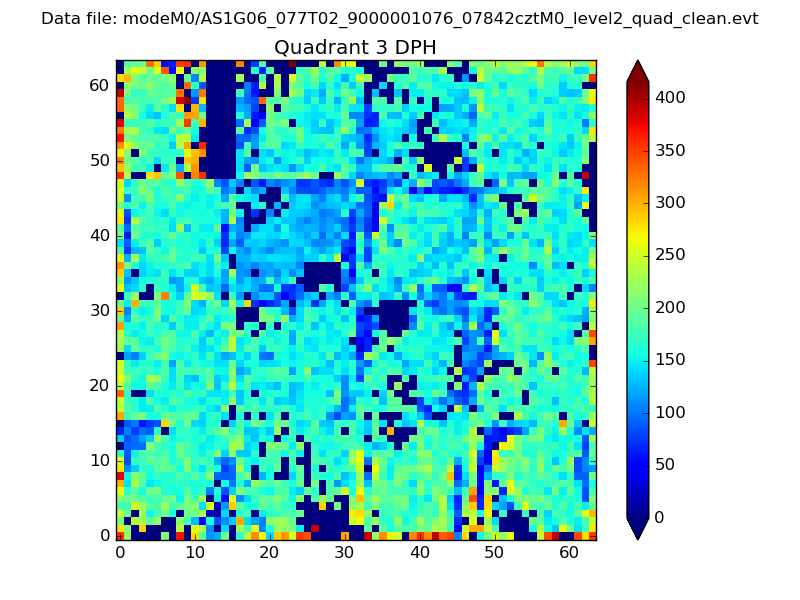 |
 |
Quadrant C |
| Plot type | Count rate plots | Images |
|---|---|---|
| Comparison with Poisson distribution Blue bars denote a histogram of data divided into 1 sec bins. Red curve is a Poisson curve with rate = median count rate of data. |
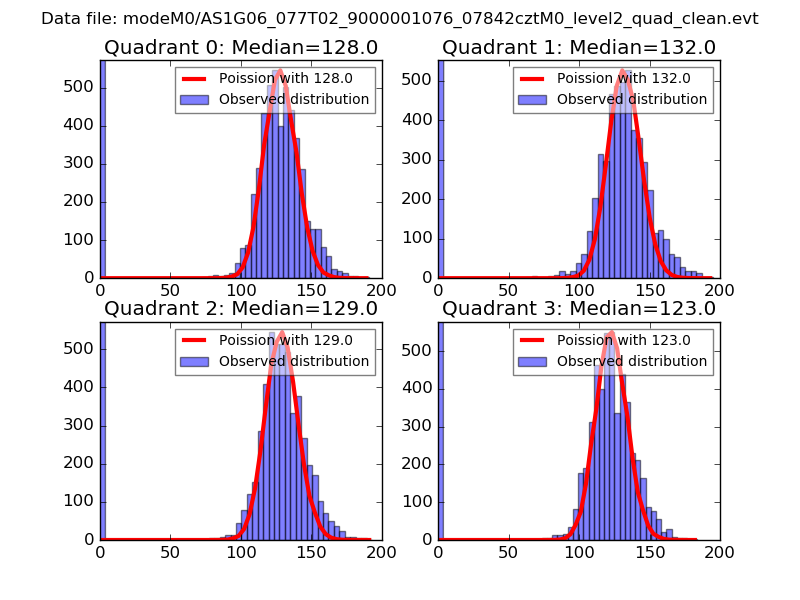 |
 |
| Quadrant-wise count rates Data is divided into 100 sec bins |
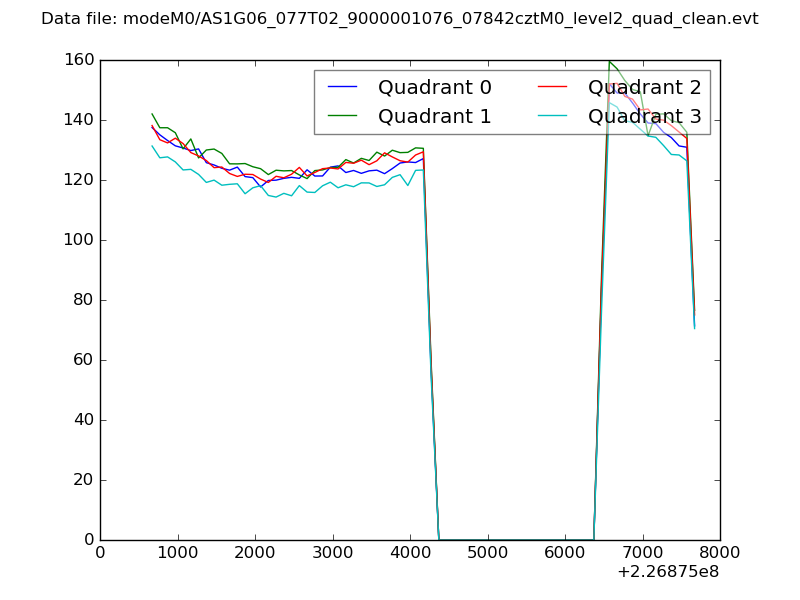 |
|
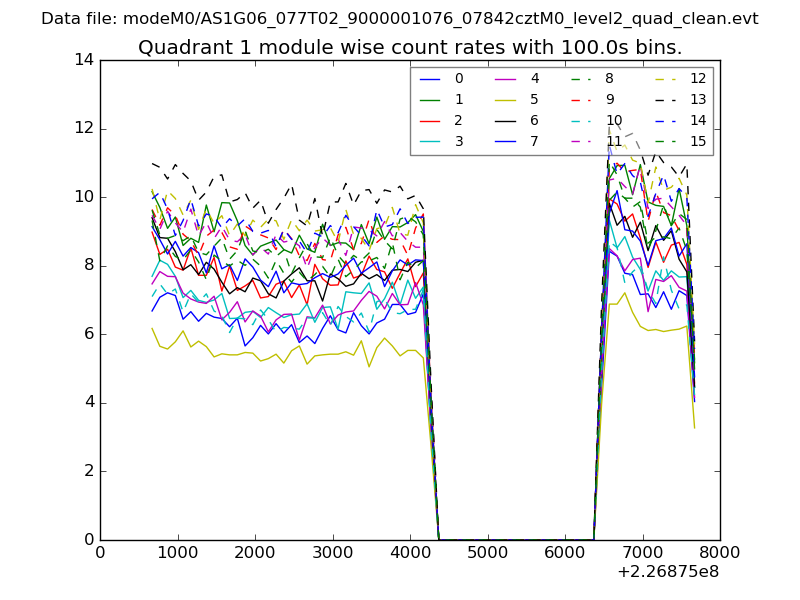
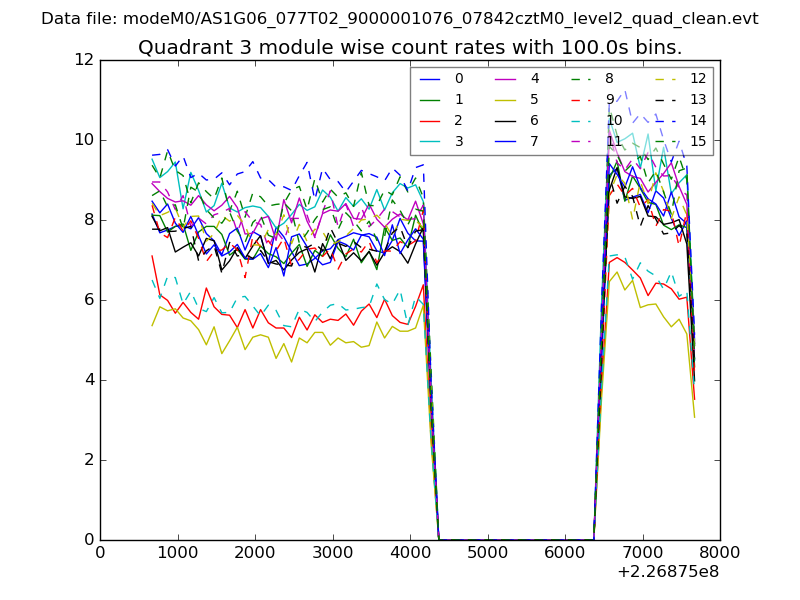
| Module-wise count rates for Quadrant A Data is divided into 100 sec bins |
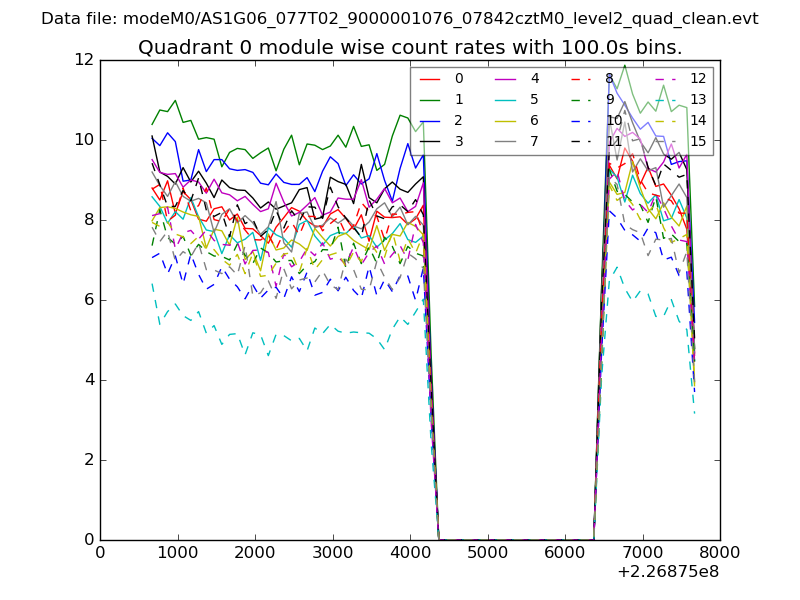 |
 |
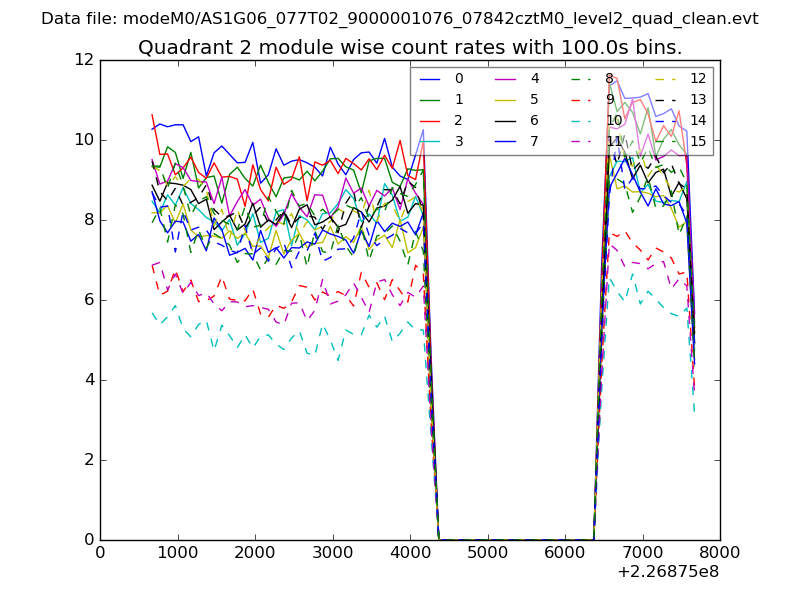
| Module-wise count rates for Quadrant B Data is divided into 100 sec bins |
 |
 |
| Module-wise count rates for Quadrant C Data is divided into 100 sec bins |
 |
 |
| Module-wise count rates for Quadrant D Data is divided into 100 sec bins |
 |
 |
| Parameter | Plot |
|---|---|
| CZT HV Monitor | 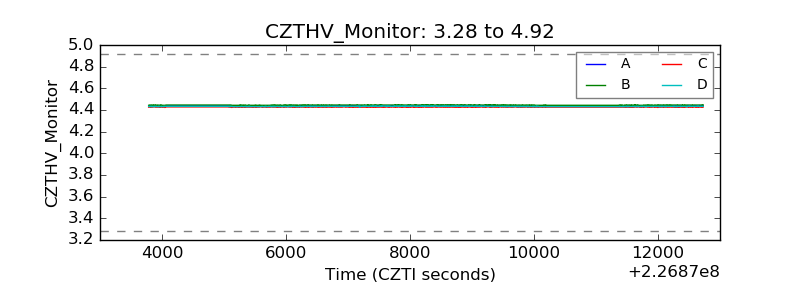 |
| D_VDD | 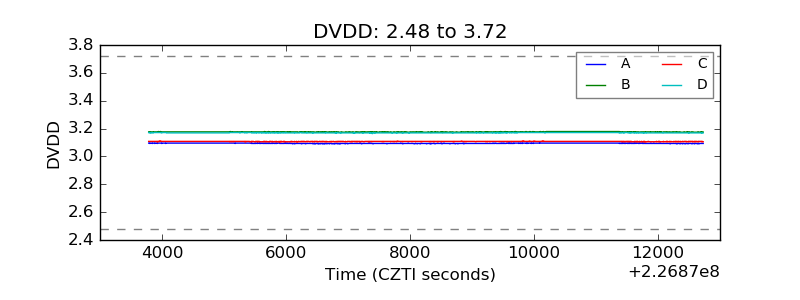 |
| Temperature 1 | 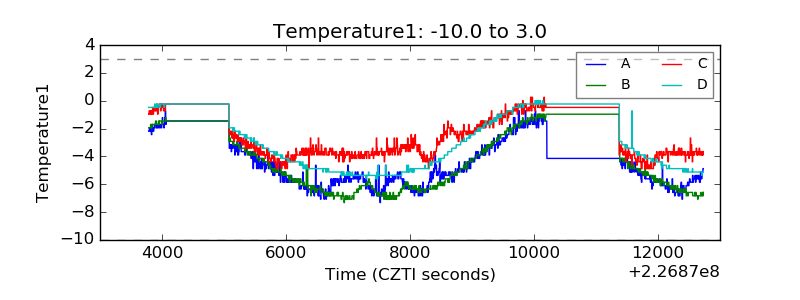 |
| Veto HV Monitor | 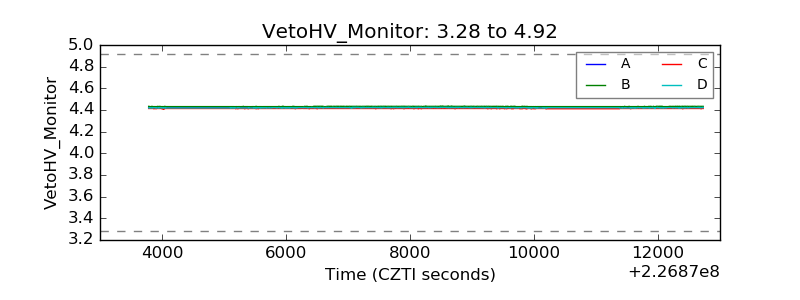 |
| Veto LLD | 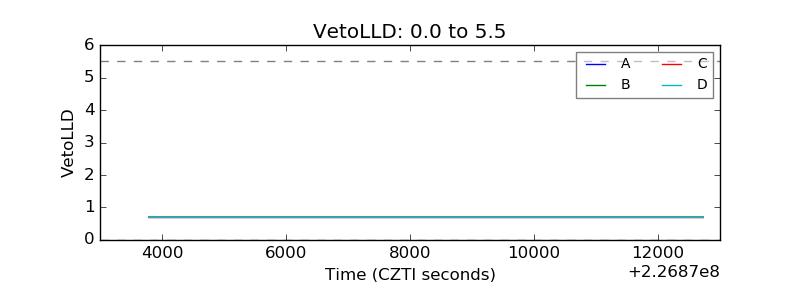 |
| Alpha Counter | 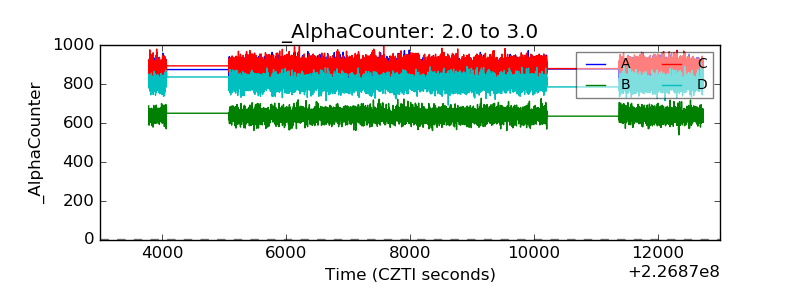 |
| _CPM_Rate | 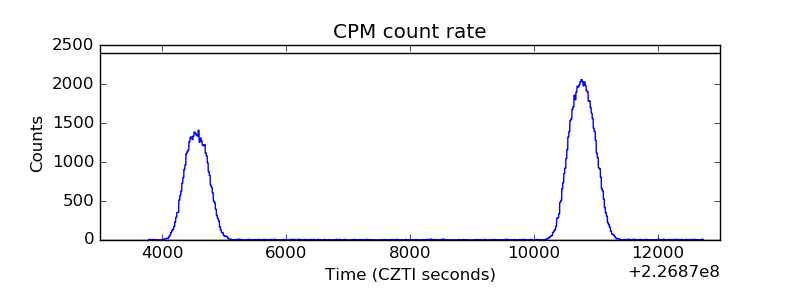 |
| CZT Counter | 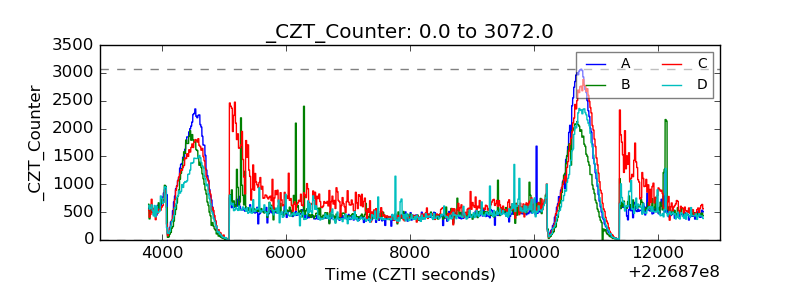 |
| +2.5 Volts monitor | 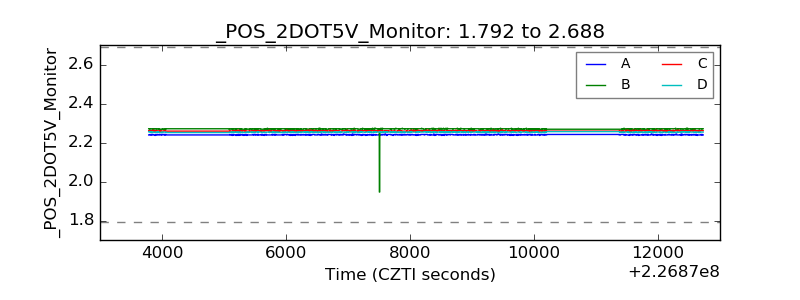 |
| +5 Volts monitor | 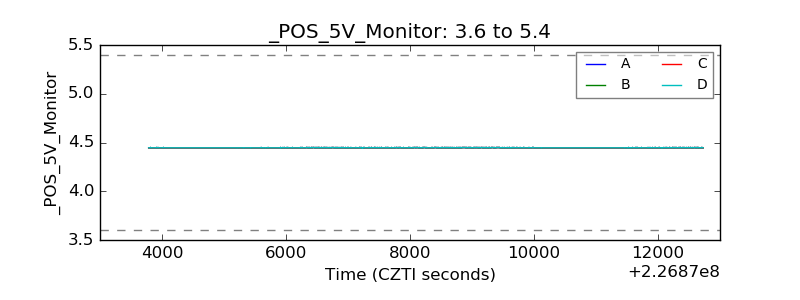 |
| _ROLL_ROT | 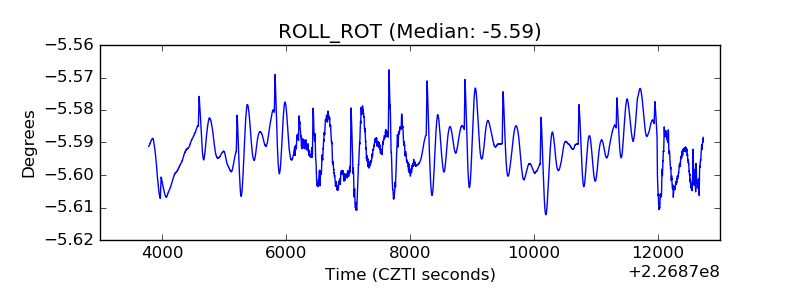 |
| _Roll_DEC | 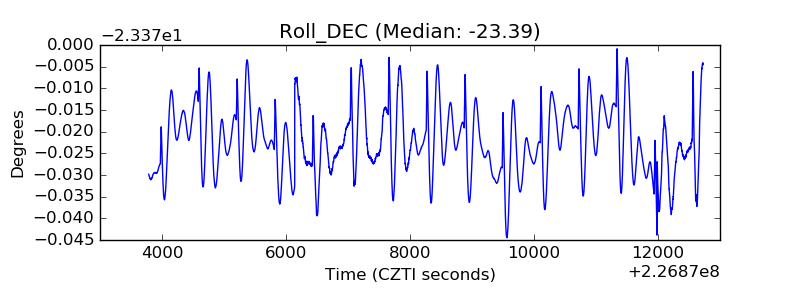 |
| _Roll_RA | 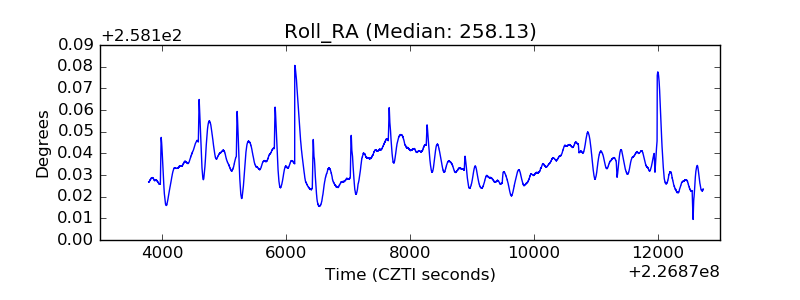 |
| Veto Counter | 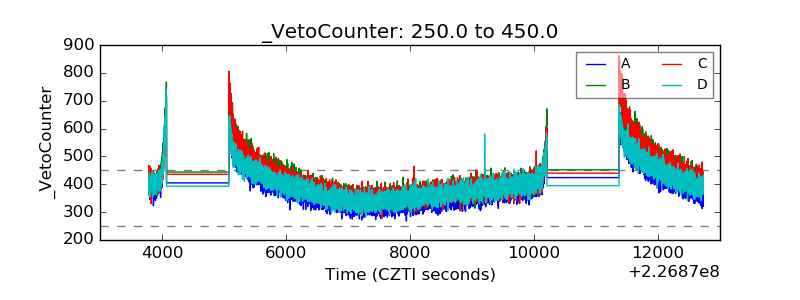 |