| Param | Original file | Final file |
|---|---|---|
| Filename | modeM0/AS1G06_077T02_9000001076_07844cztM0_level2.evt | modeM0/AS1G06_077T02_9000001076_07844cztM0_level2_quad_clean.evt |
| Size (bytes) | 460,624,320 | 99,437,760 |
| Size | 439.3 MB | 94.8 MB |
| Events in quadrant A | 2,971,261 | 641,586 |
| Events in quadrant B | 3,294,408 | 669,977 |
| Events in quadrant C | 4,171,582 | 649,831 |
| Events in quadrant D | 3,093,153 | 618,744 |
| Mode M9 | |||
|---|---|---|---|
| Quadrant | BADHDUFLAG | Total packets | Discarded packets |
| A | 0 | 18 | 0 |
| B | 0 | 18 | 0 |
| C | 0 | 18 | 0 |
| D | 0 | 19 | 0 |
| Mode M0 | |||
|---|---|---|---|
| Quadrant | BADHDUFLAG | Total packets | Discarded packets |
| A | 0 | 12850 | 3 |
| B | 0 | 13796 | 2 |
| C | 0 | 16451 | 2 |
| D | 0 | 13430 | 2 |
| Mode SS | |||
|---|---|---|---|
| Quadrant | BADHDUFLAG | Total packets | Discarded packets |
| A | 0 | 124 | 0 |
| B | 0 | 124 | 0 |
| C | 0 | 124 | 0 |
| D | 0 | 124 | 0 |
| Quadrant | Total seconds | Saturated seconds | Saturation percentage |
|---|---|---|---|
| A | 6186 | 22 | 0.355642% |
| B | 6186 | 80 | 1.293243% |
| C | 6186 | 147 | 2.376334% |
| D | 6186 | 36 | 0.581959% |
Noise dominated data is calculated using 1-second bins in cleaned event files. If a bin has >2000 counts, and if more than 50% of those come from <1% of pixels, then it is considered to be noise-dominated and hence unusable.
| Quadrant | # 1 sec bins | Bins with >0 counts | Bins with >2000 counts | High rate bins dominated by noise | Noise dominated (total time) | Noise dominated (detector-on time) | Marked lightcurve |
|---|---|---|---|---|---|---|---|
| A | 7476 | 6187 | 0 | 0 | 0.00% | 0.00% | 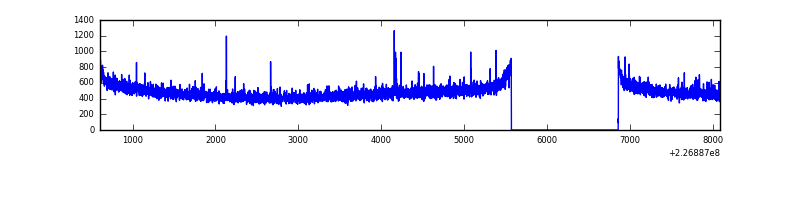 |
| B | 7476 | 6187 | 19 | 19 | 0.25% | 0.31% | 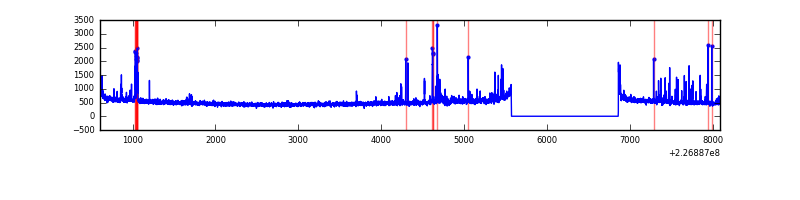 |
| C | 7476 | 6187 | 71 | 71 | 0.95% | 1.15% | 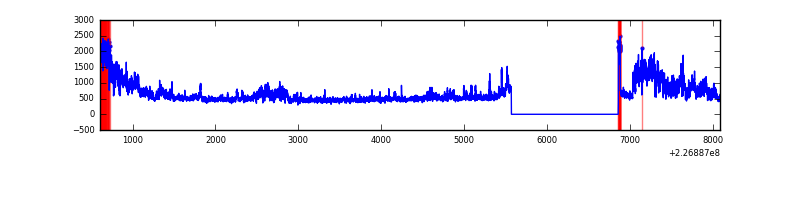 |
| D | 7476 | 6187 | 20 | 20 | 0.27% | 0.32% | 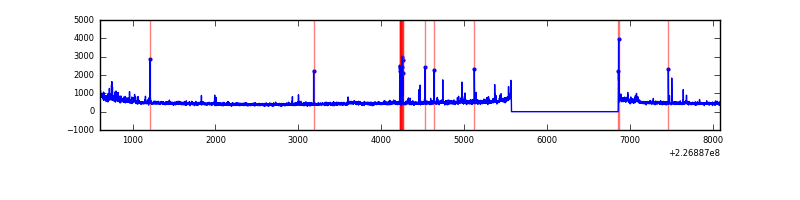 |
Top three noisy pixels from each quadrant. If the there are fewer than three noisy pixels in the level2.evt file, extra rows are filled as -1
| Pixel properties | Quadrant properties | ||||||
|---|---|---|---|---|---|---|---|
| Quadrant | DetID | PixID | Counts | Sigma | Mean | Median | Sigma |
| A | 0 | 128 | 9856 | 59.56 | 766 | 752 | 152.9 |
| A | 0 | 226 | 7308 | 42.89 | 766 | 752 | 152.9 |
| A | 12 | 194 | 6742 | 39.19 | 766 | 752 | 152.9 |
| B | 4 | 239 | 122107 | 828.64 | 784 | 769 | 146.4 |
| B | 10 | 16 | 58395 | 393.54 | 784 | 769 | 146.4 |
| B | 4 | 173 | 16929 | 110.36 | 784 | 769 | 146.4 |
| C | 1 | 16 | 1197658 | 6844.18 | 760 | 767 | 174.9 |
| C | 12 | 4 | 6122 | 30.62 | 760 | 767 | 174.9 |
| C | 13 | 61 | 5788 | 28.71 | 760 | 767 | 174.9 |
| D | 2 | 152 | 60230 | 325.73 | 749 | 728 | 182.7 |
| D | 2 | 136 | 46936 | 252.96 | 749 | 728 | 182.7 |
| D | 2 | 14 | 44488 | 239.55 | 749 | 728 | 182.7 |
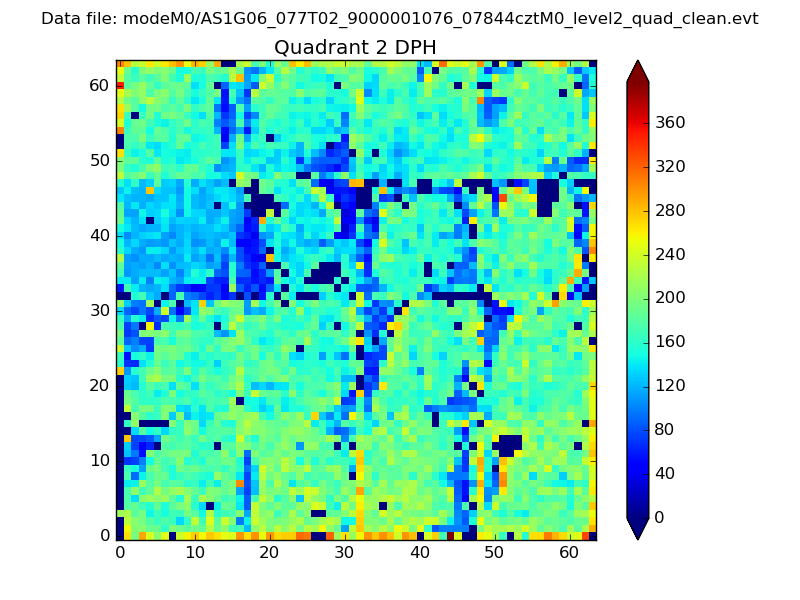
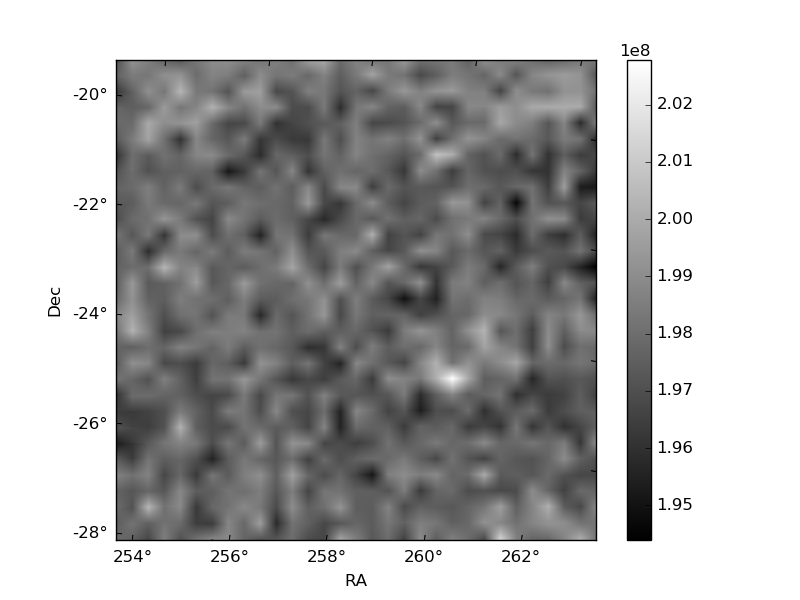
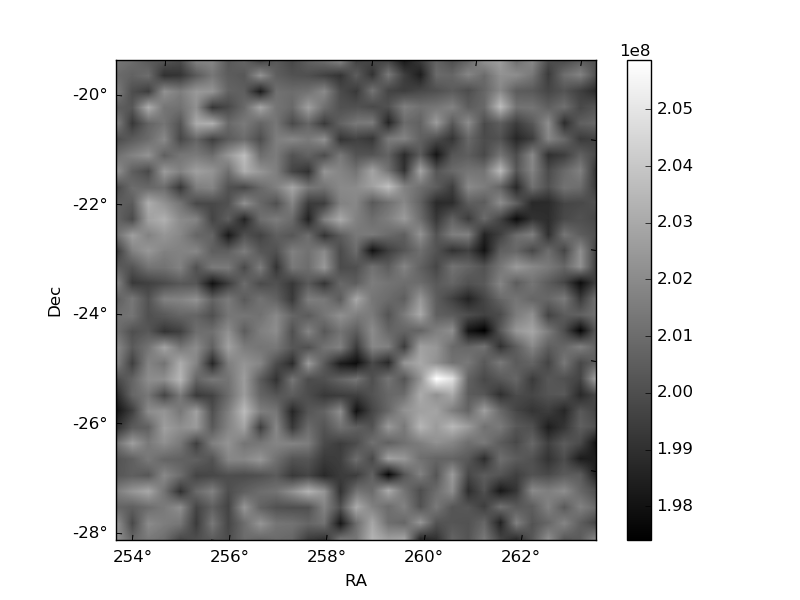
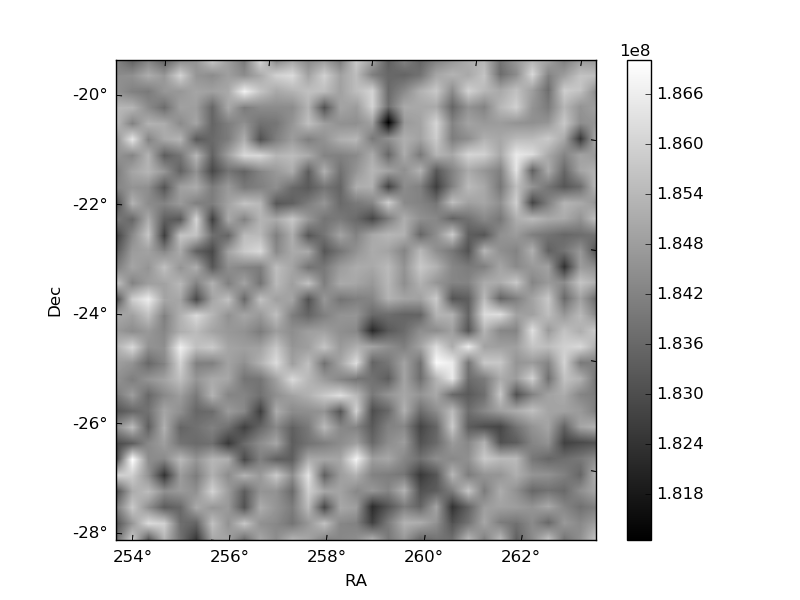
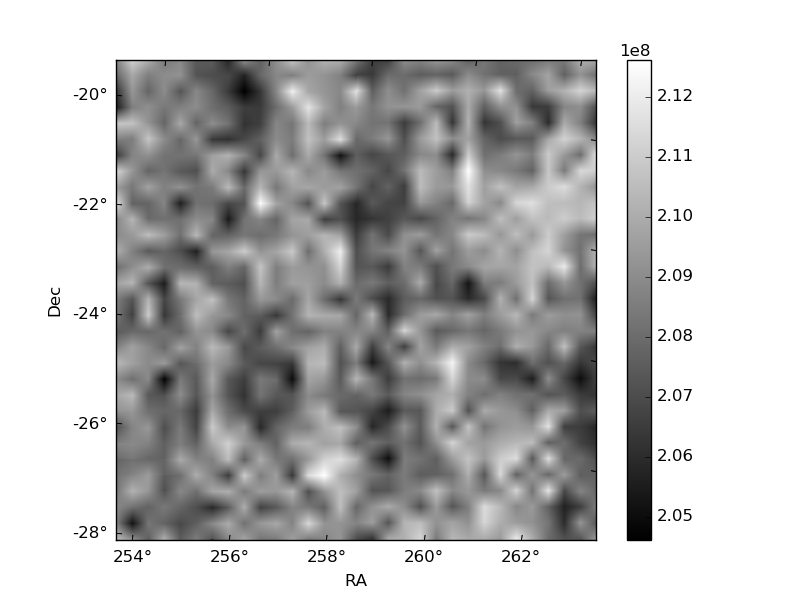
Histogram calculated using DETX and DETY for each event in the final _common_clean file
| Quadrant A | 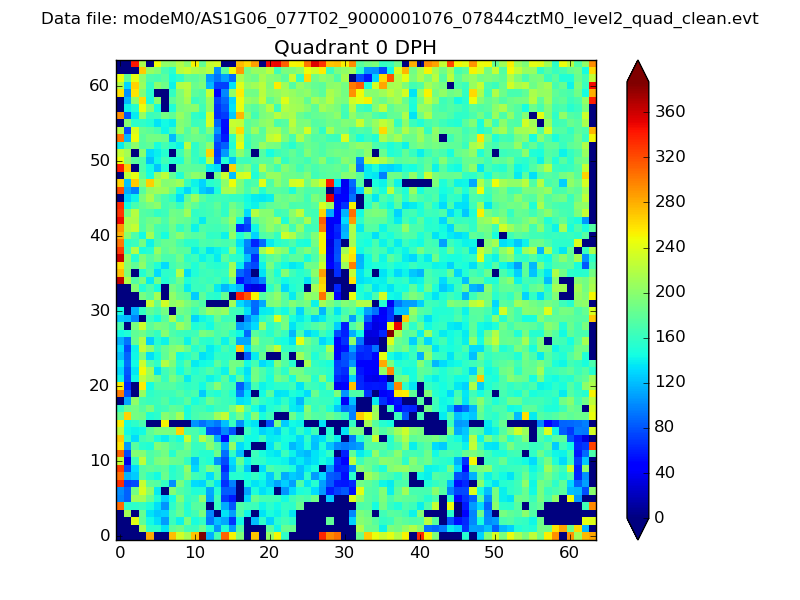 |
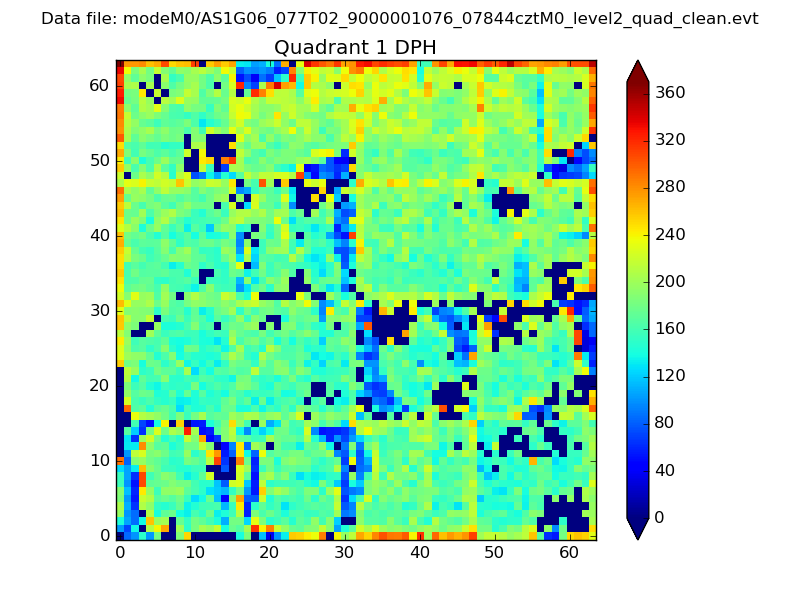 |
Quadrant B |
|---|---|---|---|
| Quadrant D | 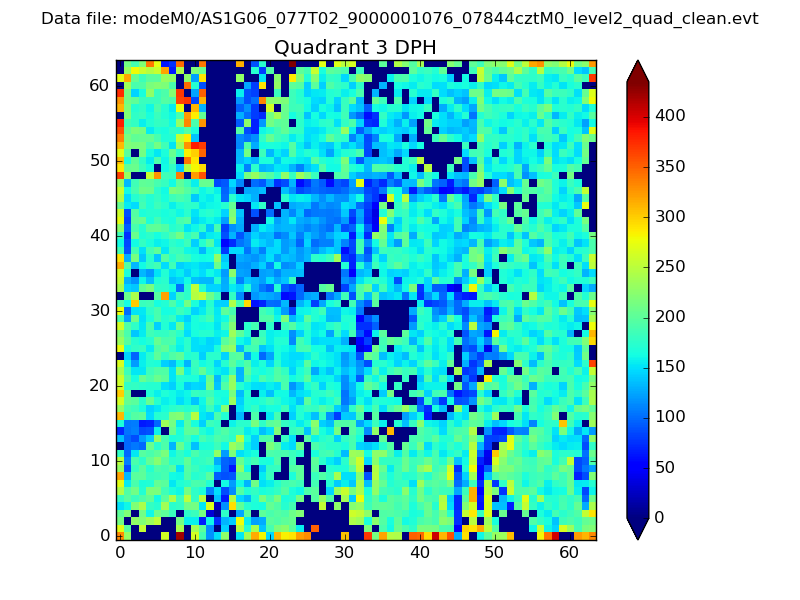 |
 |
Quadrant C |
| Plot type | Count rate plots | Images |
|---|---|---|
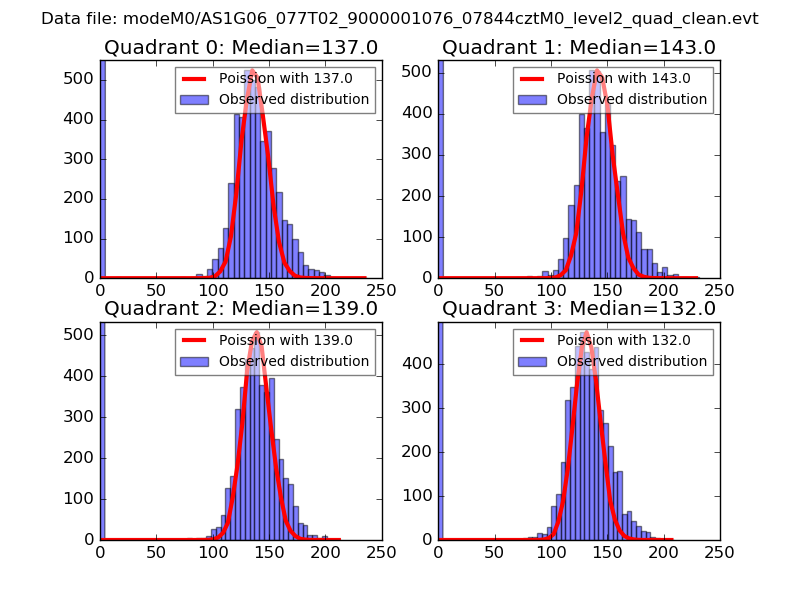
| Comparison with Poisson distribution Blue bars denote a histogram of data divided into 1 sec bins. Red curve is a Poisson curve with rate = median count rate of data. |
 |
 |
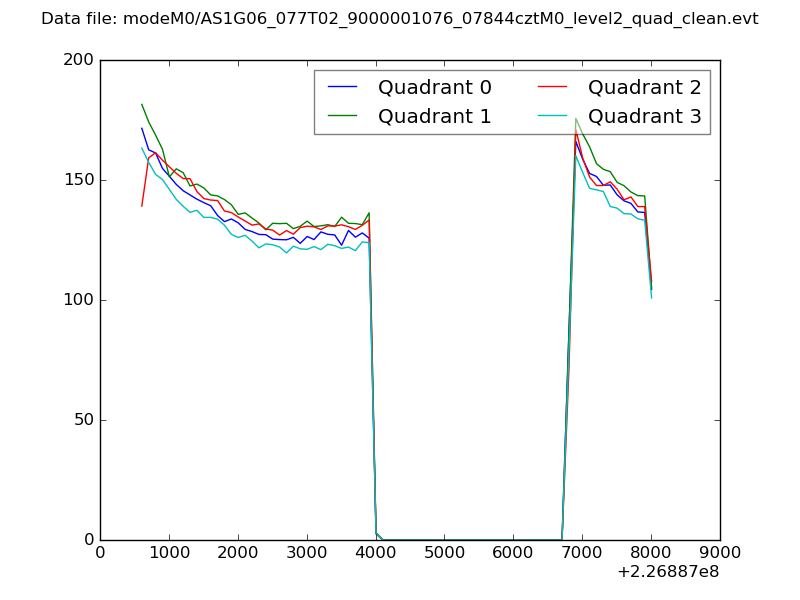
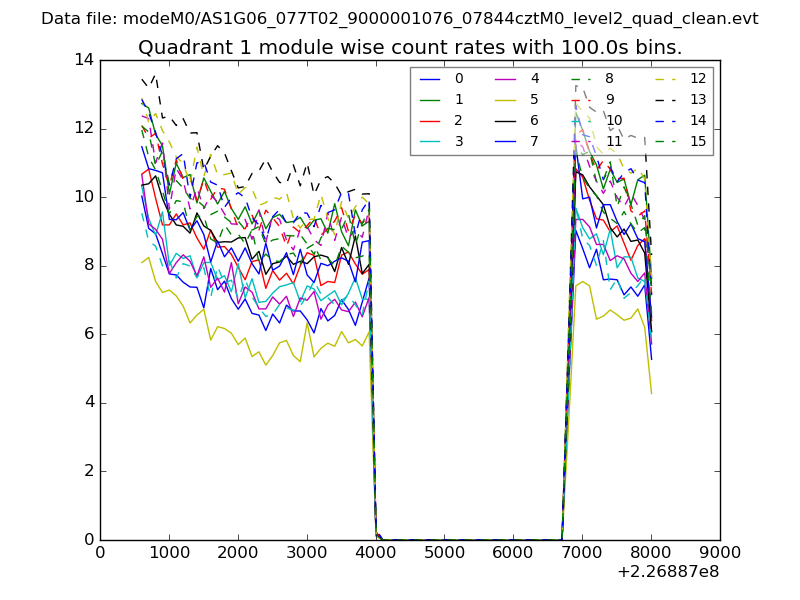
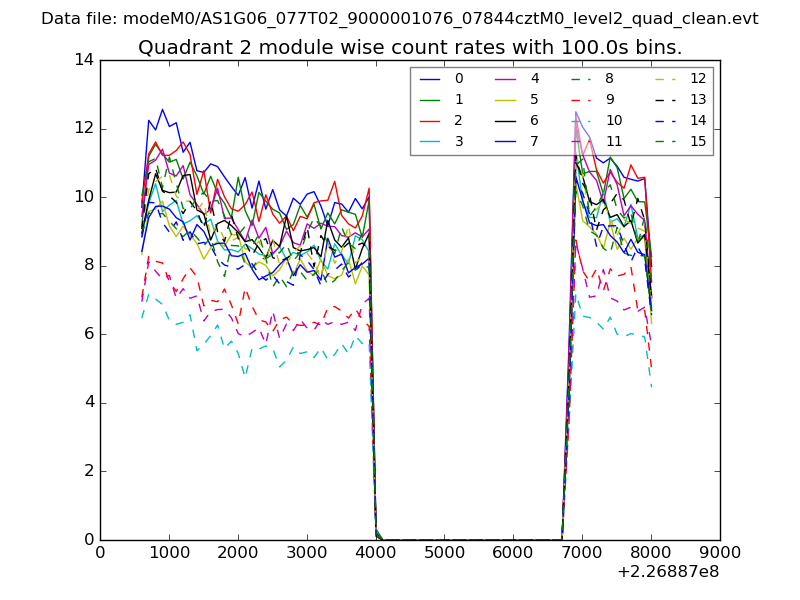
| Quadrant-wise count rates Data is divided into 100 sec bins |
 |
|
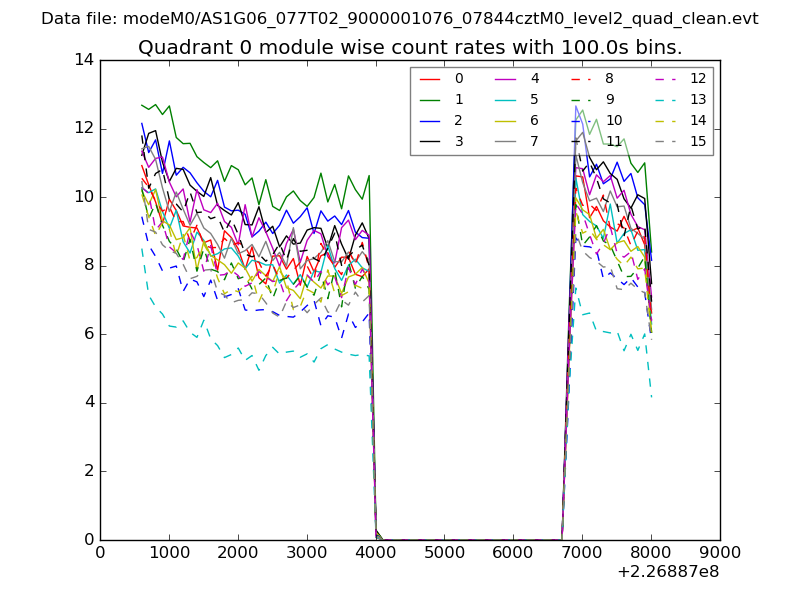
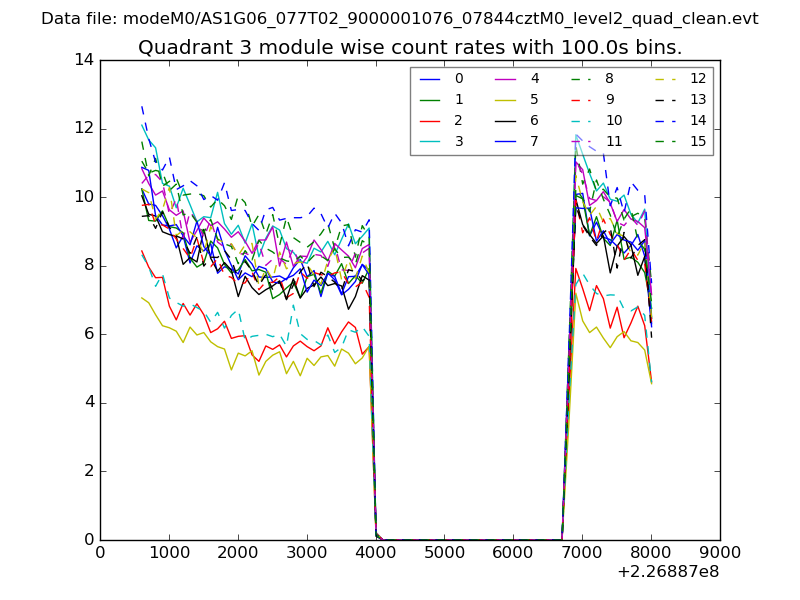
| Module-wise count rates for Quadrant A Data is divided into 100 sec bins |
 |
 |
| Module-wise count rates for Quadrant B Data is divided into 100 sec bins |
 |
 |
| Module-wise count rates for Quadrant C Data is divided into 100 sec bins |
 |
 |
| Module-wise count rates for Quadrant D Data is divided into 100 sec bins |
 |
 |
| Parameter | Plot |
|---|---|
| CZT HV Monitor | 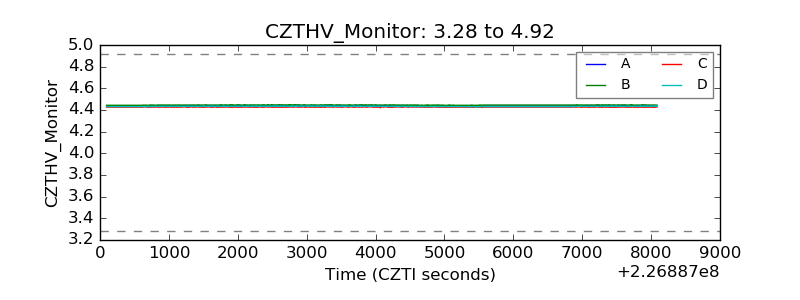 |
| D_VDD | 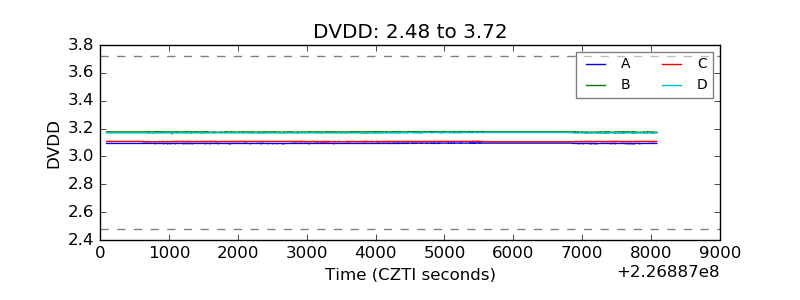 |
| Temperature 1 |  |
| Veto HV Monitor | 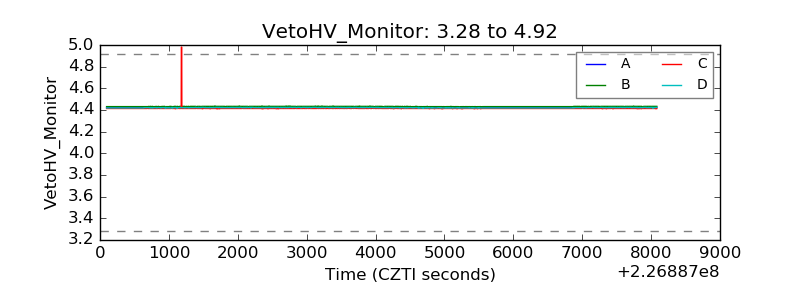 |
| Veto LLD | 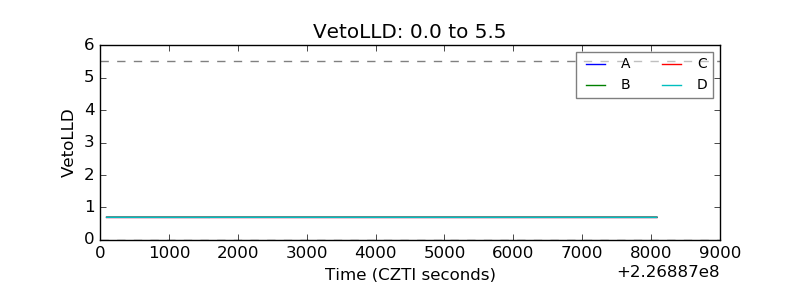 |
| Alpha Counter | 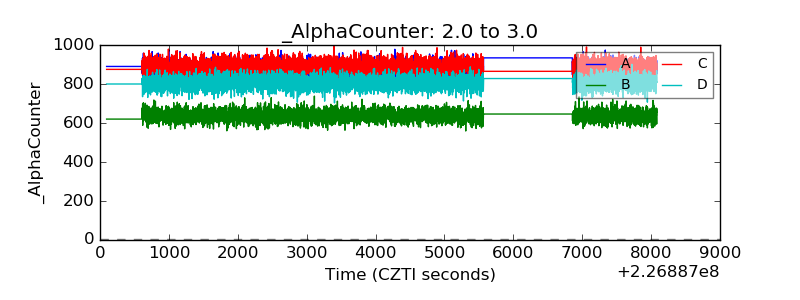 |
| _CPM_Rate | 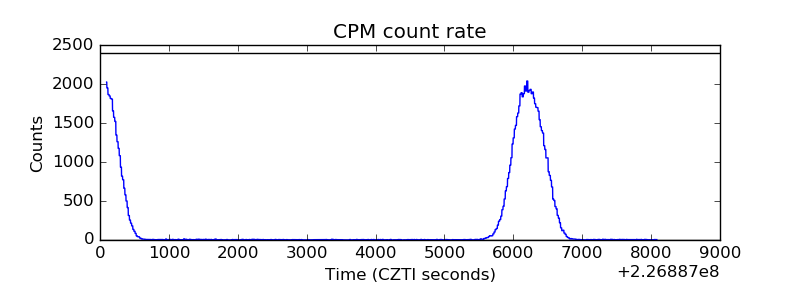 |
| CZT Counter | 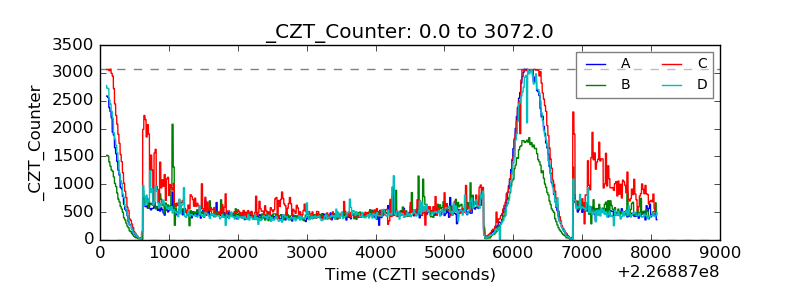 |
| +2.5 Volts monitor |  |
| +5 Volts monitor |  |
| _ROLL_ROT | 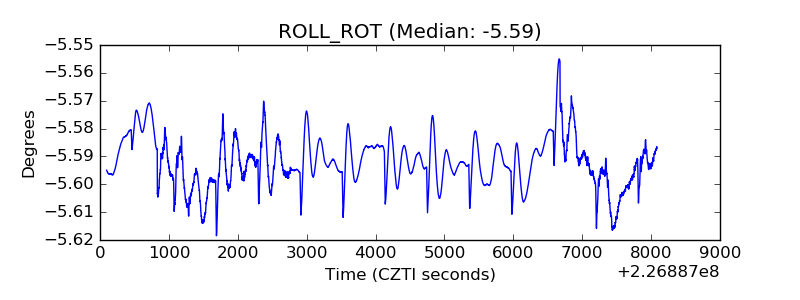 |
| _Roll_DEC | 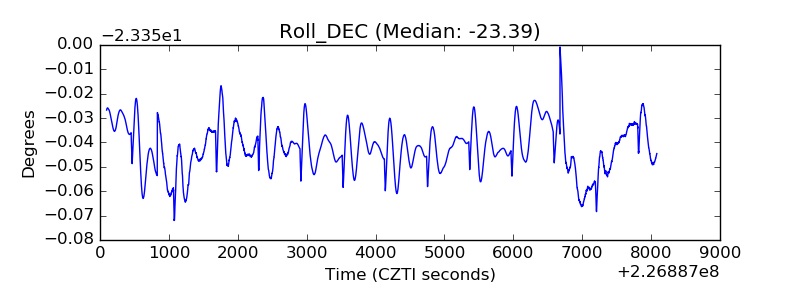 |
| _Roll_RA | 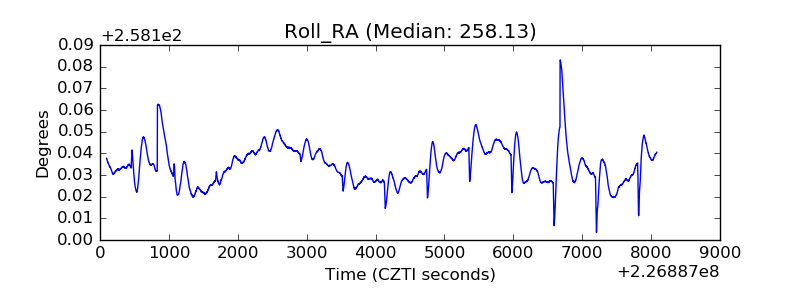 |
| Veto Counter | 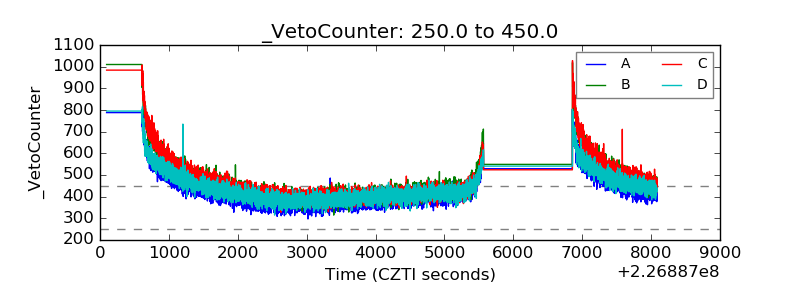 |