| Param | Original file | Final file |
|---|---|---|
| Filename | modeM0/AS1G06_077T02_9000001076_07845cztM0_level2.evt | modeM0/AS1G06_077T02_9000001076_07845cztM0_level2_quad_clean.evt |
| Size (bytes) | 485,971,200 | 99,659,520 |
| Size | 463.5 MB | 95.0 MB |
| Events in quadrant A | 3,131,929 | 638,323 |
| Events in quadrant B | 3,401,977 | 661,556 |
| Events in quadrant C | 3,962,961 | 648,124 |
| Events in quadrant D | 3,773,302 | 610,263 |
| Mode M9 | |||
|---|---|---|---|
| Quadrant | BADHDUFLAG | Total packets | Discarded packets |
| A | 0 | 23 | 0 |
| B | 0 | 23 | 0 |
| C | 0 | 23 | 0 |
| D | 0 | 24 | 0 |
| Mode M0 | |||
|---|---|---|---|
| Quadrant | BADHDUFLAG | Total packets | Discarded packets |
| A | 0 | 13615 | 3 |
| B | 0 | 14301 | 2 |
| C | 0 | 16103 | 2 |
| D | 0 | 15739 | 2 |
| Mode SS | |||
|---|---|---|---|
| Quadrant | BADHDUFLAG | Total packets | Discarded packets |
| A | 0 | 134 | 0 |
| B | 0 | 134 | 0 |
| C | 0 | 134 | 0 |
| D | 0 | 134 | 0 |
| Quadrant | Total seconds | Saturated seconds | Saturation percentage |
|---|---|---|---|
| A | 6595 | 12 | 0.181956% |
| B | 6595 | 46 | 0.697498% |
| C | 6595 | 46 | 0.697498% |
| D | 6595 | 112 | 1.698256% |
Noise dominated data is calculated using 1-second bins in cleaned event files. If a bin has >2000 counts, and if more than 50% of those come from <1% of pixels, then it is considered to be noise-dominated and hence unusable.
| Quadrant | # 1 sec bins | Bins with >0 counts | Bins with >2000 counts | High rate bins dominated by noise | Noise dominated (total time) | Noise dominated (detector-on time) | Marked lightcurve |
|---|---|---|---|---|---|---|---|
| A | 7911 | 6597 | 0 | 0 | 0.00% | 0.00% | 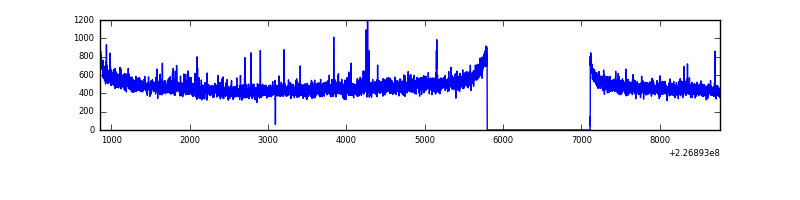 |
| B | 7911 | 6597 | 11 | 11 | 0.14% | 0.17% | 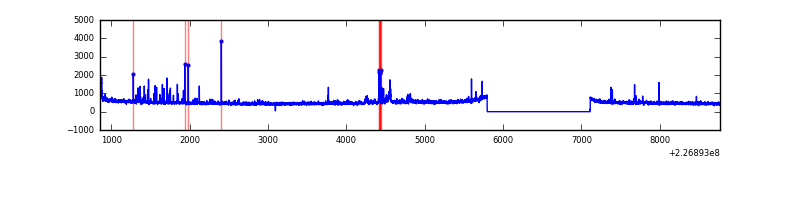 |
| C | 7911 | 6597 | 17 | 17 | 0.21% | 0.26% | 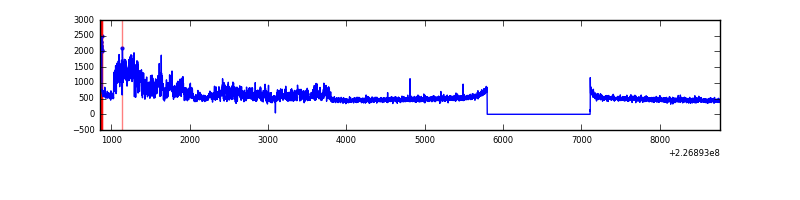 |
| D | 7911 | 6597 | 107 | 107 | 1.35% | 1.62% | 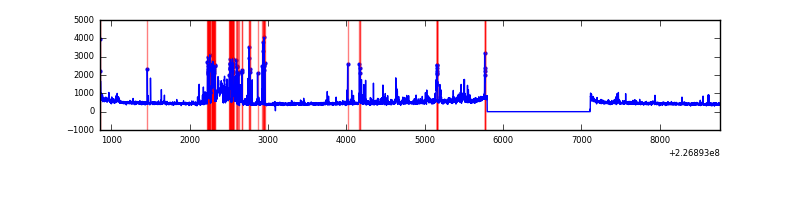 |
Top three noisy pixels from each quadrant. If the there are fewer than three noisy pixels in the level2.evt file, extra rows are filled as -1
| Pixel properties | Quadrant properties | ||||||
|---|---|---|---|---|---|---|---|
| Quadrant | DetID | PixID | Counts | Sigma | Mean | Median | Sigma |
| A | 0 | 128 | 17093 | 101.0 | 805 | 792 | 161.4 |
| A | 15 | 239 | 7517 | 41.67 | 805 | 792 | 161.4 |
| A | 0 | 226 | 7479 | 41.43 | 805 | 792 | 161.4 |
| B | 4 | 239 | 68637 | 441.37 | 820 | 803 | 153.7 |
| B | 10 | 16 | 68106 | 437.92 | 820 | 803 | 153.7 |
| B | 4 | 173 | 29650 | 187.7 | 820 | 803 | 153.7 |
| C | 1 | 16 | 832800 | 4496.99 | 802 | 812 | 185.0 |
| C | 13 | 61 | 6401 | 30.21 | 802 | 812 | 185.0 |
| C | 12 | 4 | 2415 | 8.66 | 802 | 812 | 185.0 |
| D | 14 | 34 | 489927 | 2573.08 | 787 | 767 | 190.1 |
| D | 2 | 152 | 58871 | 305.64 | 787 | 767 | 190.1 |
| D | 13 | 105 | 50706 | 262.69 | 787 | 767 | 190.1 |
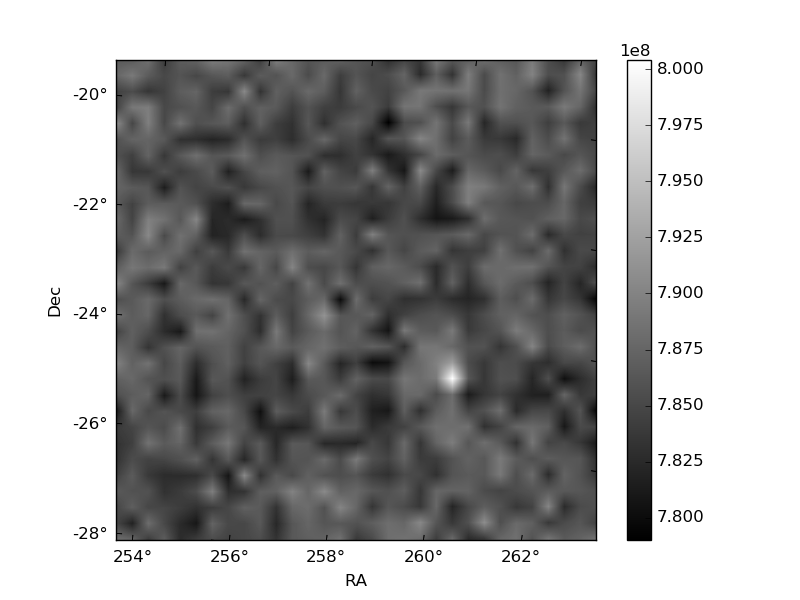
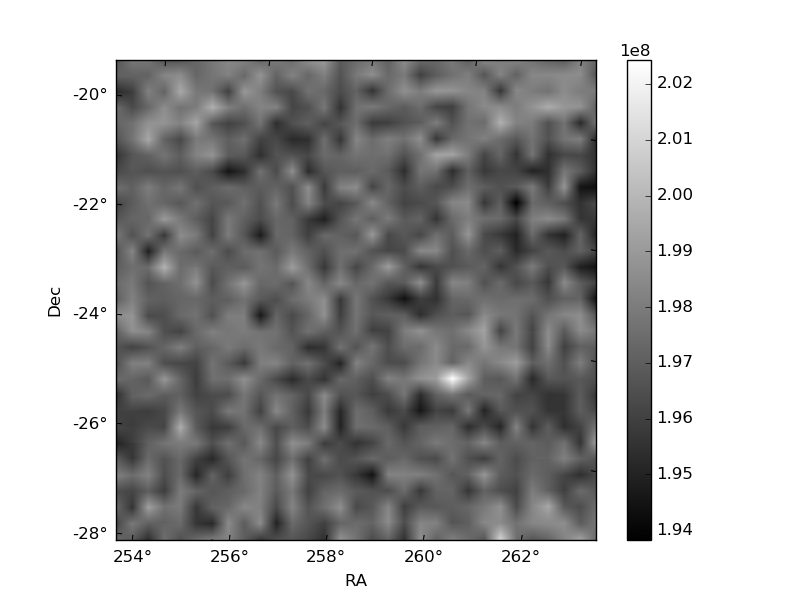
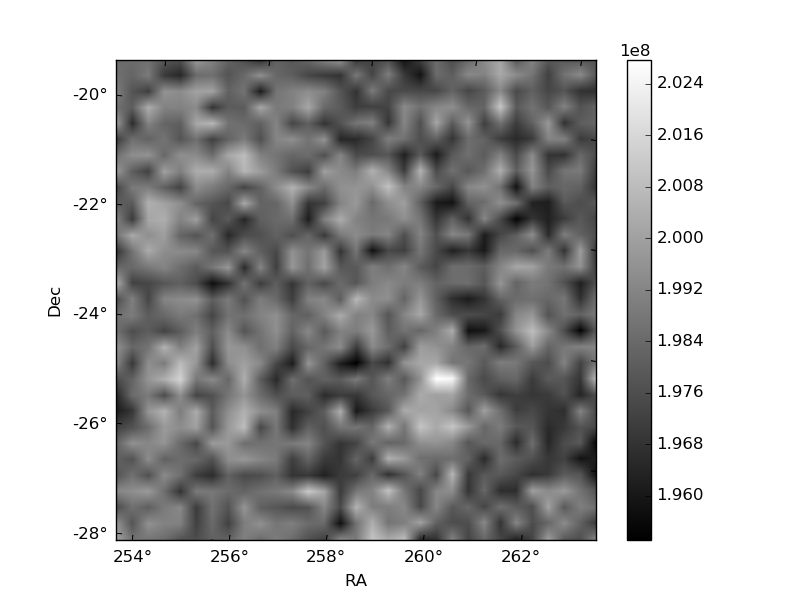
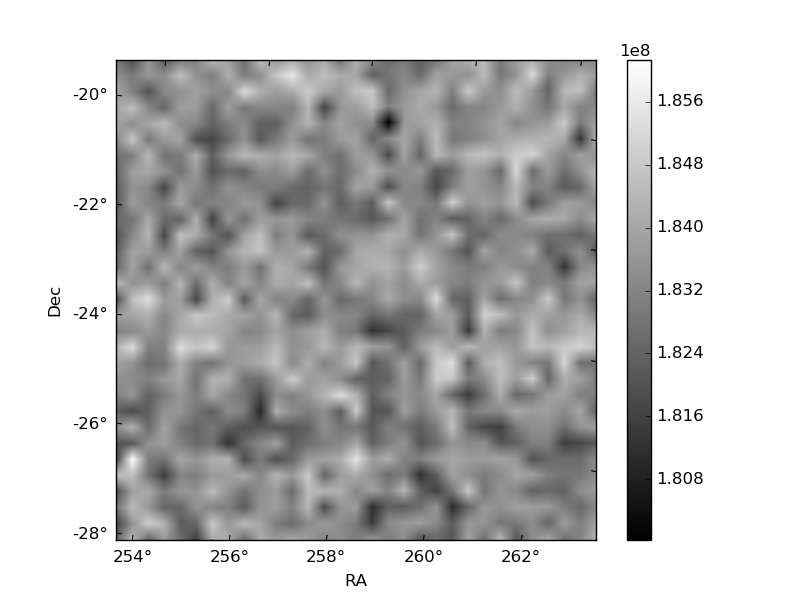
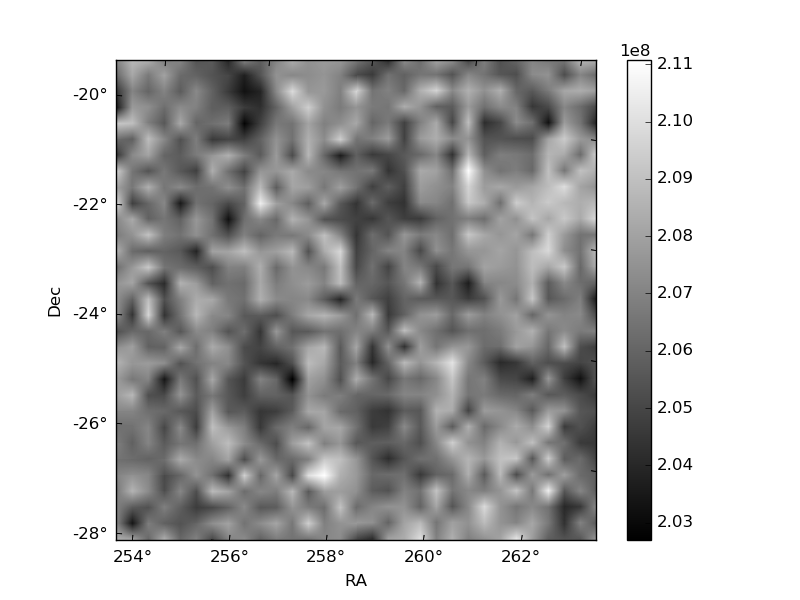
Histogram calculated using DETX and DETY for each event in the final _common_clean file
| Quadrant A | 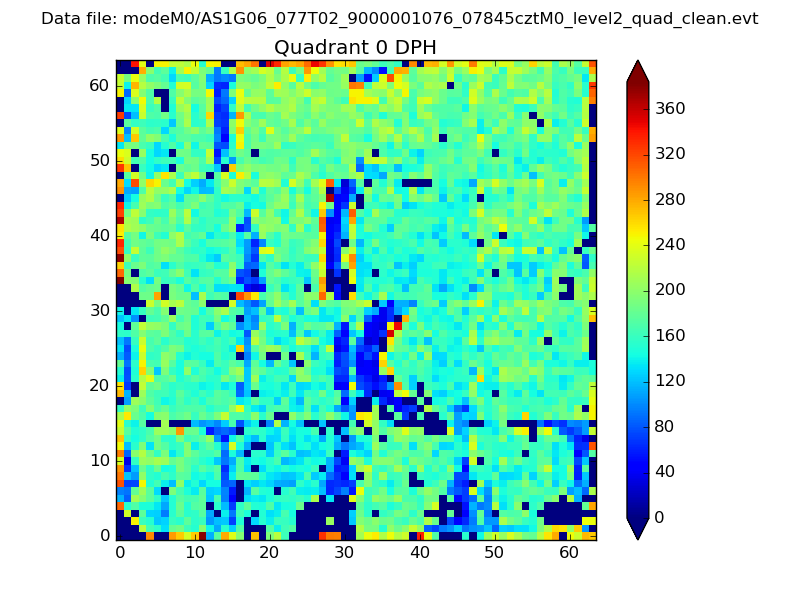 |
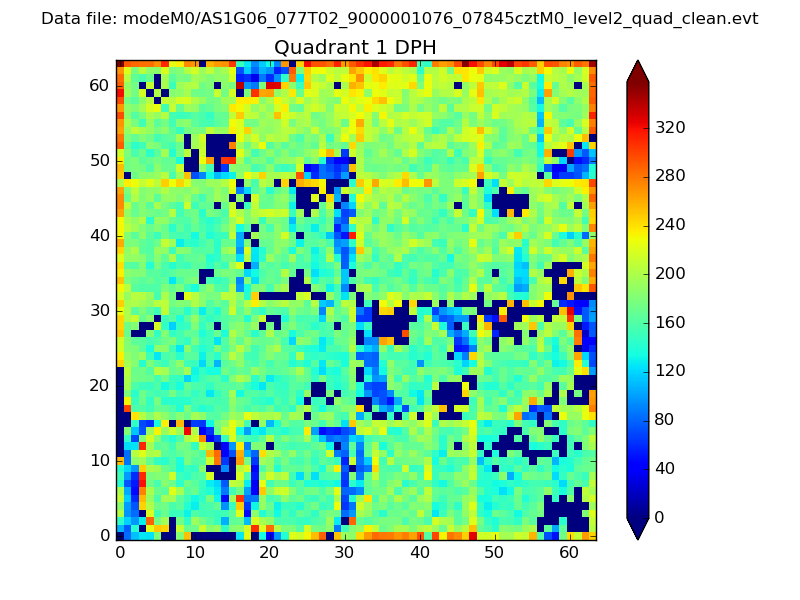 |
Quadrant B |
|---|---|---|---|
| Quadrant D | 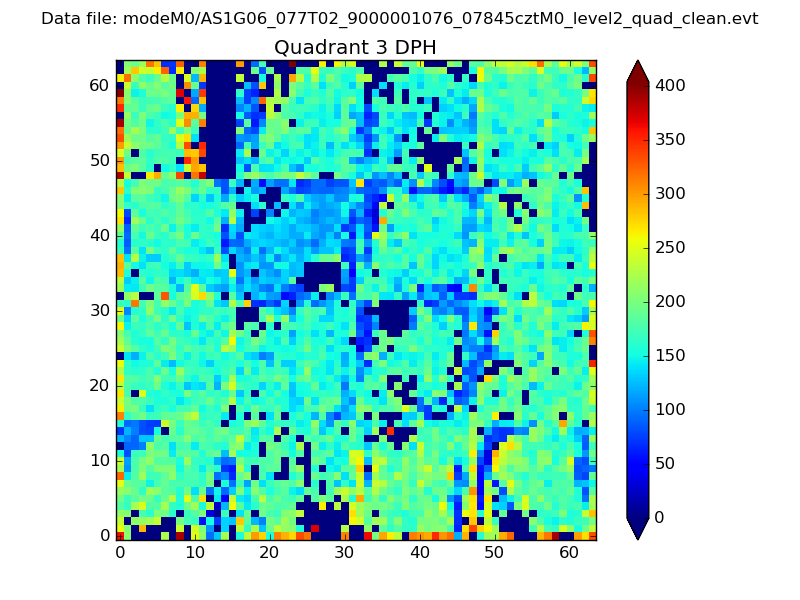 |
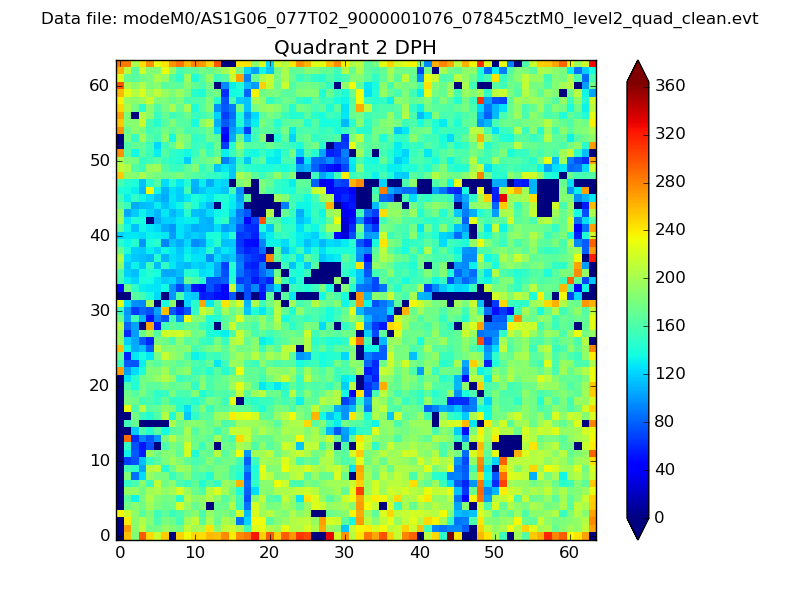 |
Quadrant C |
| Plot type | Count rate plots | Images |
|---|---|---|
| Comparison with Poisson distribution Blue bars denote a histogram of data divided into 1 sec bins. Red curve is a Poisson curve with rate = median count rate of data. |
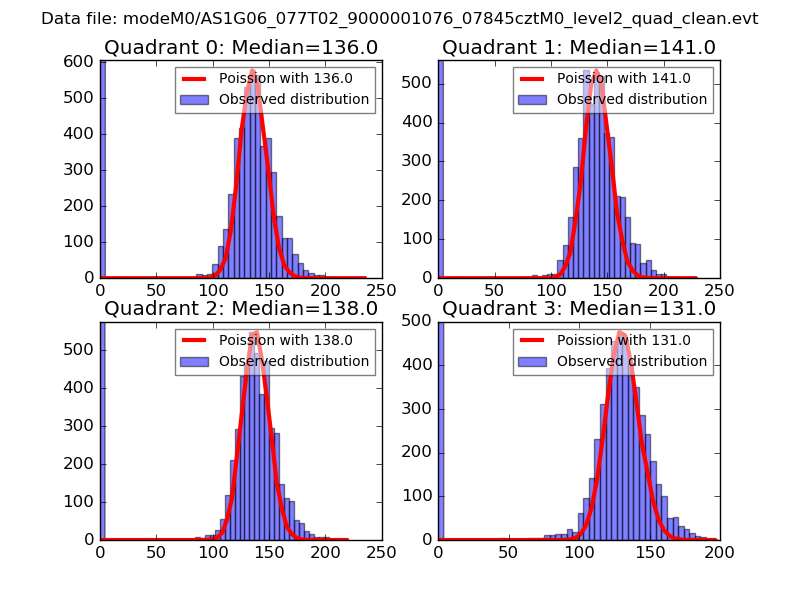 |
 |
| Quadrant-wise count rates Data is divided into 100 sec bins |
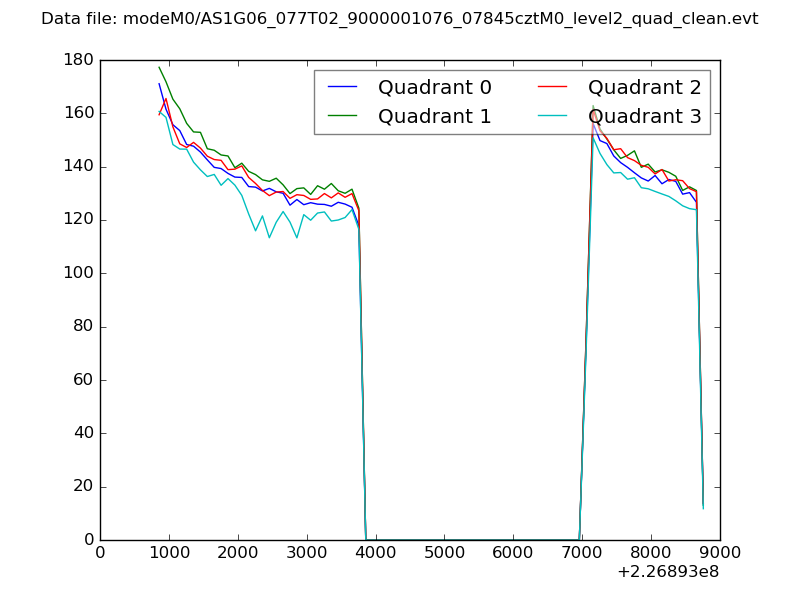 |
|
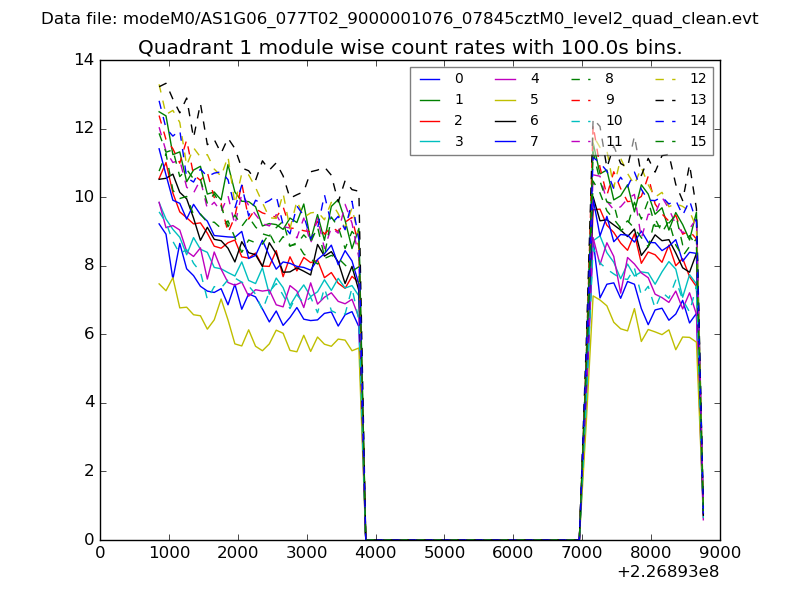
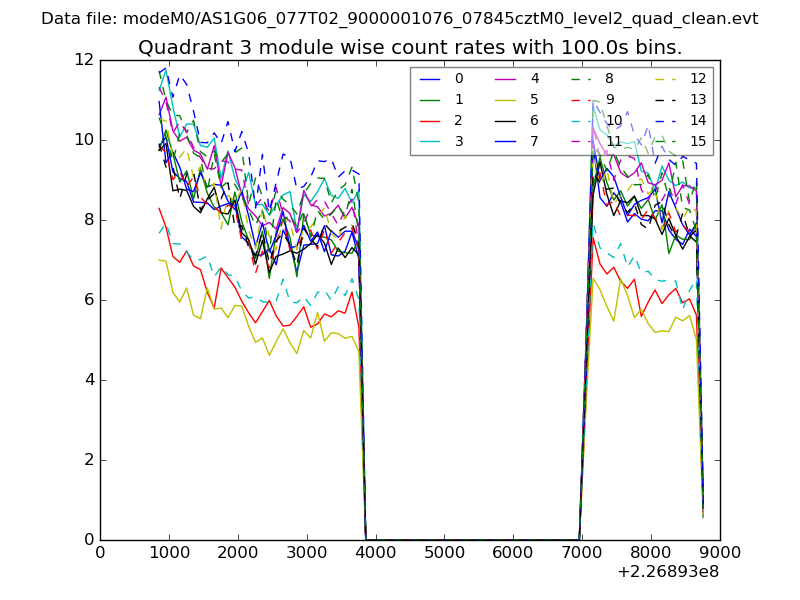
| Module-wise count rates for Quadrant A Data is divided into 100 sec bins |
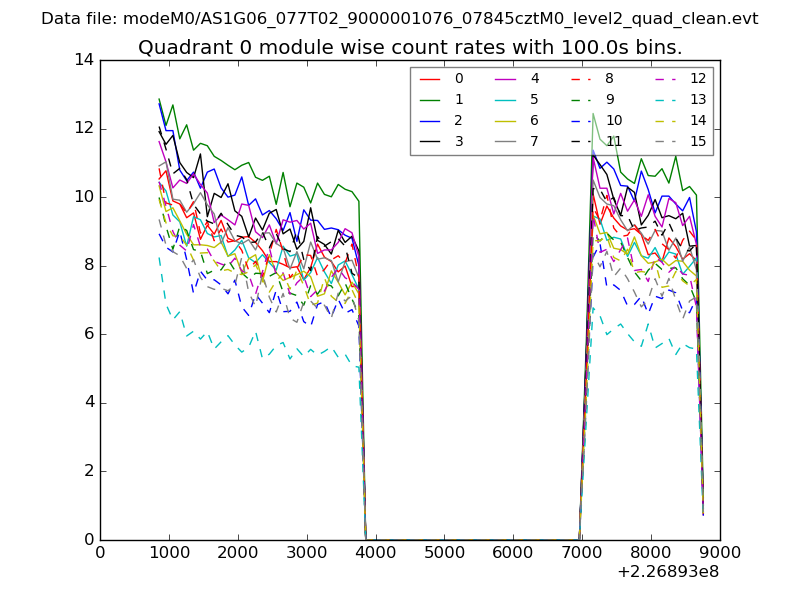 |
 |
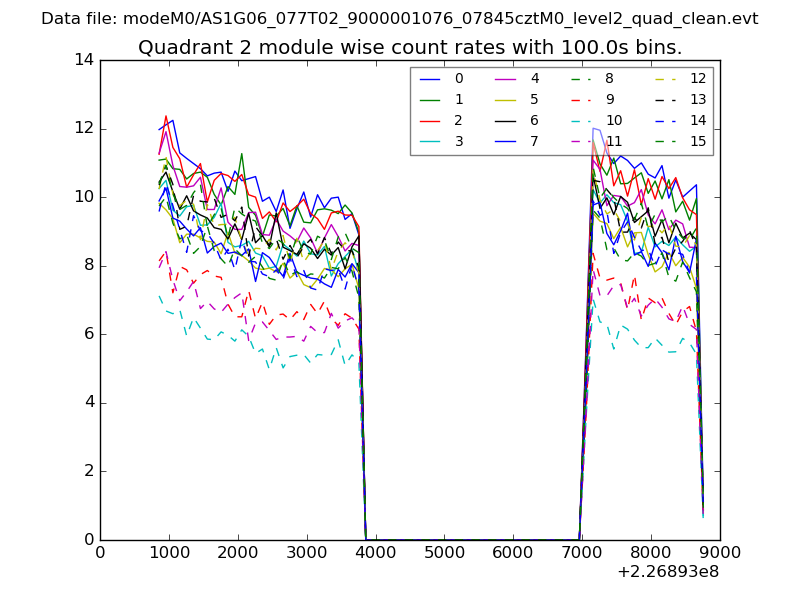
| Module-wise count rates for Quadrant B Data is divided into 100 sec bins |
 |
 |
| Module-wise count rates for Quadrant C Data is divided into 100 sec bins |
 |
 |
| Module-wise count rates for Quadrant D Data is divided into 100 sec bins |
 |
 |
| Parameter | Plot |
|---|---|
| CZT HV Monitor | 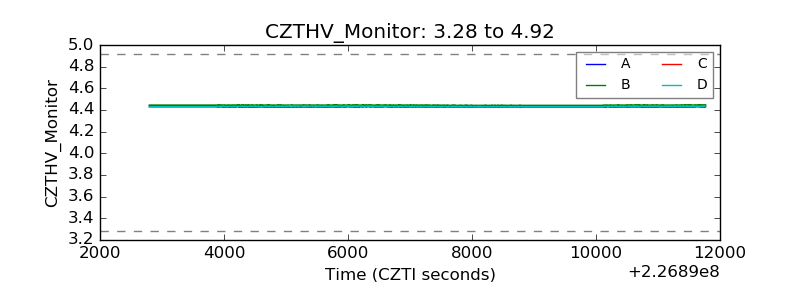 |
| D_VDD | 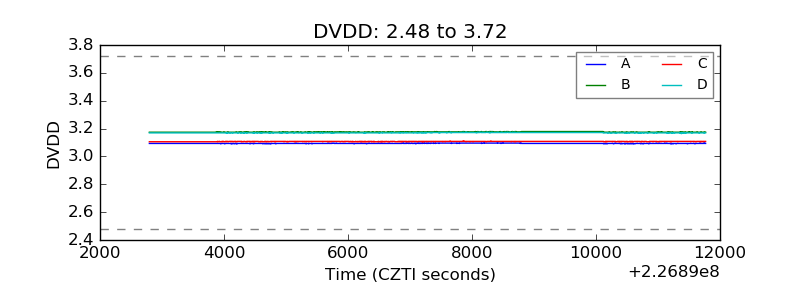 |
| Temperature 1 | 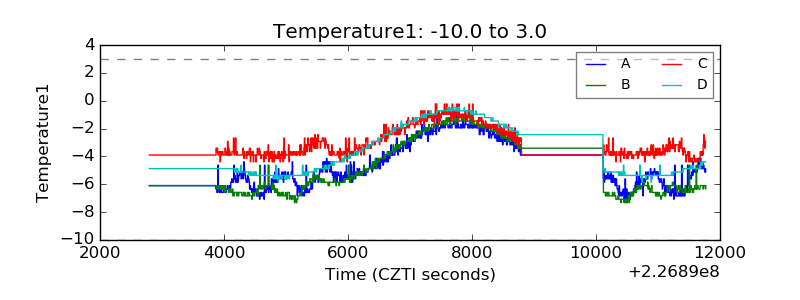 |
| Veto HV Monitor | 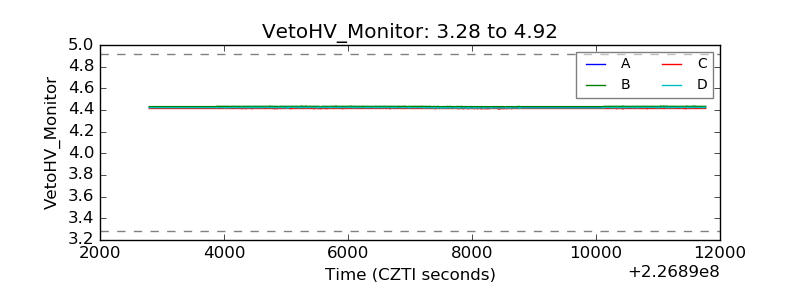 |
| Veto LLD | 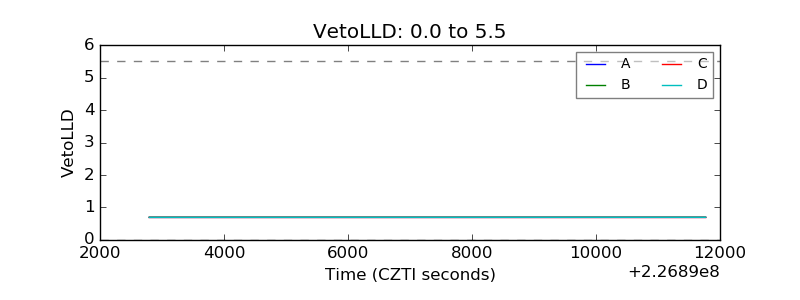 |
| Alpha Counter | 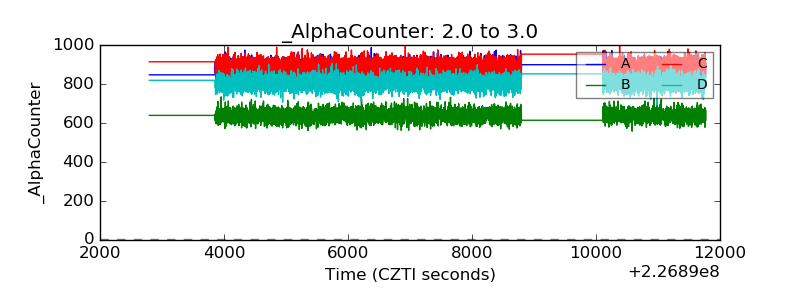 |
| _CPM_Rate | 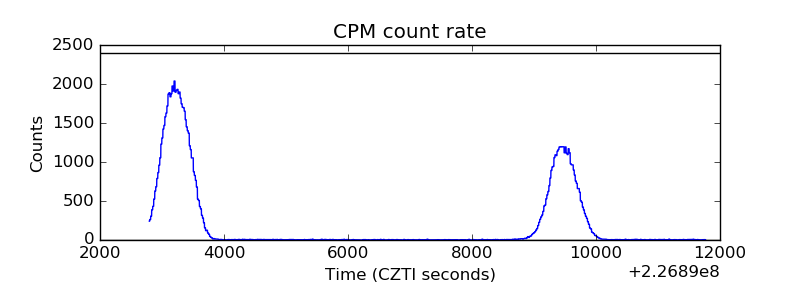 |
| CZT Counter | 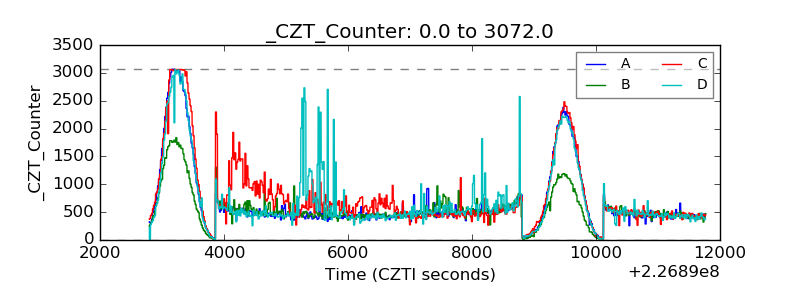 |
| +2.5 Volts monitor |  |
| +5 Volts monitor |  |
| _ROLL_ROT | 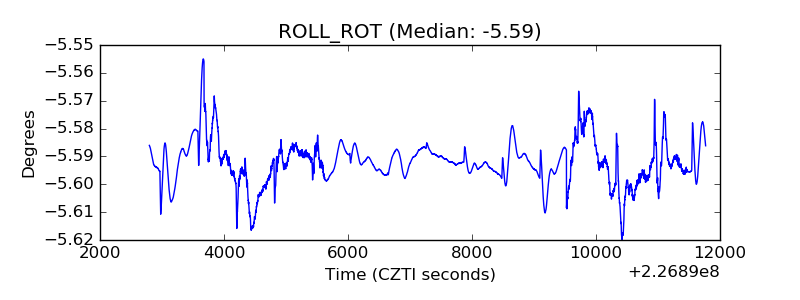 |
| _Roll_DEC | 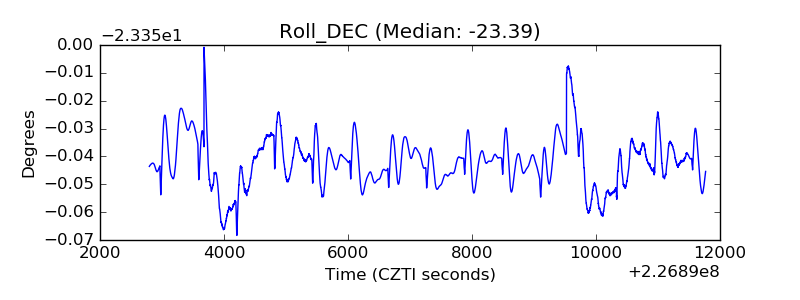 |
| _Roll_RA | 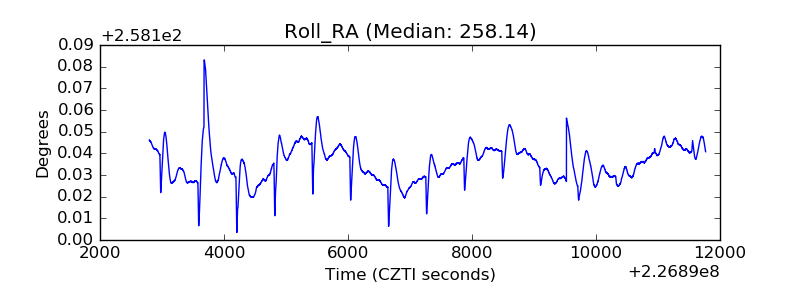 |
| Veto Counter | 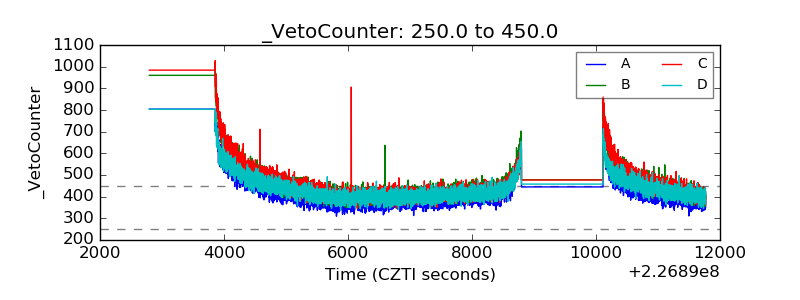 |