| Param | Original file | Final file |
|---|---|---|
| Filename | modeM0/AS1G06_077T02_9000001076_07846cztM0_level2.evt | modeM0/AS1G06_077T02_9000001076_07846cztM0_level2_quad_clean.evt |
| Size (bytes) | 473,918,400 | 95,112,000 |
| Size | 452.0 MB | 90.7 MB |
| Events in quadrant A | 3,142,988 | 600,480 |
| Events in quadrant B | 3,361,069 | 621,559 |
| Events in quadrant C | 4,074,298 | 609,681 |
| Events in quadrant D | 3,318,679 | 580,979 |
| Mode M9 | |||
|---|---|---|---|
| Quadrant | BADHDUFLAG | Total packets | Discarded packets |
| A | 0 | 17 | 0 |
| B | 0 | 17 | 0 |
| C | 0 | 17 | 0 |
| D | 0 | 18 | 0 |
| Mode M0 | |||
|---|---|---|---|
| Quadrant | BADHDUFLAG | Total packets | Discarded packets |
| A | 0 | 13812 | 3 |
| B | 0 | 14365 | 2 |
| C | 0 | 16746 | 2 |
| D | 0 | 14483 | 2 |
| Mode SS | |||
|---|---|---|---|
| Quadrant | BADHDUFLAG | Total packets | Discarded packets |
| A | 0 | 136 | 0 |
| B | 0 | 136 | 0 |
| C | 0 | 136 | 0 |
| D | 0 | 136 | 0 |
| Quadrant | Total seconds | Saturated seconds | Saturation percentage |
|---|---|---|---|
| A | 6709 | 22 | 0.327918% |
| B | 6709 | 45 | 0.670741% |
| C | 6709 | 103 | 1.535251% |
| D | 6709 | 24 | 0.357728% |
Noise dominated data is calculated using 1-second bins in cleaned event files. If a bin has >2000 counts, and if more than 50% of those come from <1% of pixels, then it is considered to be noise-dominated and hence unusable.
| Quadrant | # 1 sec bins | Bins with >0 counts | Bins with >2000 counts | High rate bins dominated by noise | Noise dominated (total time) | Noise dominated (detector-on time) | Marked lightcurve |
|---|---|---|---|---|---|---|---|
| A | 7904 | 6710 | 4 | 4 | 0.05% | 0.06% | 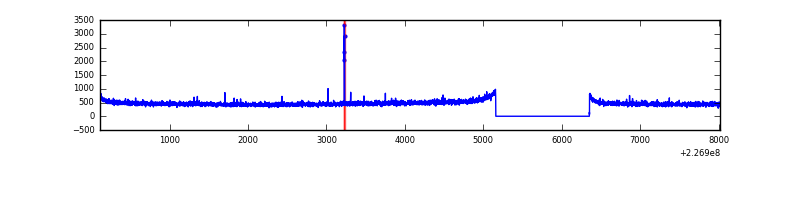 |
| B | 7904 | 6710 | 7 | 7 | 0.09% | 0.10% | 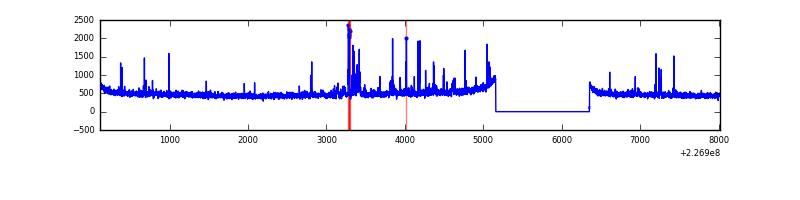 |
| C | 7904 | 6710 | 33 | 33 | 0.42% | 0.49% | 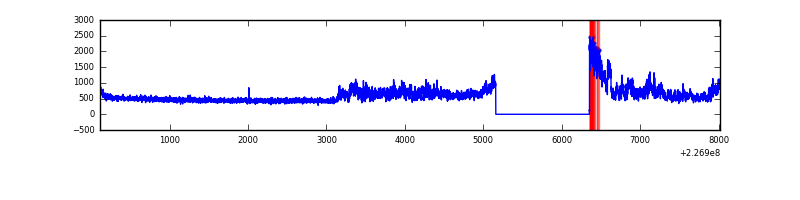 |
| D | 7904 | 6710 | 8 | 8 | 0.10% | 0.12% | 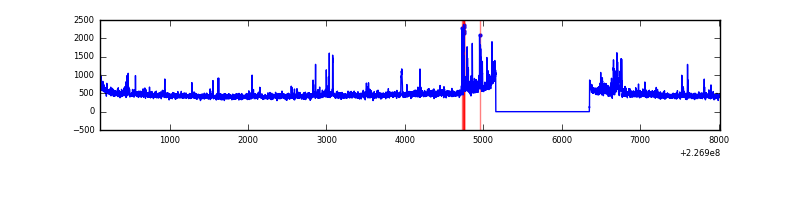 |
Top three noisy pixels from each quadrant. If the there are fewer than three noisy pixels in the level2.evt file, extra rows are filled as -1
| Pixel properties | Quadrant properties | ||||||
|---|---|---|---|---|---|---|---|
| Quadrant | DetID | PixID | Counts | Sigma | Mean | Median | Sigma |
| A | 15 | 174 | 16249 | 94.54 | 808 | 793 | 163.5 |
| A | 0 | 128 | 12353 | 70.71 | 808 | 793 | 163.5 |
| A | 0 | 226 | 7504 | 41.05 | 808 | 793 | 163.5 |
| B | 4 | 239 | 80752 | 517.87 | 819 | 803 | 154.4 |
| B | 4 | 173 | 37886 | 240.21 | 819 | 803 | 154.4 |
| B | 15 | 204 | 19362 | 120.22 | 819 | 803 | 154.4 |
| C | 1 | 16 | 944279 | 5090.74 | 799 | 803 | 185.3 |
| C | 8 | 229 | 8926 | 43.83 | 799 | 803 | 185.3 |
| C | 13 | 61 | 6212 | 29.19 | 799 | 803 | 185.3 |
| D | 13 | 137 | 163553 | 840.06 | 796 | 776 | 193.8 |
| D | 2 | 152 | 34289 | 172.95 | 796 | 776 | 193.8 |
| D | 1 | 52 | 26863 | 134.63 | 796 | 776 | 193.8 |
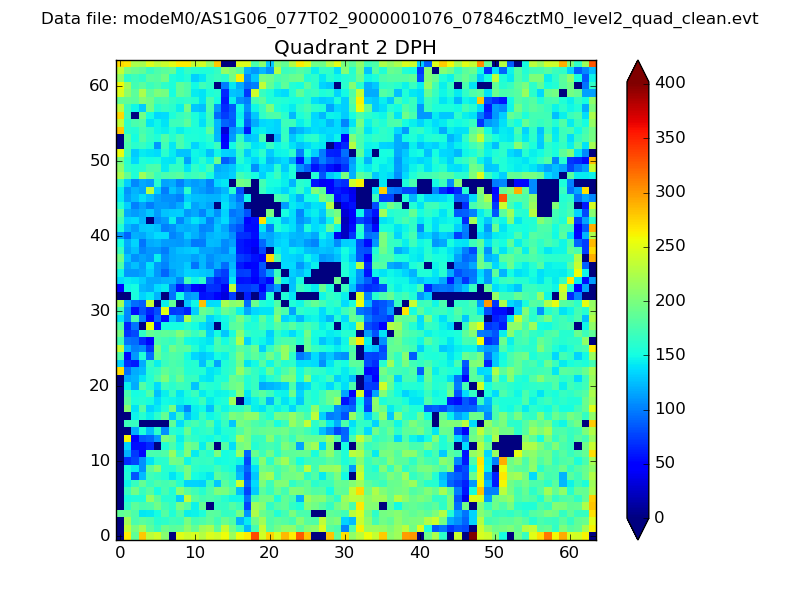
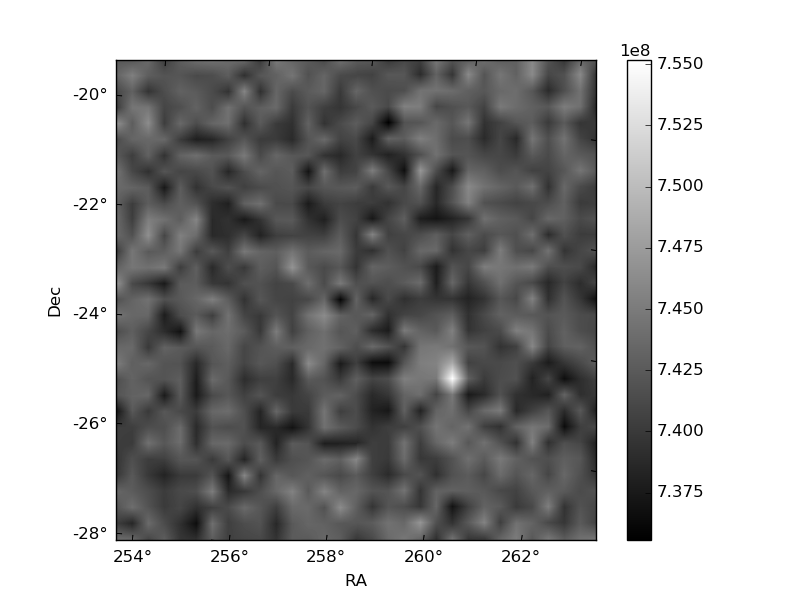
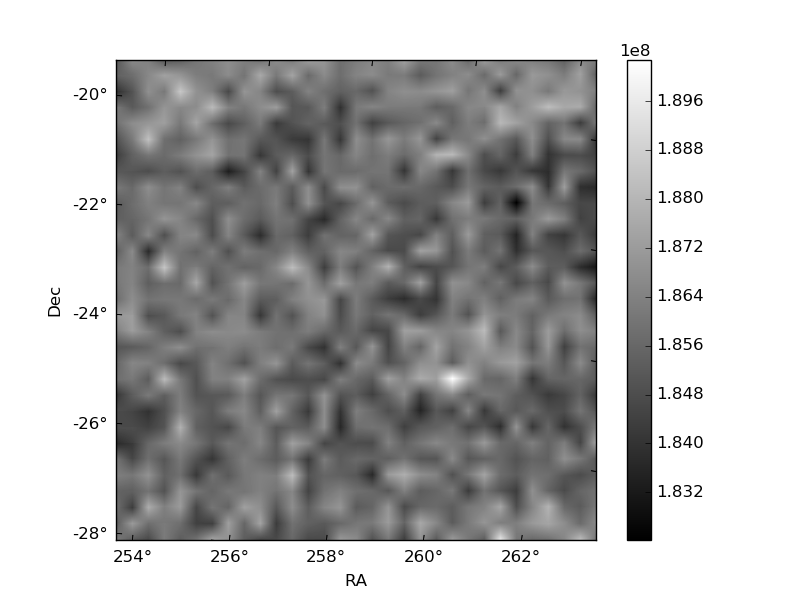
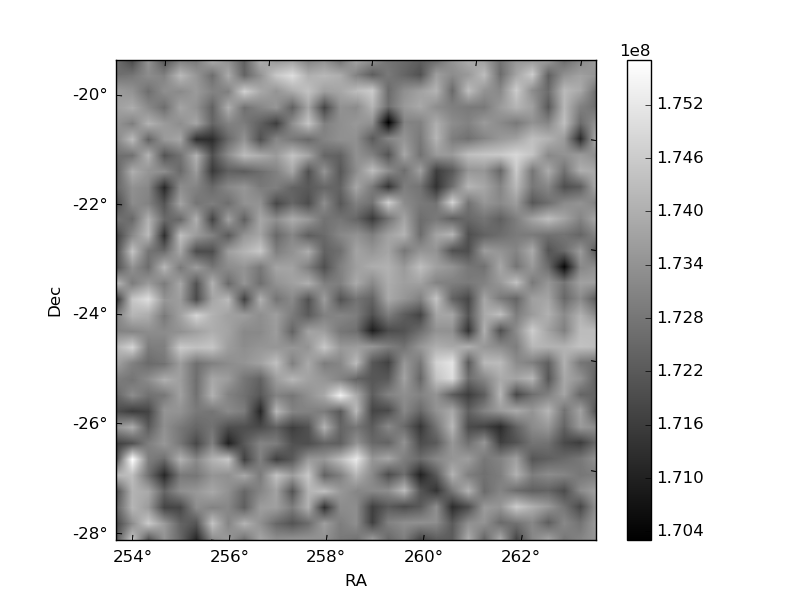
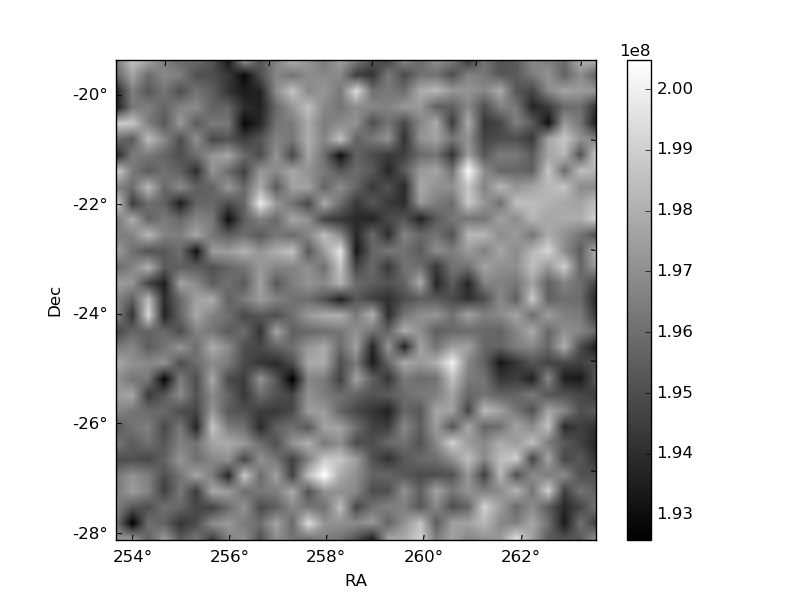
Histogram calculated using DETX and DETY for each event in the final _common_clean file
| Quadrant A | 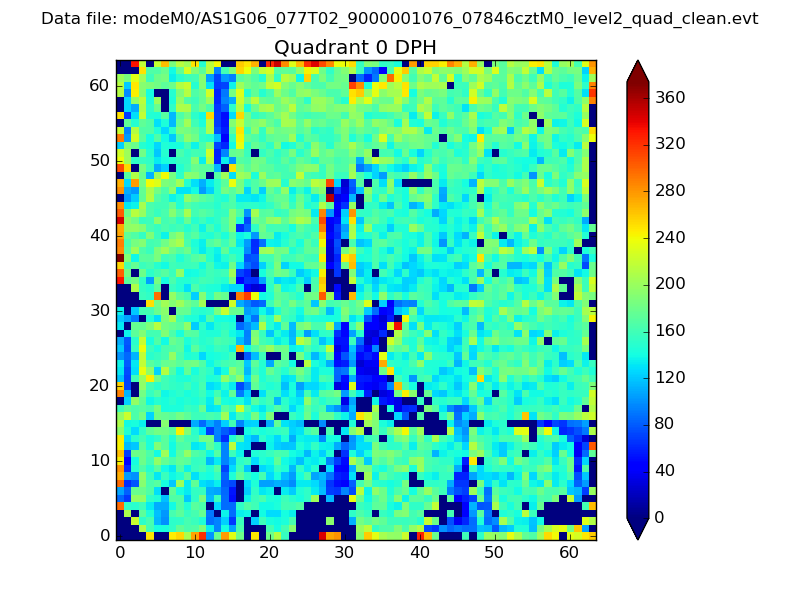 |
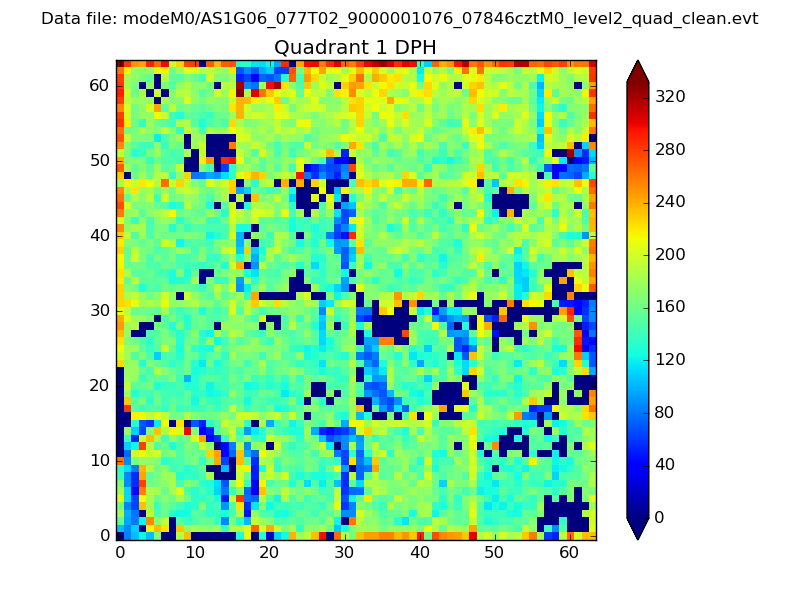 |
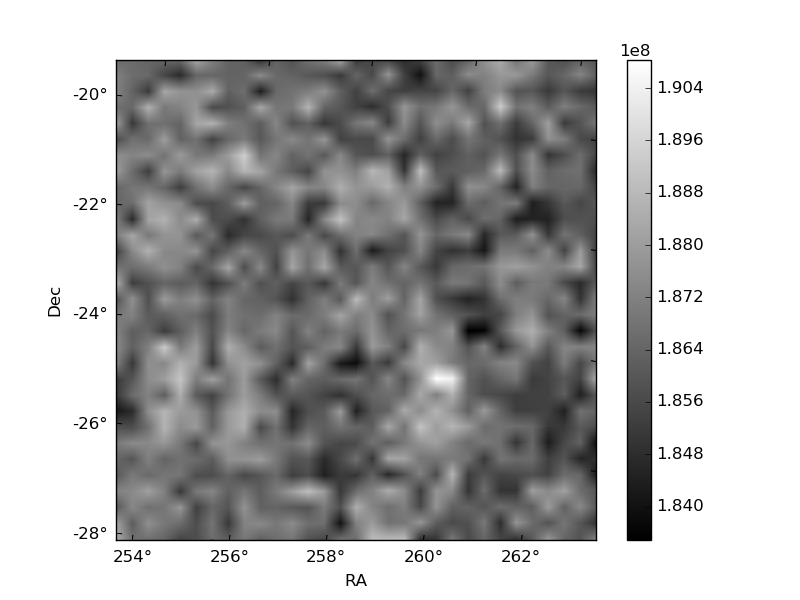
Quadrant B |
|---|---|---|---|
| Quadrant D | 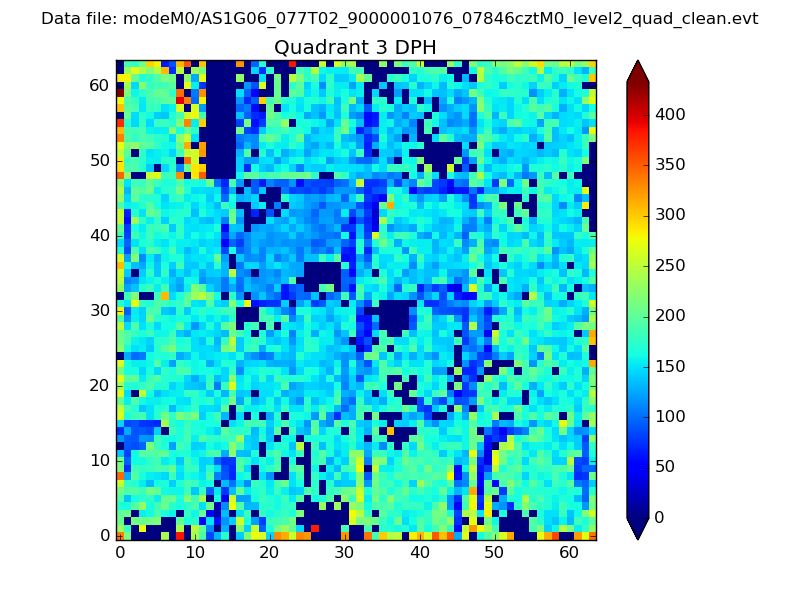 |
 |
Quadrant C |
| Plot type | Count rate plots | Images |
|---|---|---|
| Comparison with Poisson distribution Blue bars denote a histogram of data divided into 1 sec bins. Red curve is a Poisson curve with rate = median count rate of data. |
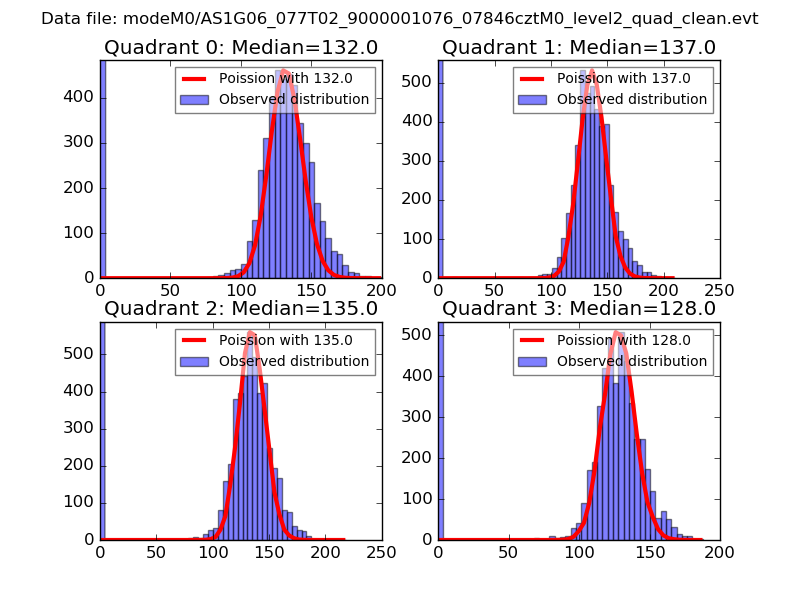 |
 |
| Quadrant-wise count rates Data is divided into 100 sec bins |
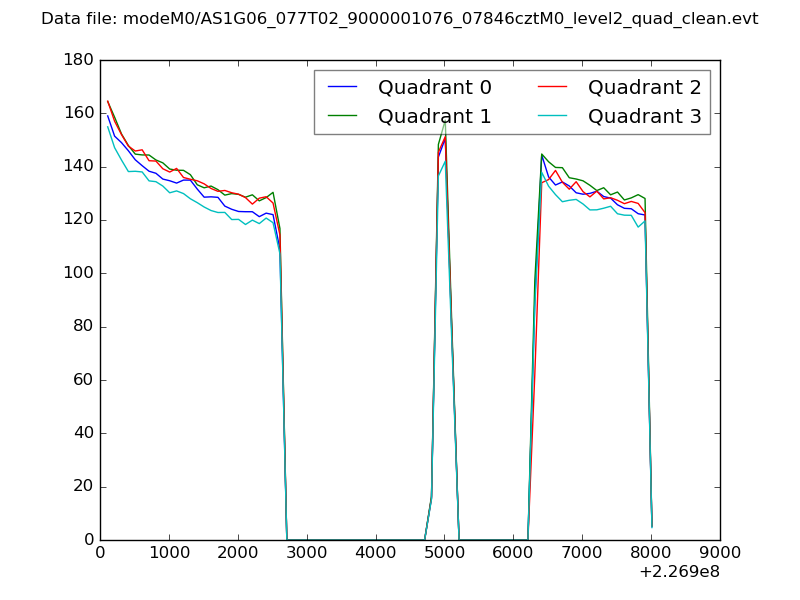 |
|
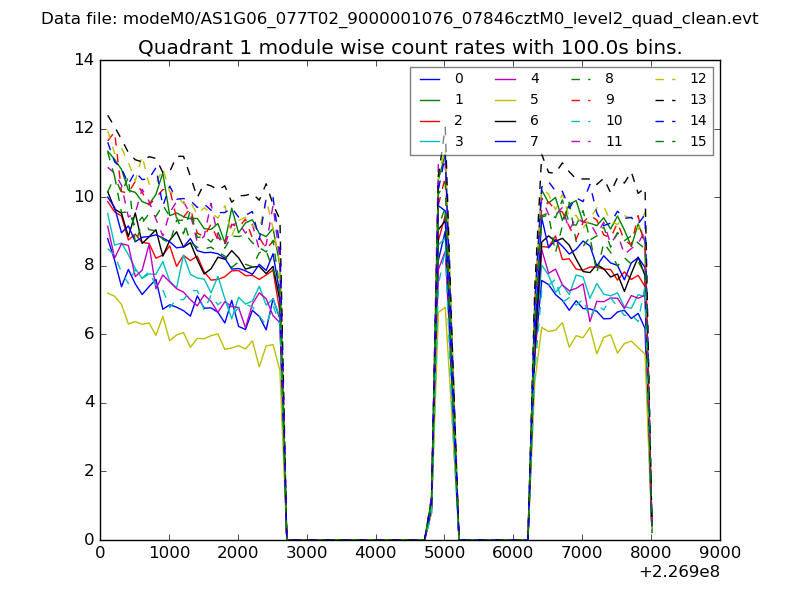
| Module-wise count rates for Quadrant A Data is divided into 100 sec bins |
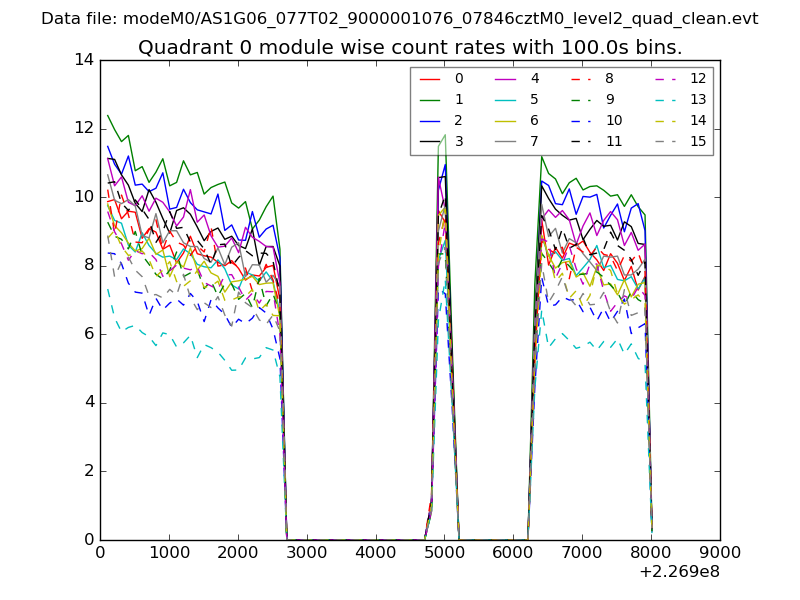 |
 |
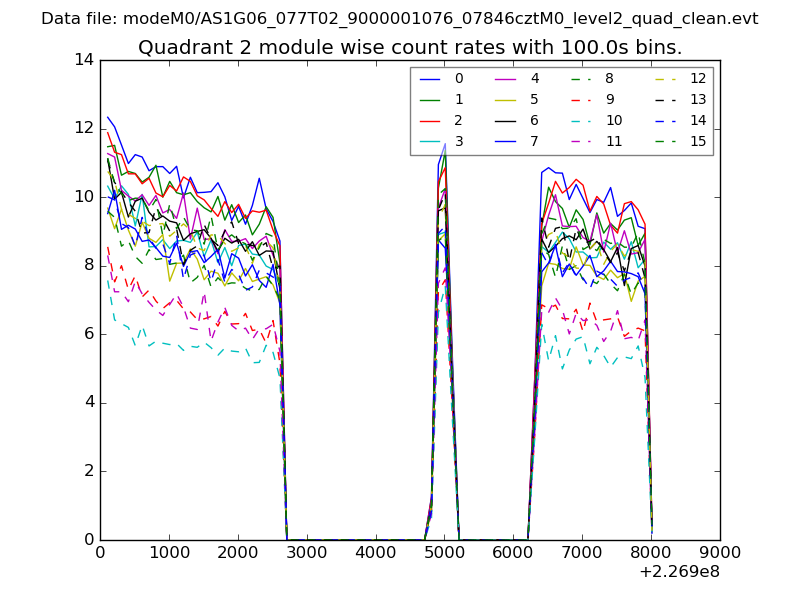
| Module-wise count rates for Quadrant B Data is divided into 100 sec bins |
 |
 |
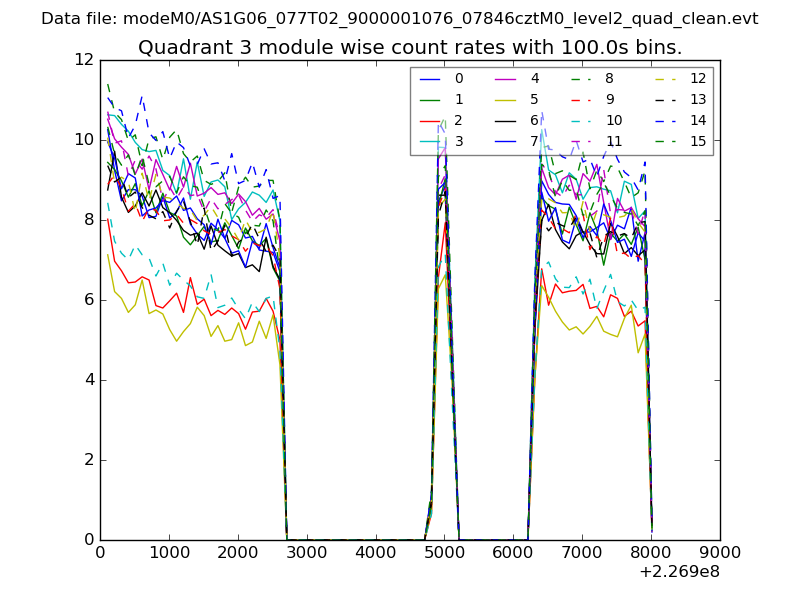
| Module-wise count rates for Quadrant C Data is divided into 100 sec bins |
 |
 |
| Module-wise count rates for Quadrant D Data is divided into 100 sec bins |
 |
 |
| Parameter | Plot |
|---|---|
| CZT HV Monitor | 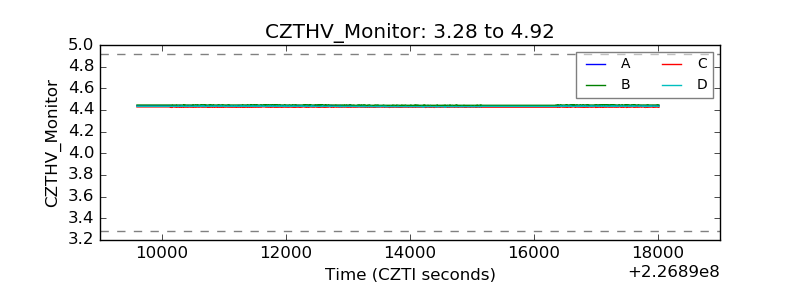 |
| D_VDD | 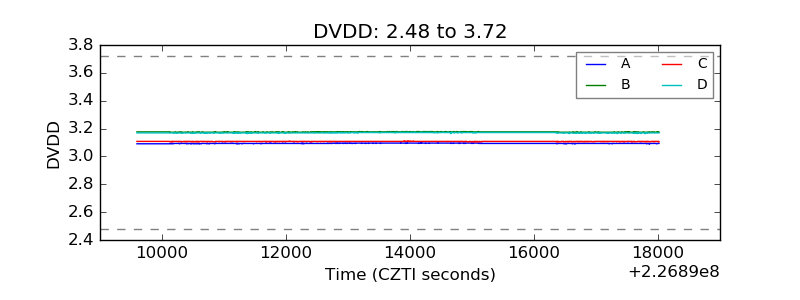 |
| Temperature 1 | 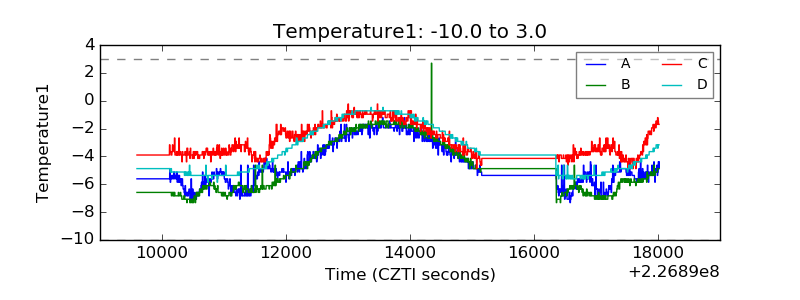 |
| Veto HV Monitor | 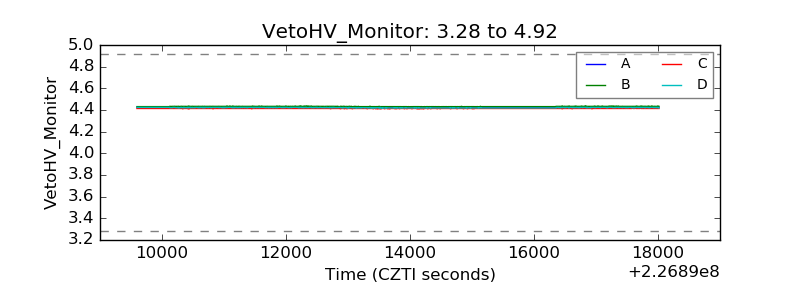 |
| Veto LLD | 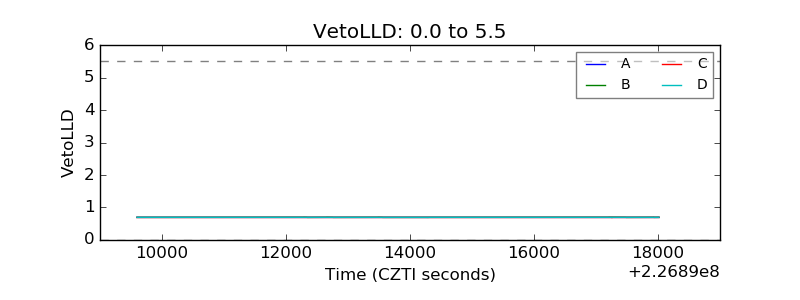 |
| Alpha Counter | 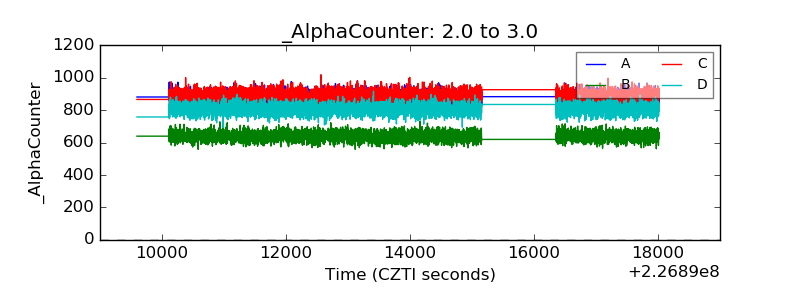 |
| _CPM_Rate | 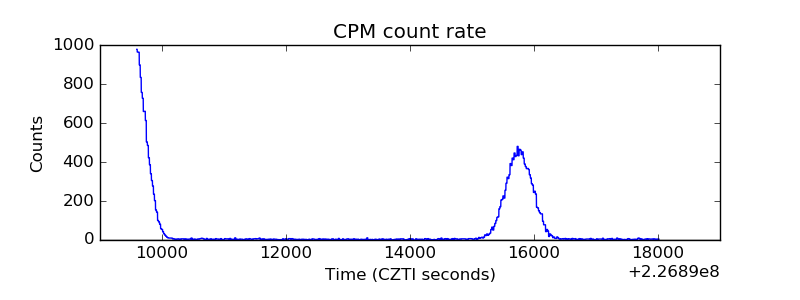 |
| CZT Counter | 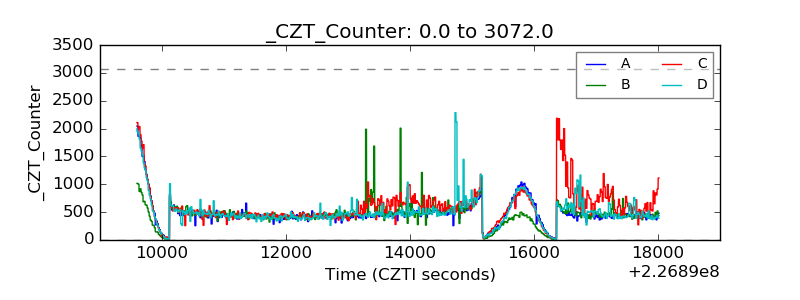 |
| +2.5 Volts monitor |  |
| +5 Volts monitor |  |
| _ROLL_ROT | 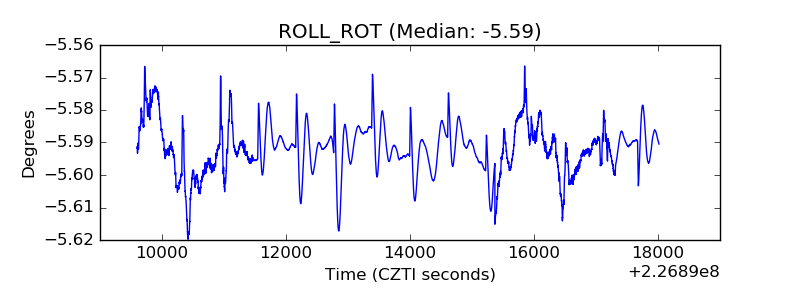 |
| _Roll_DEC | 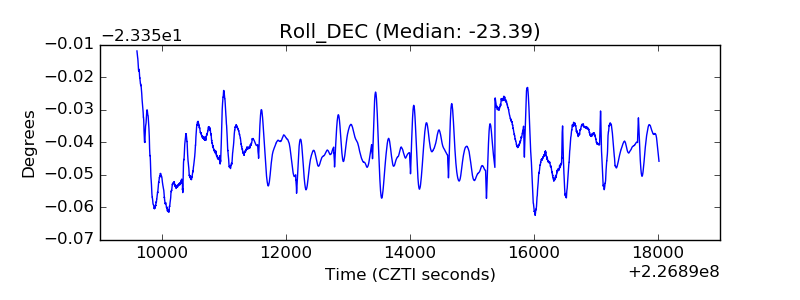 |
| _Roll_RA | 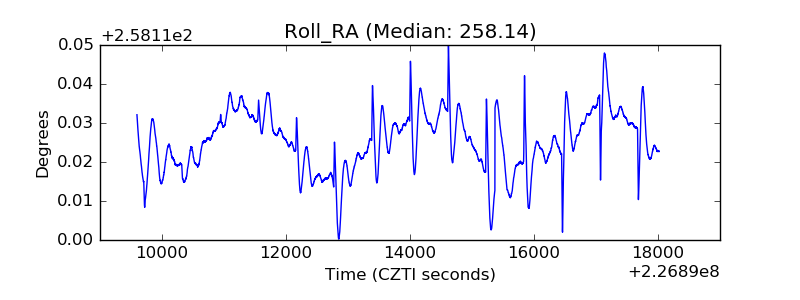 |
| Veto Counter | 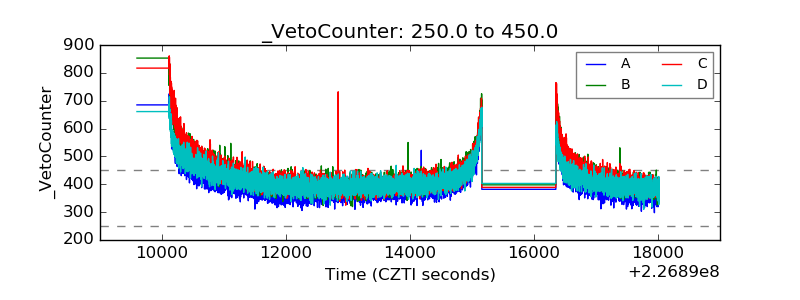 |