| Param | Original file | Final file |
|---|---|---|
| Filename | modeM0/AS1G06_077T02_9000001076_07849cztM0_level2.evt | modeM0/AS1G06_077T02_9000001076_07849cztM0_level2_quad_clean.evt |
| Size (bytes) | 418,838,400 | 76,798,080 |
| Size | 399.4 MB | 73.2 MB |
| Events in quadrant A | 2,743,431 | 473,809 |
| Events in quadrant B | 3,160,753 | 481,828 |
| Events in quadrant C | 2,949,983 | 486,919 |
| Events in quadrant D | 3,422,199 | 463,925 |
| Mode M0 | |||
|---|---|---|---|
| Quadrant | BADHDUFLAG | Total packets | Discarded packets |
| A | 0 | 12265 | 1 |
| B | 0 | 13298 | 4 |
| C | 0 | 12819 | 7 |
| D | 0 | 14348 | 0 |
| Mode SS | |||
|---|---|---|---|
| Quadrant | BADHDUFLAG | Total packets | Discarded packets |
| A | 0 | 120 | 0 |
| B | 0 | 120 | 0 |
| C | 0 | 120 | 0 |
| D | 0 | 120 | 0 |
| Quadrant | Total seconds | Saturated seconds | Saturation percentage |
|---|---|---|---|
| A | 5999 | 114 | 1.900317% |
| B | 5997 | 220 | 3.668501% |
| C | 5996 | 74 | 1.234156% |
| D | 5999 | 325 | 5.417570% |
Noise dominated data is calculated using 1-second bins in cleaned event files. If a bin has >2000 counts, and if more than 50% of those come from <1% of pixels, then it is considered to be noise-dominated and hence unusable.
| Quadrant | # 1 sec bins | Bins with >0 counts | Bins with >2000 counts | High rate bins dominated by noise | Noise dominated (total time) | Noise dominated (detector-on time) | Marked lightcurve |
|---|---|---|---|---|---|---|---|
| A | 5999 | 5999 | 0 | 0 | 0.00% | 0.00% | 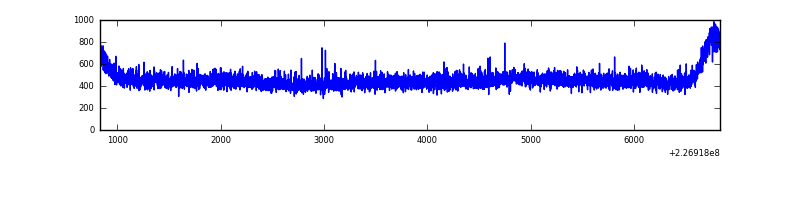 |
| B | 5999 | 5999 | 97 | 97 | 1.62% | 1.62% | 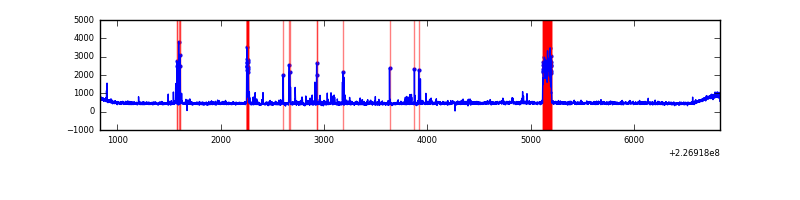 |
| C | 5999 | 5999 | 0 | 0 | 0.00% | 0.00% | 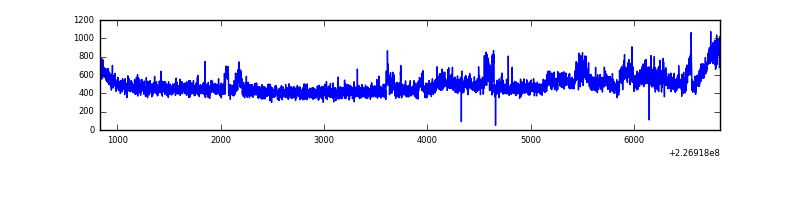 |
| D | 5999 | 5999 | 175 | 175 | 2.92% | 2.92% | 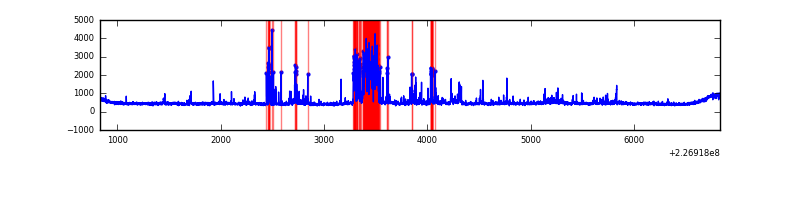 |
Top three noisy pixels from each quadrant. If the there are fewer than three noisy pixels in the level2.evt file, extra rows are filled as -1
| Pixel properties | Quadrant properties | ||||||
|---|---|---|---|---|---|---|---|
| Quadrant | DetID | PixID | Counts | Sigma | Mean | Median | Sigma |
| A | 8 | 15 | 14773 | 97.92 | 703 | 687 | 143.8 |
| A | 3 | 1 | 10749 | 69.95 | 703 | 687 | 143.8 |
| A | 15 | 239 | 6714 | 41.9 | 703 | 687 | 143.8 |
| B | 4 | 239 | 274392 | 2024.17 | 705 | 687 | 135.2 |
| B | 4 | 173 | 79970 | 586.33 | 705 | 687 | 135.2 |
| B | 0 | 214 | 20133 | 143.81 | 705 | 687 | 135.2 |
| C | 1 | 16 | 198058 | 1227.75 | 696 | 700 | 160.7 |
| C | 7 | 237 | 19777 | 118.68 | 696 | 700 | 160.7 |
| C | 8 | 229 | 16738 | 99.77 | 696 | 700 | 160.7 |
| D | 13 | 137 | 581404 | 3448.34 | 679 | 658 | 168.4 |
| D | 2 | 152 | 91346 | 538.48 | 679 | 658 | 168.4 |
| D | 12 | 233 | 66863 | 393.11 | 679 | 658 | 168.4 |
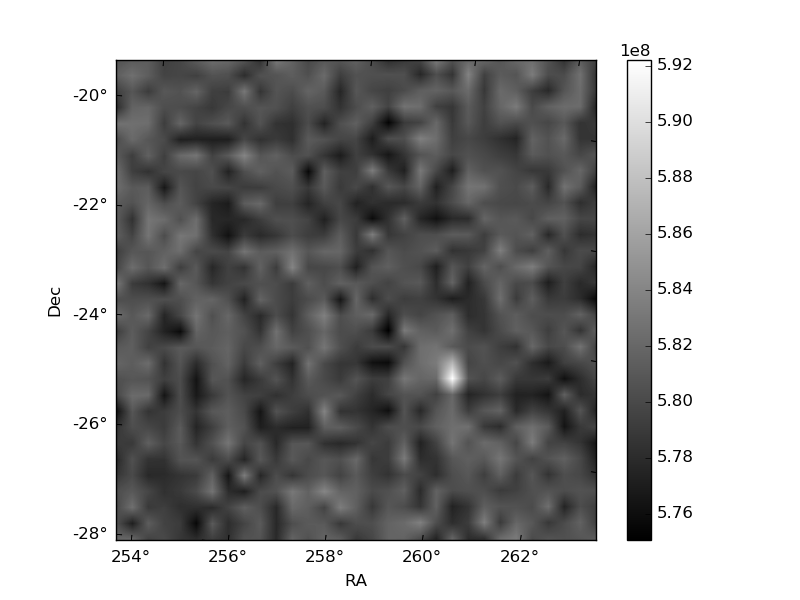
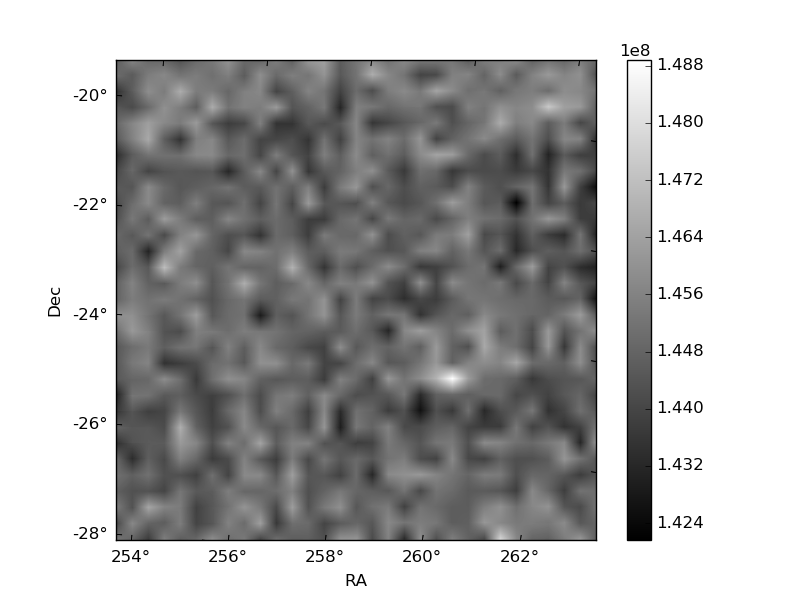
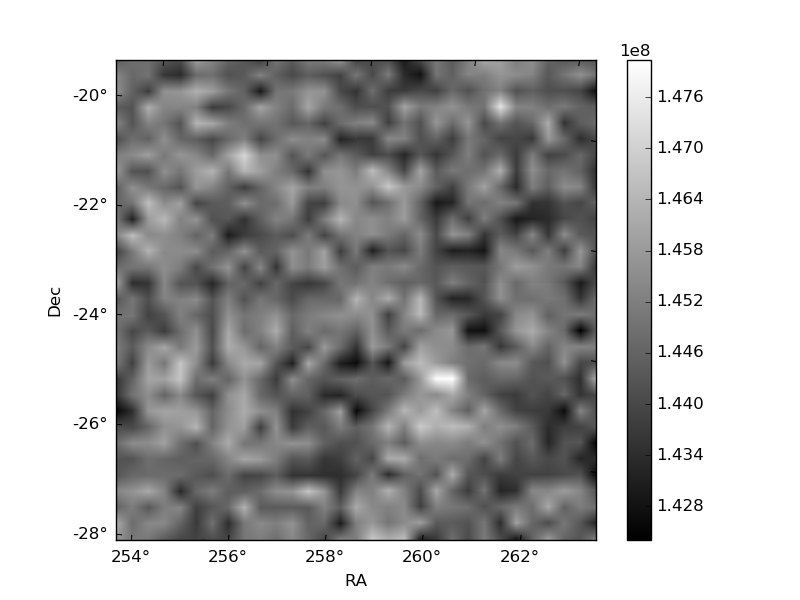
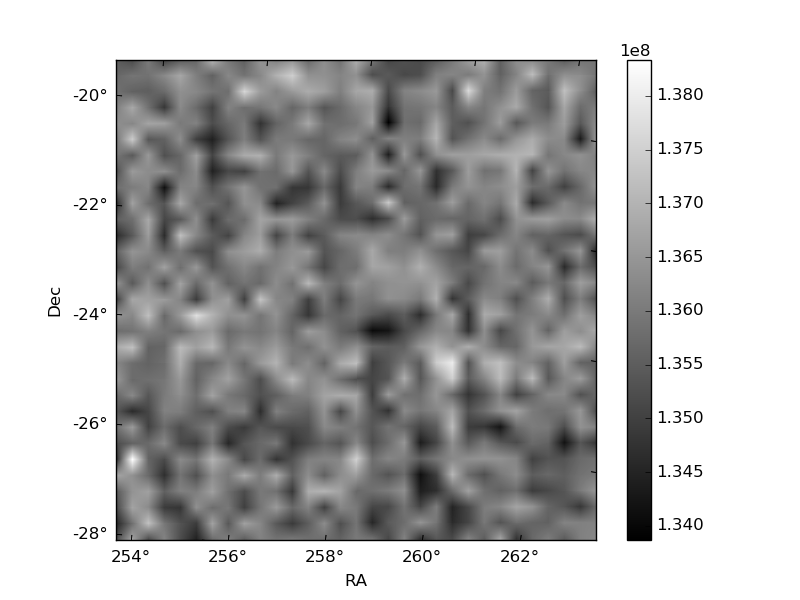
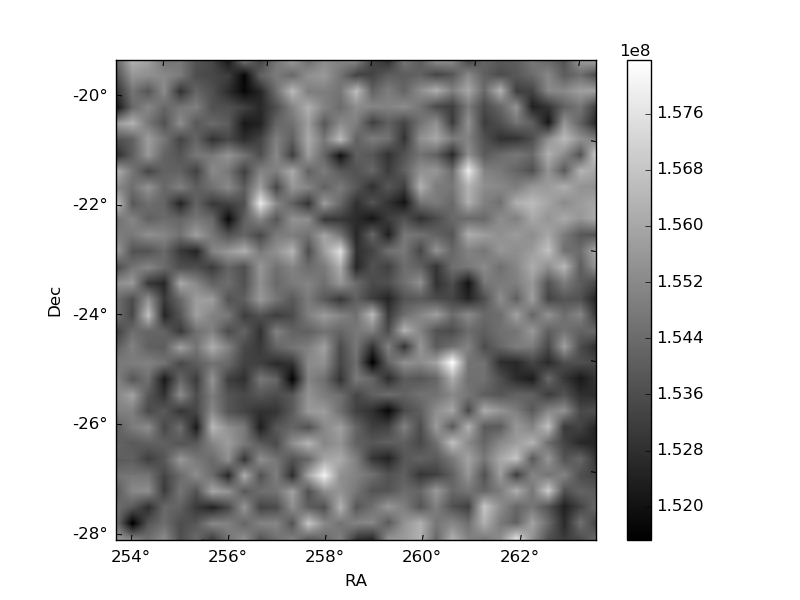
Histogram calculated using DETX and DETY for each event in the final _common_clean file
| Quadrant A | 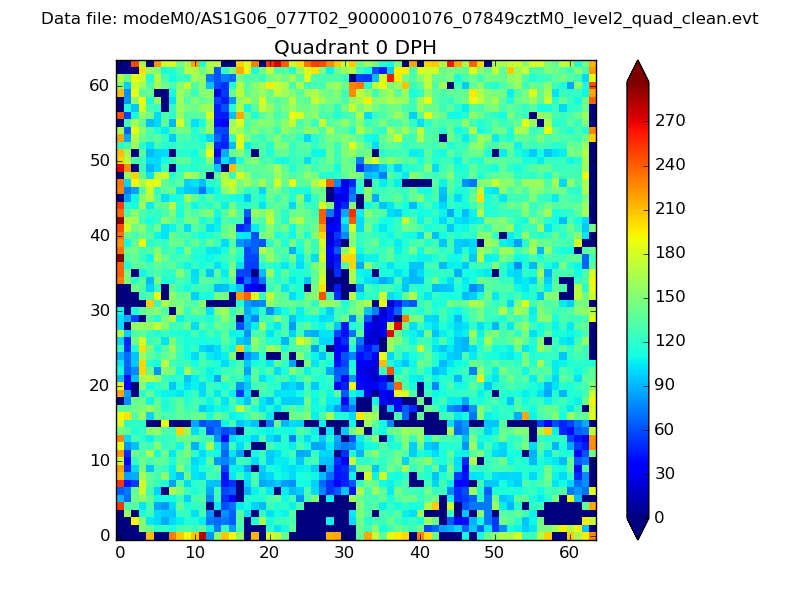 |
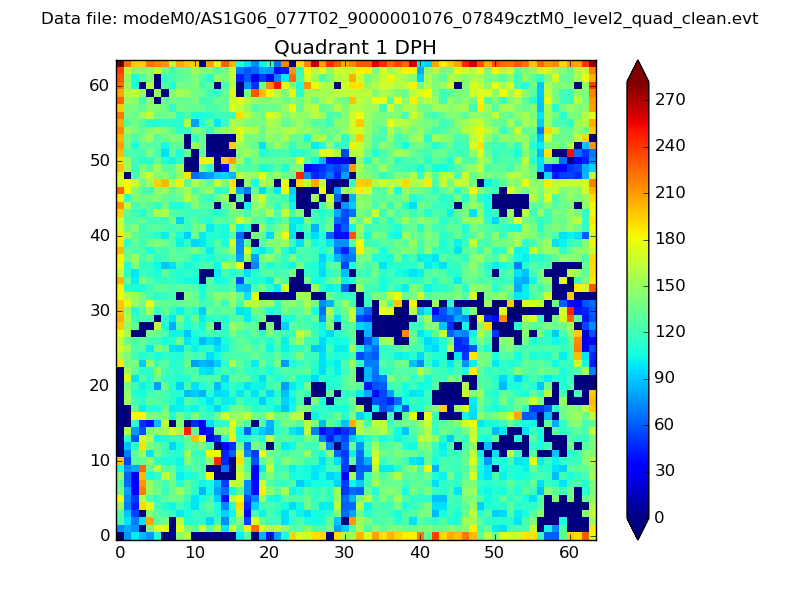 |
Quadrant B |
|---|---|---|---|
| Quadrant D | 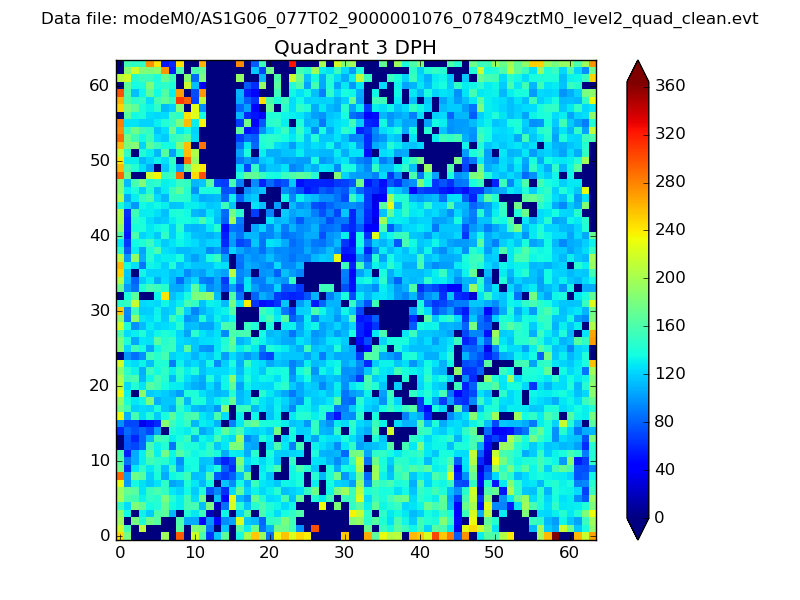 |
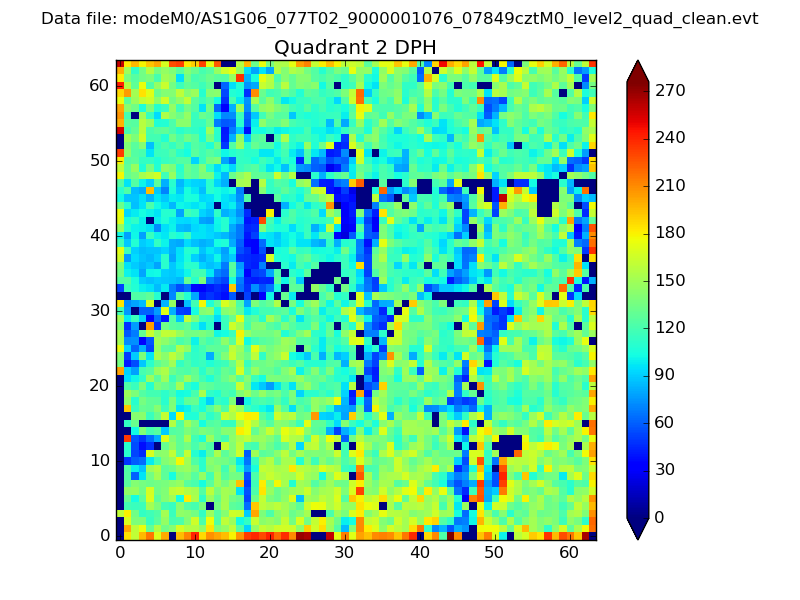 |
Quadrant C |
| Plot type | Count rate plots | Images |
|---|---|---|
| Comparison with Poisson distribution Blue bars denote a histogram of data divided into 1 sec bins. Red curve is a Poisson curve with rate = median count rate of data. |
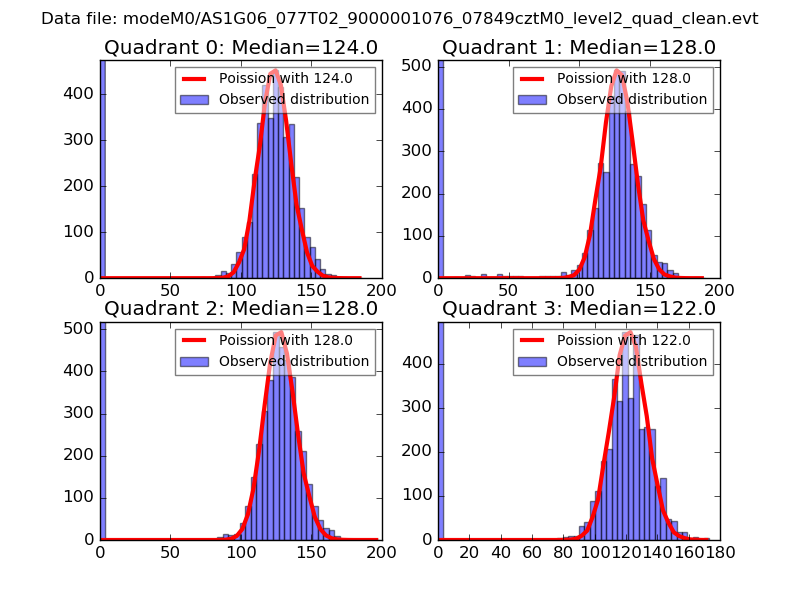 |
 |
| Quadrant-wise count rates Data is divided into 100 sec bins |
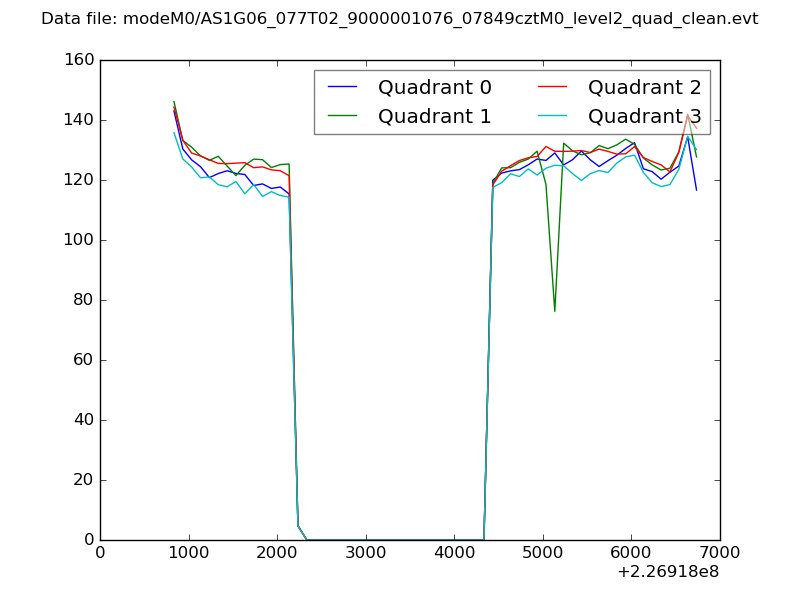 |
|
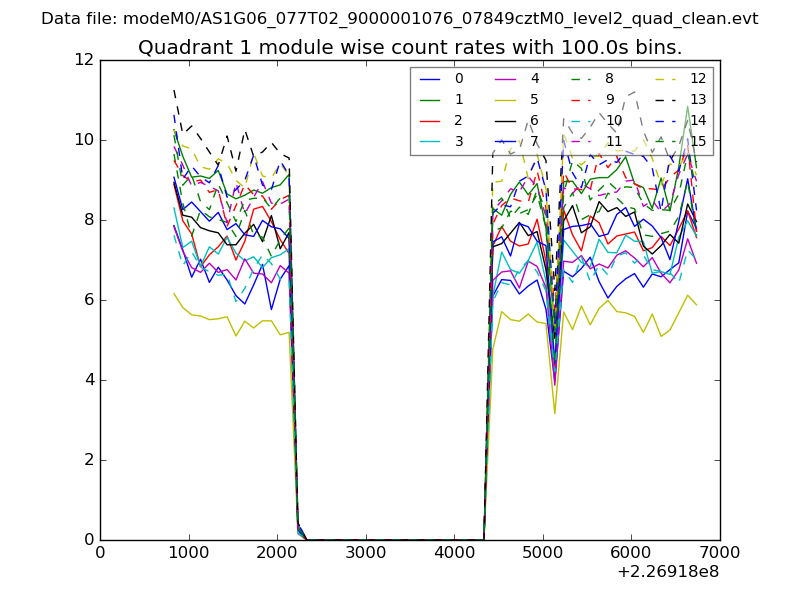
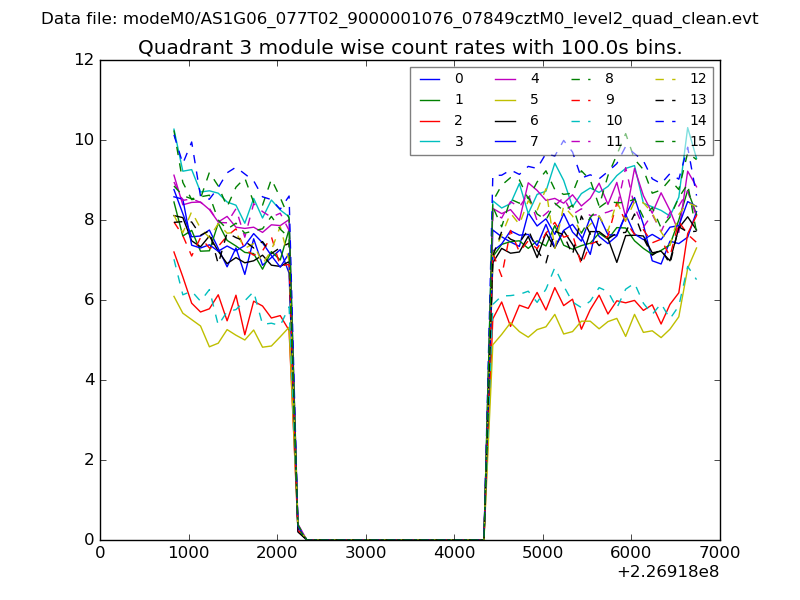
| Module-wise count rates for Quadrant A Data is divided into 100 sec bins |
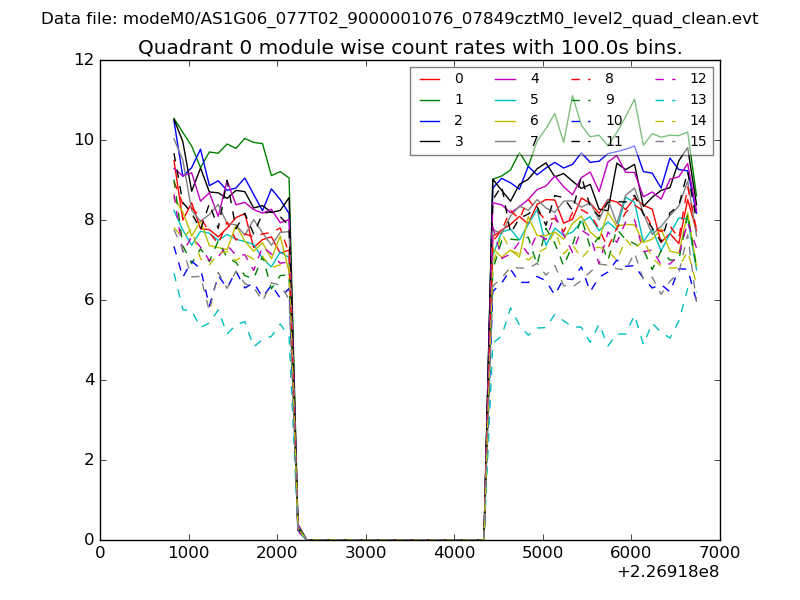 |
 |
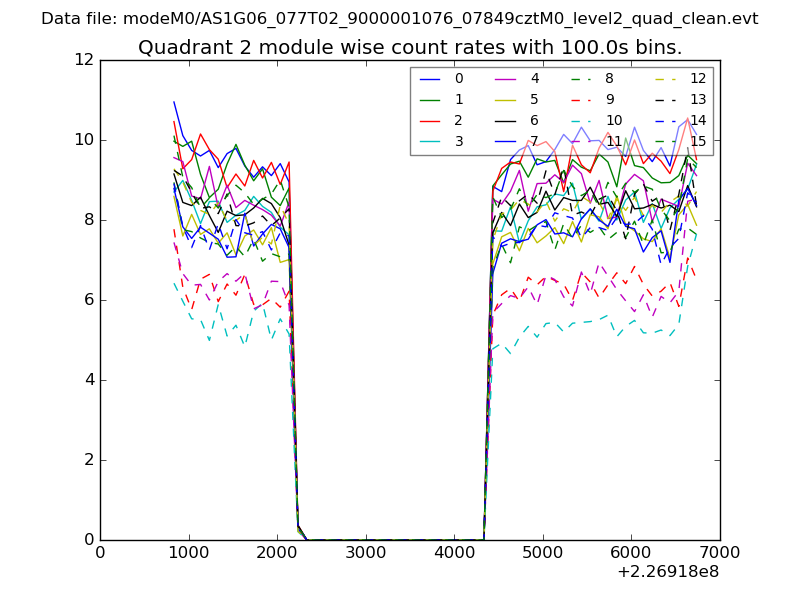
| Module-wise count rates for Quadrant B Data is divided into 100 sec bins |
 |
 |
| Module-wise count rates for Quadrant C Data is divided into 100 sec bins |
 |
 |
| Module-wise count rates for Quadrant D Data is divided into 100 sec bins |
 |
 |
| Parameter | Plot |
|---|---|
| CZT HV Monitor | 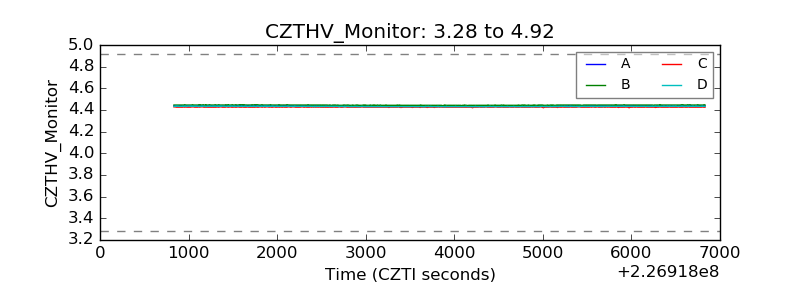 |
| D_VDD | 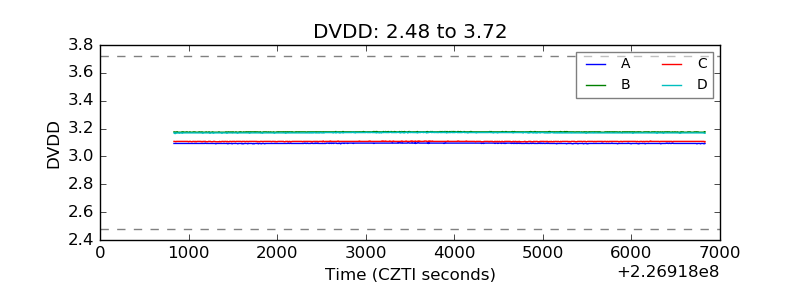 |
| Temperature 1 | 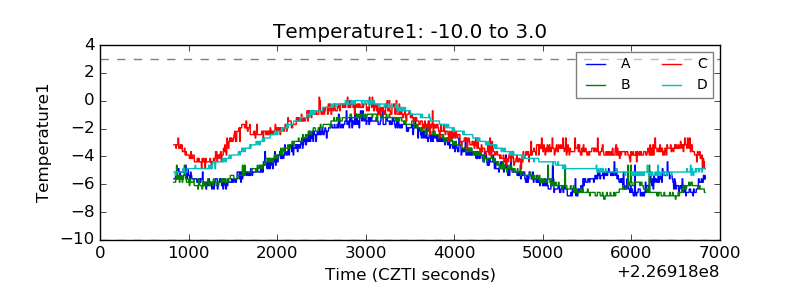 |
| Veto HV Monitor | 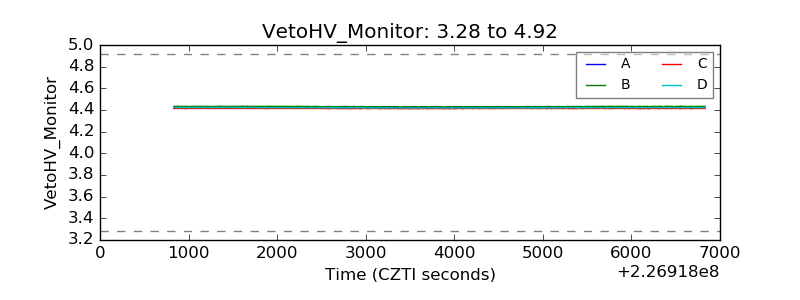 |
| Veto LLD | 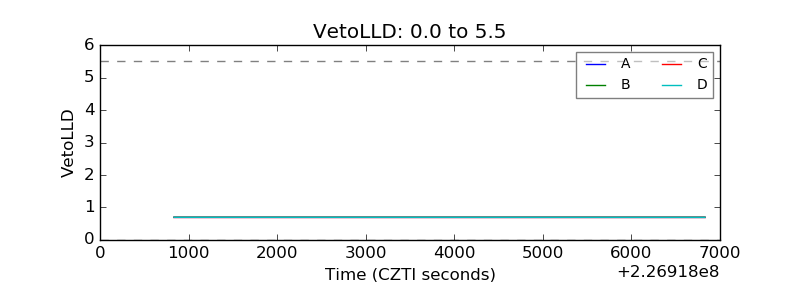 |
| Alpha Counter | 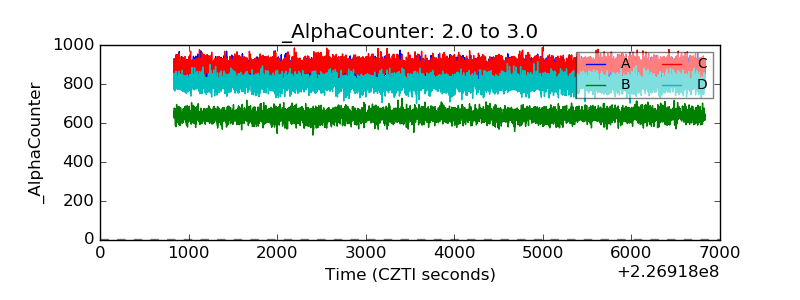 |
| _CPM_Rate | 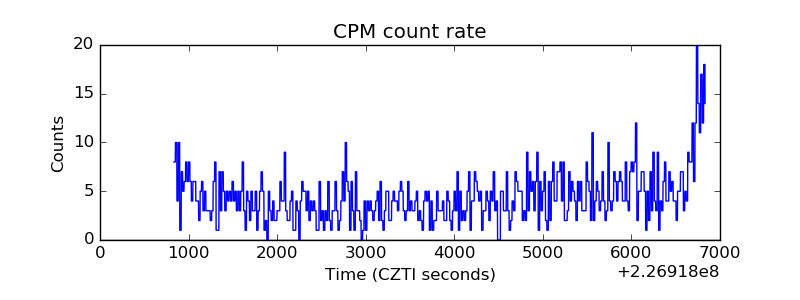 |
| CZT Counter | 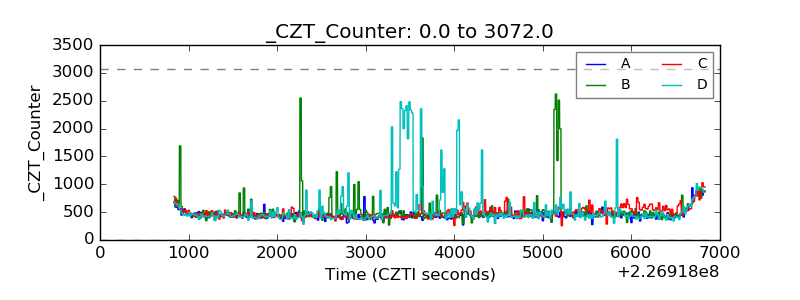 |
| +2.5 Volts monitor | 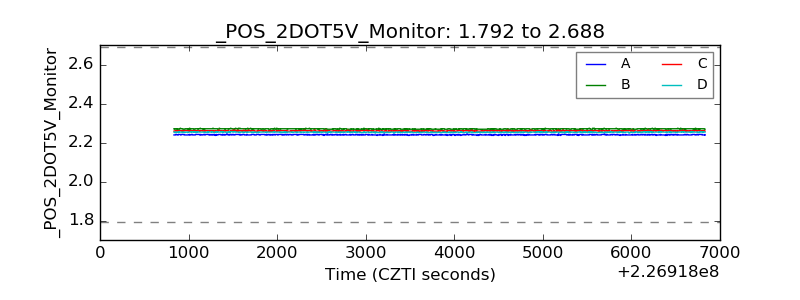 |
| +5 Volts monitor |  |
| _ROLL_ROT | 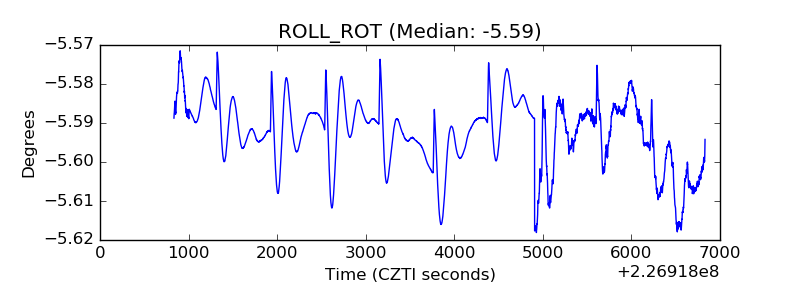 |
| _Roll_DEC | 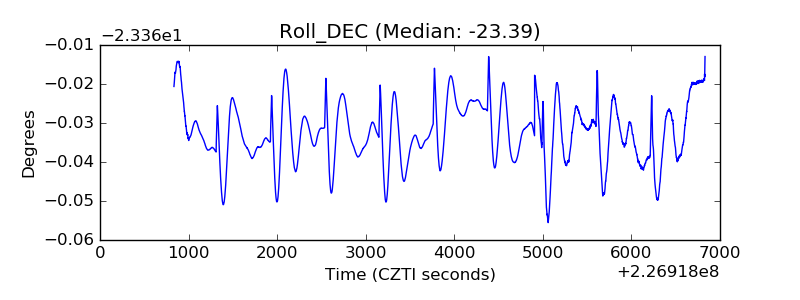 |
| _Roll_RA | 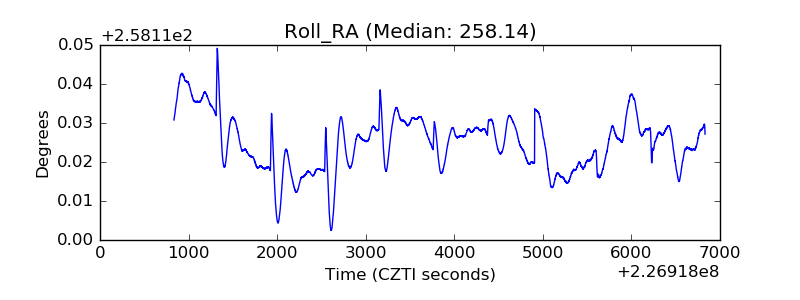 |
| Veto Counter | 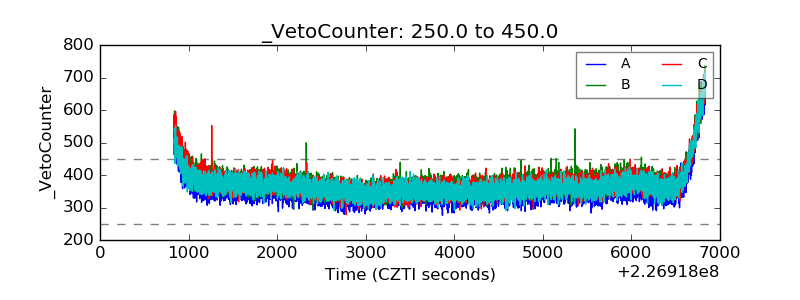 |