| Param | Original file | Final file |
|---|---|---|
| Filename | modeM0/AS1G06_077T02_9000001076_07853cztM0_level2.evt | modeM0/AS1G06_077T02_9000001076_07853cztM0_level2_quad_clean.evt |
| Size (bytes) | 1,708,367,040 | 296,210,880 |
| Size | 1.6 GB | 282.5 MB |
| Events in quadrant A | 11,252,348 | 1,825,285 |
| Events in quadrant B | 13,446,218 | 1,843,711 |
| Events in quadrant C | 11,916,842 | 1,857,148 |
| Events in quadrant D | 13,465,014 | 1,757,621 |
| Mode M9 | |||
|---|---|---|---|
| Quadrant | BADHDUFLAG | Total packets | Discarded packets |
| A | 0 | 22 | 0 |
| B | 0 | 22 | 0 |
| C | 0 | 22 | 0 |
| D | 0 | 22 | 0 |
| Mode M0 | |||
|---|---|---|---|
| Quadrant | BADHDUFLAG | Total packets | Discarded packets |
| A | 0 | 50412 | 7 |
| B | 0 | 56113 | 4 |
| C | 0 | 52236 | 4 |
| D | 0 | 56770 | 4 |
| Mode SS | |||
|---|---|---|---|
| Quadrant | BADHDUFLAG | Total packets | Discarded packets |
| A | 0 | 496 | 0 |
| B | 0 | 496 | 0 |
| C | 0 | 496 | 0 |
| D | 0 | 496 | 0 |
| Quadrant | Total seconds | Saturated seconds | Saturation percentage |
|---|---|---|---|
| A | 24533 | 444 | 1.809807% |
| B | 24534 | 1062 | 4.328687% |
| C | 24534 | 336 | 1.369528% |
| D | 24534 | 662 | 2.698296% |
Noise dominated data is calculated using 1-second bins in cleaned event files. If a bin has >2000 counts, and if more than 50% of those come from <1% of pixels, then it is considered to be noise-dominated and hence unusable.
| Quadrant | # 1 sec bins | Bins with >0 counts | Bins with >2000 counts | High rate bins dominated by noise | Noise dominated (total time) | Noise dominated (detector-on time) | Marked lightcurve |
|---|---|---|---|---|---|---|---|
| A | 26619 | 24539 | 4 | 4 | 0.02% | 0.02% | 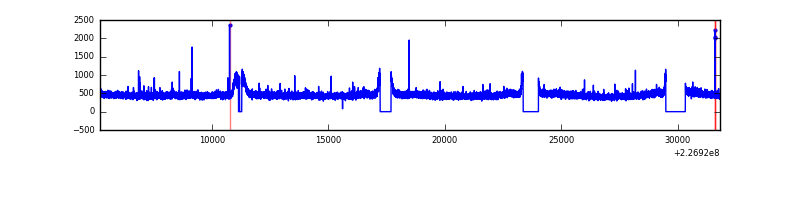 |
| B | 26619 | 24539 | 457 | 457 | 1.72% | 1.86% | 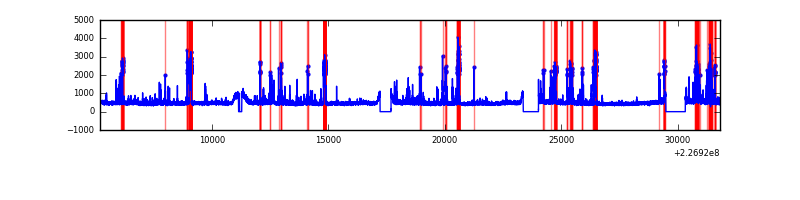 |
| C | 26619 | 24539 | 0 | 0 | 0.00% | 0.00% | 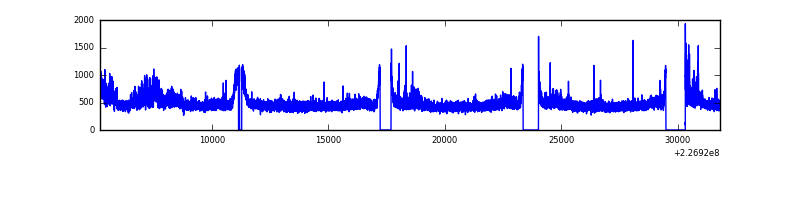 |
| D | 26619 | 24539 | 202 | 202 | 0.76% | 0.82% | 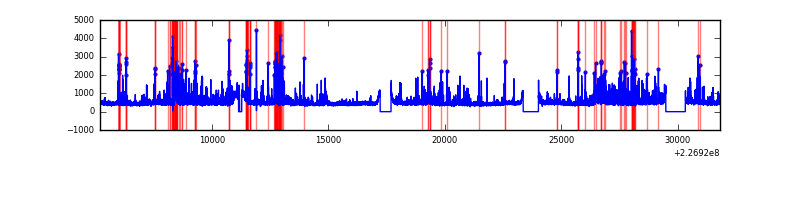 |
Top three noisy pixels from each quadrant. If the there are fewer than three noisy pixels in the level2.evt file, extra rows are filled as -1
| Pixel properties | Quadrant properties | ||||||
|---|---|---|---|---|---|---|---|
| Quadrant | DetID | PixID | Counts | Sigma | Mean | Median | Sigma |
| A | 15 | 174 | 30136 | 46.52 | 2906 | 2843 | 586.7 |
| A | 0 | 226 | 27679 | 42.34 | 2906 | 2843 | 586.7 |
| A | 12 | 194 | 25832 | 39.19 | 2906 | 2843 | 586.7 |
| B | 4 | 239 | 1573173 | 2821.02 | 2901 | 2827 | 556.7 |
| B | 4 | 173 | 204902 | 363.01 | 2901 | 2827 | 556.7 |
| B | 11 | 51 | 103124 | 180.18 | 2901 | 2827 | 556.7 |
| C | 1 | 16 | 742667 | 1120.94 | 2855 | 2875 | 660.0 |
| C | 8 | 229 | 29347 | 40.11 | 2855 | 2875 | 660.0 |
| C | 13 | 61 | 22030 | 29.02 | 2855 | 2875 | 660.0 |
| D | 1 | 52 | 739626 | 1056.88 | 2840 | 2754 | 697.2 |
| D | 2 | 152 | 458822 | 654.13 | 2840 | 2754 | 697.2 |
| D | 12 | 233 | 450446 | 642.11 | 2840 | 2754 | 697.2 |
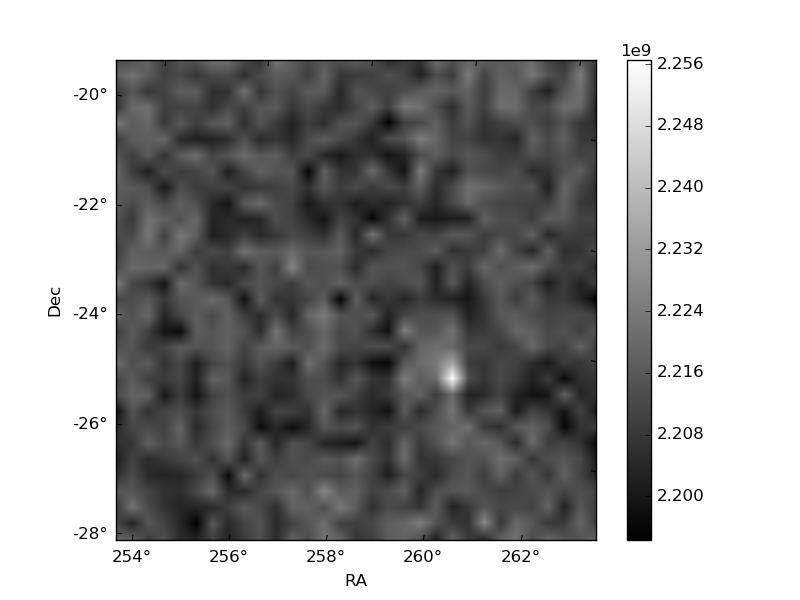
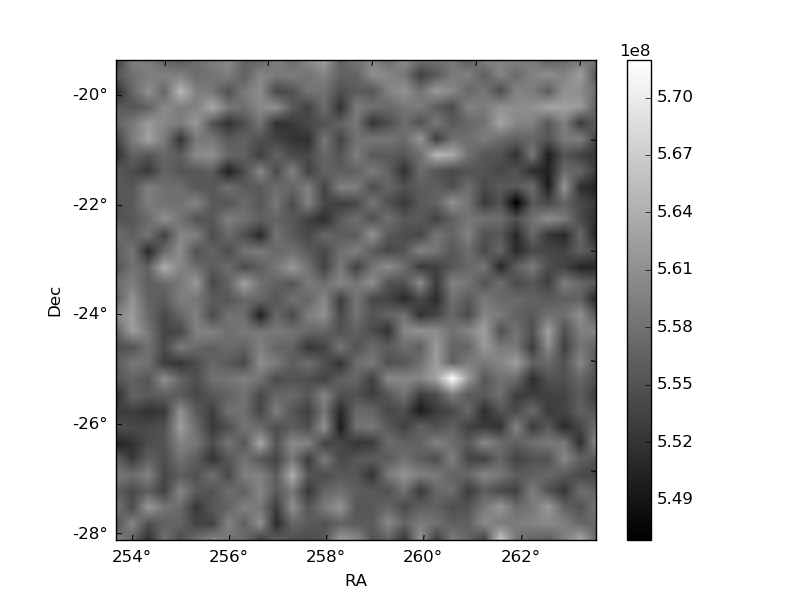
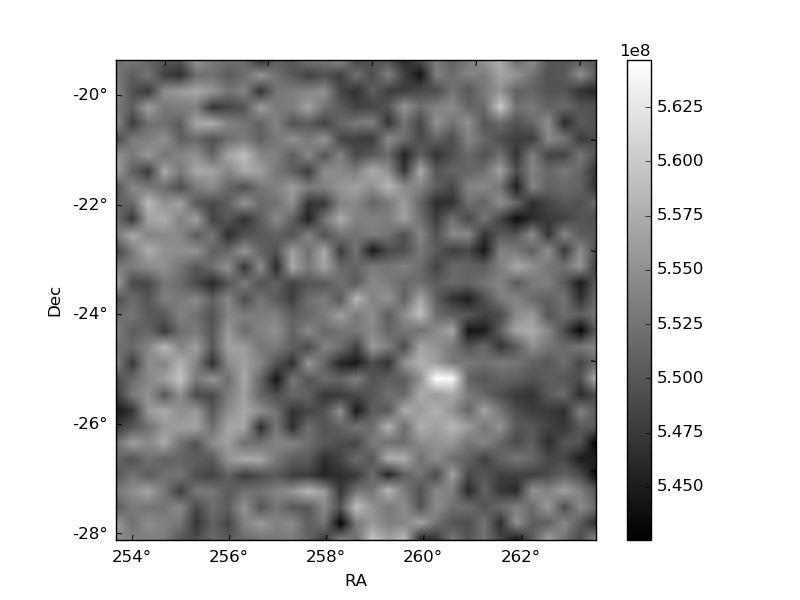
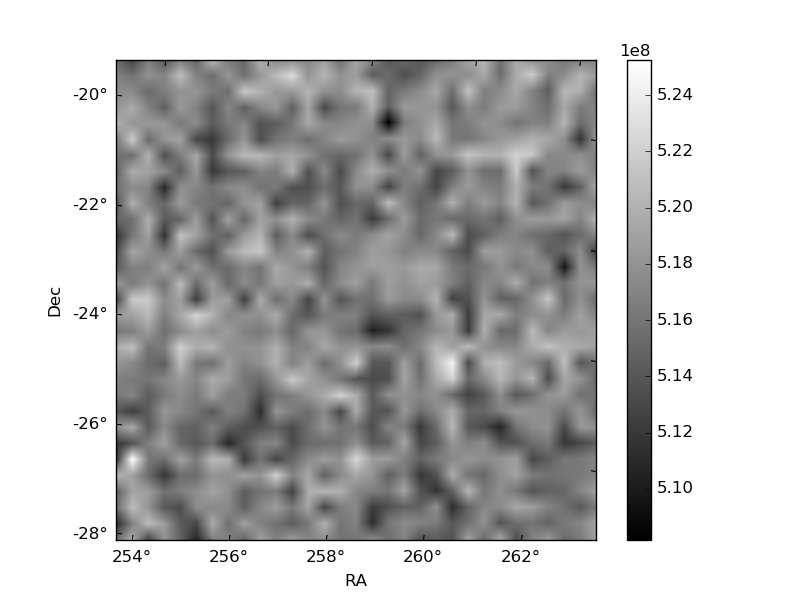
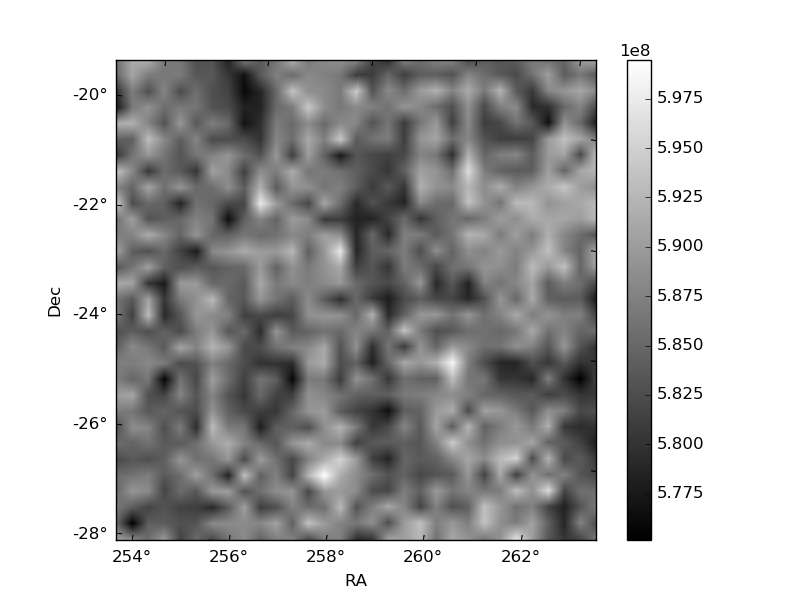
Histogram calculated using DETX and DETY for each event in the final _common_clean file
| Quadrant A | 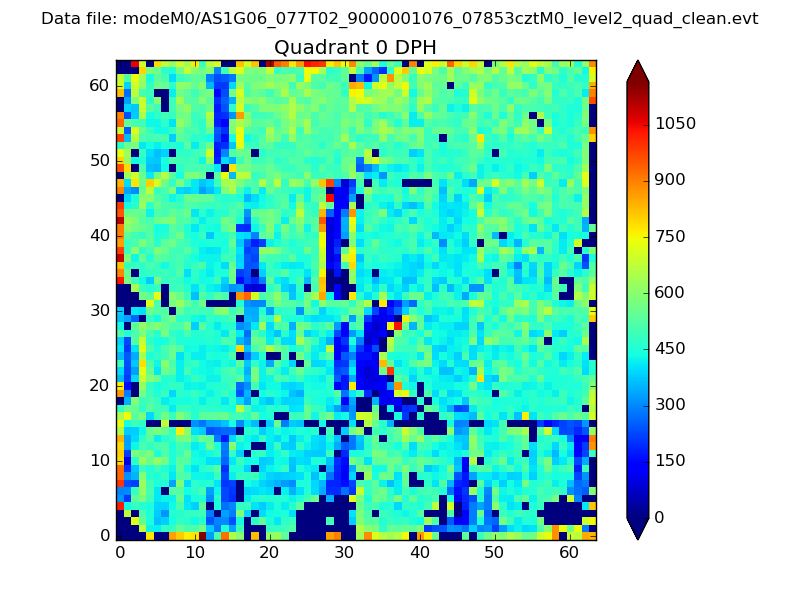 |
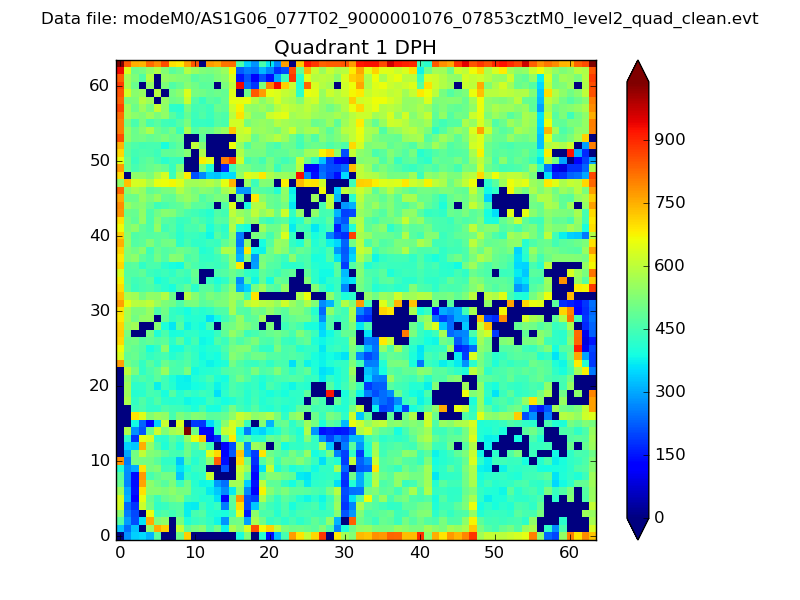 |
Quadrant B |
|---|---|---|---|
| Quadrant D | 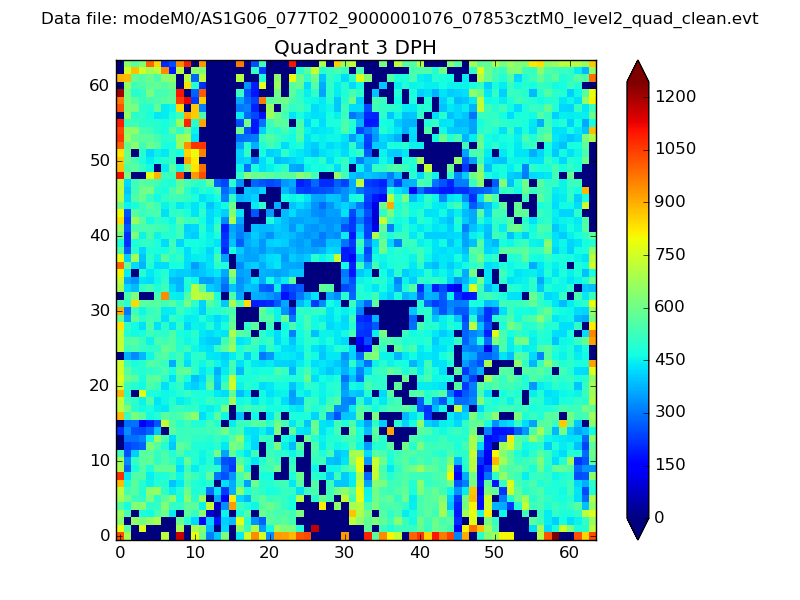 |
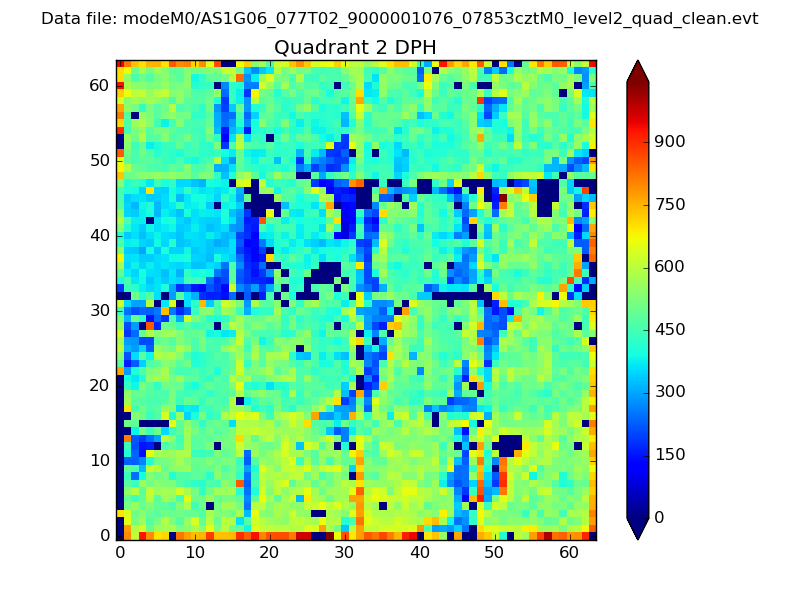 |
Quadrant C |
| Plot type | Count rate plots | Images |
|---|---|---|
| Comparison with Poisson distribution Blue bars denote a histogram of data divided into 1 sec bins. Red curve is a Poisson curve with rate = median count rate of data. |
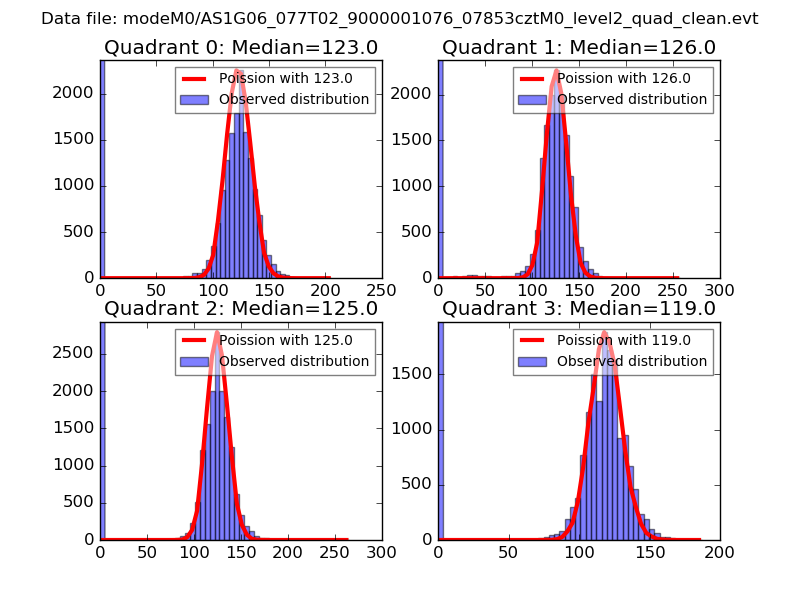 |
 |
| Quadrant-wise count rates Data is divided into 100 sec bins |
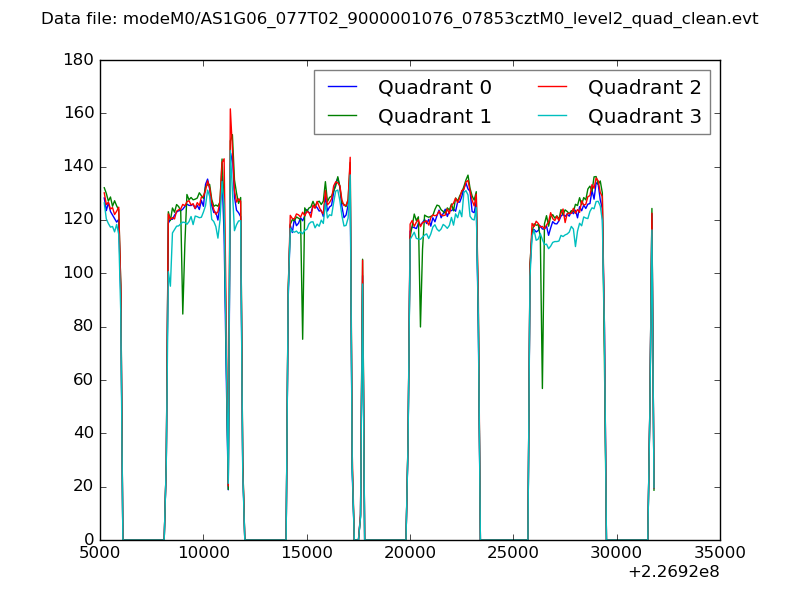 |
|
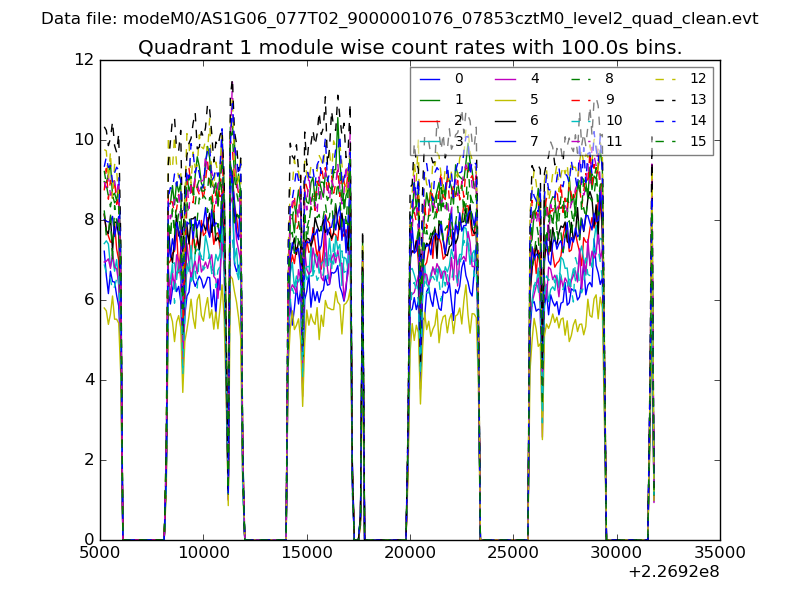
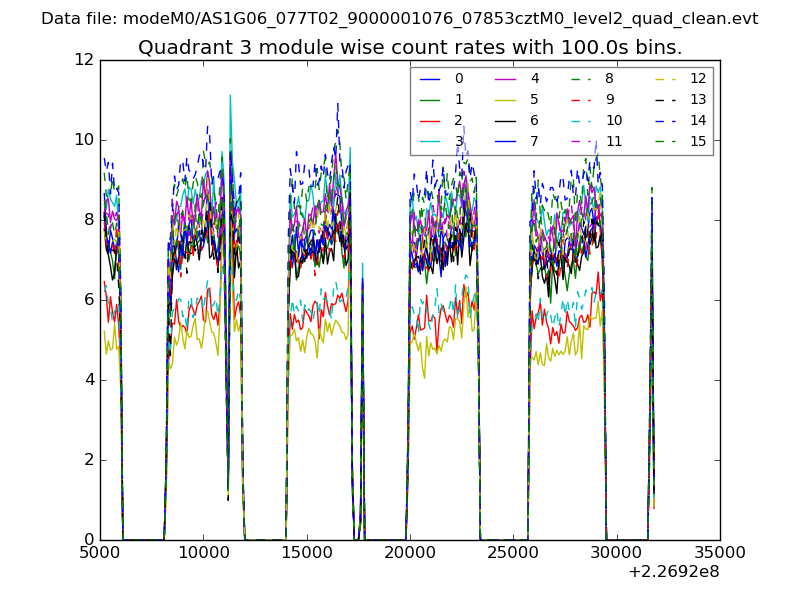
| Module-wise count rates for Quadrant A Data is divided into 100 sec bins |
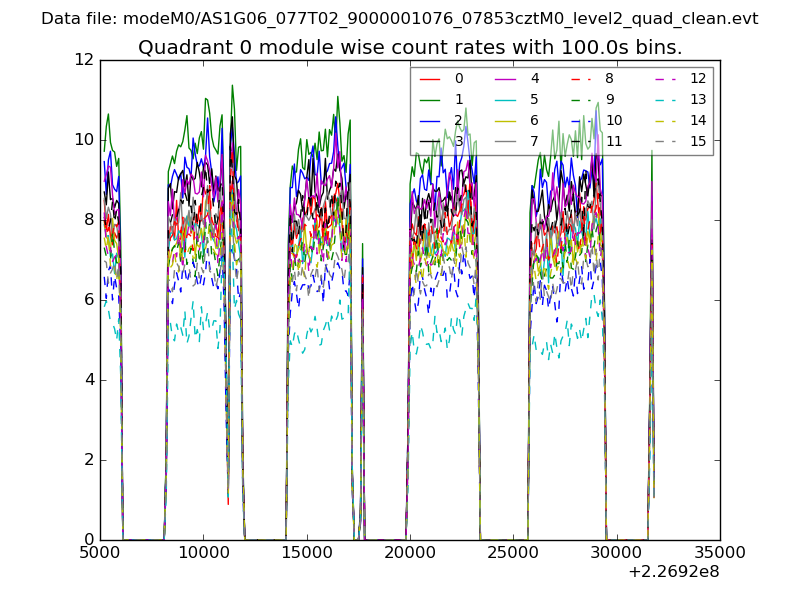 |
 |
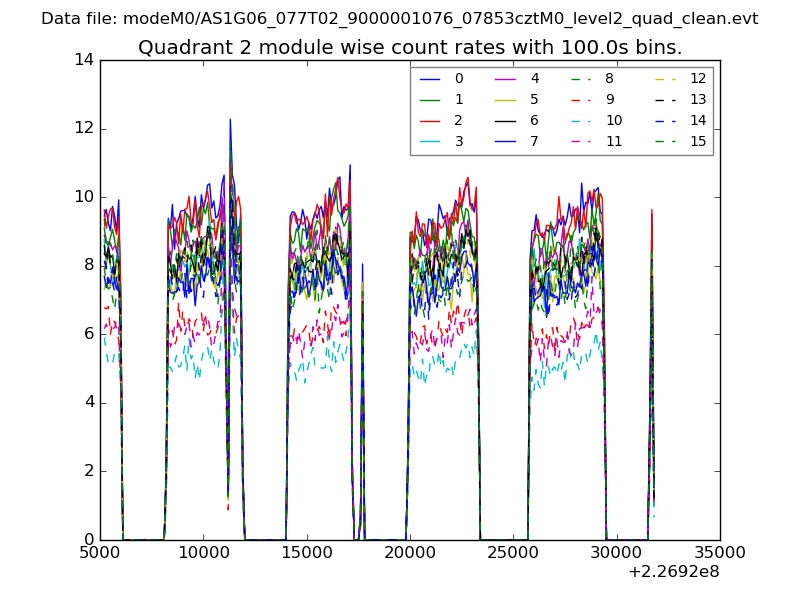
| Module-wise count rates for Quadrant B Data is divided into 100 sec bins |
 |
 |
| Module-wise count rates for Quadrant C Data is divided into 100 sec bins |
 |
 |
| Module-wise count rates for Quadrant D Data is divided into 100 sec bins |
 |
 |
| Parameter | Plot |
|---|---|
| CZT HV Monitor | 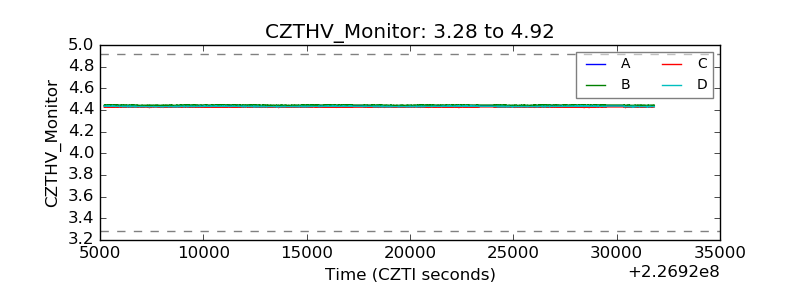 |
| D_VDD |  |
| Temperature 1 | 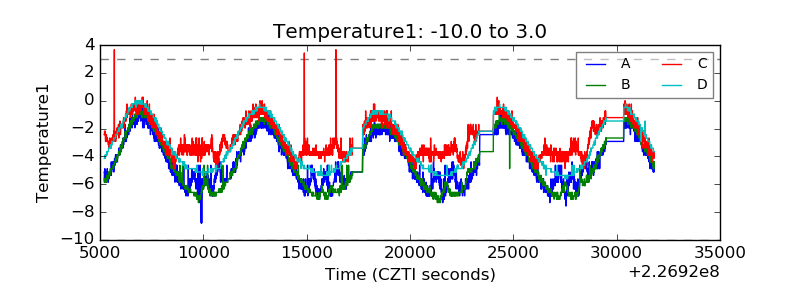 |
| Veto HV Monitor | 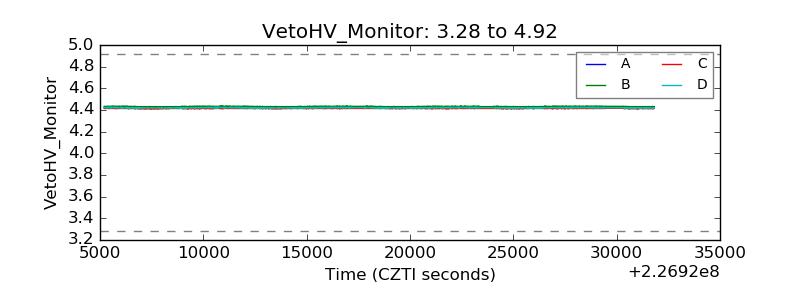 |
| Veto LLD | 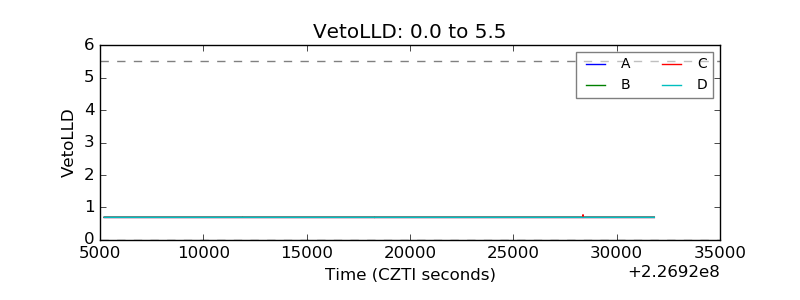 |
| Alpha Counter | 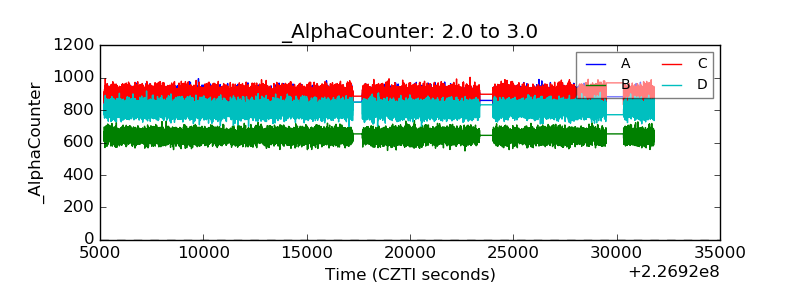 |
| _CPM_Rate | 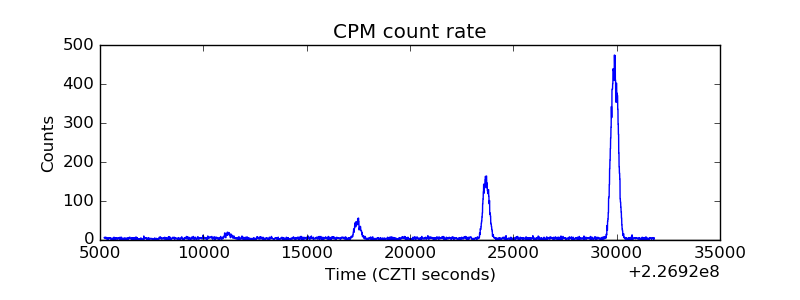 |
| CZT Counter | 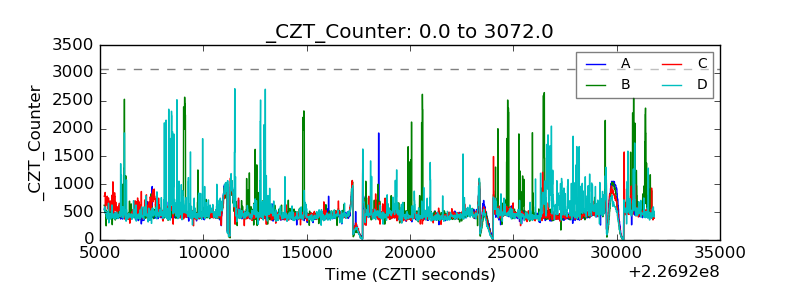 |
| +2.5 Volts monitor |  |
| +5 Volts monitor |  |
| _ROLL_ROT | 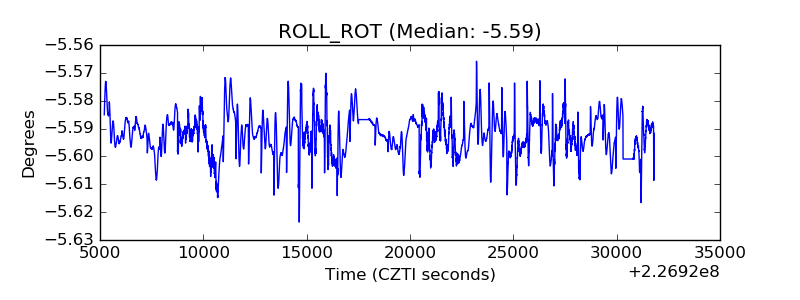 |
| _Roll_DEC | 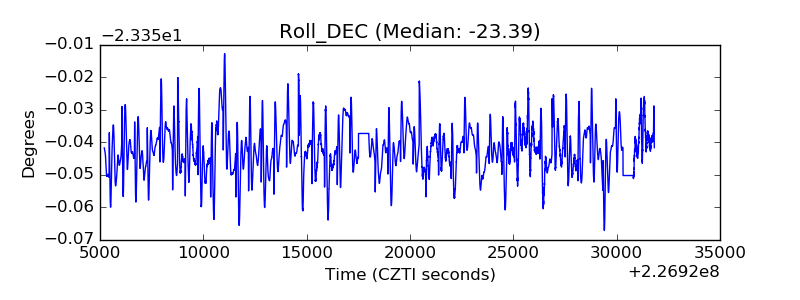 |
| _Roll_RA | 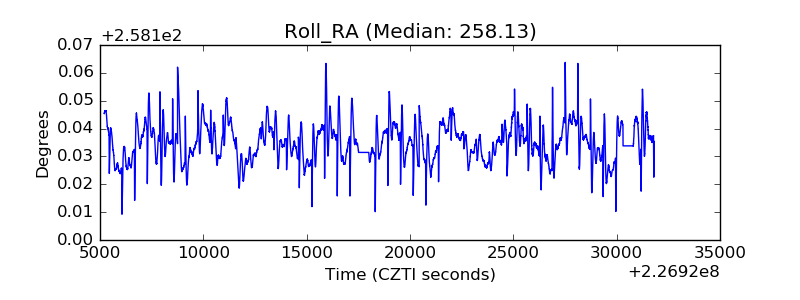 |
| Veto Counter | 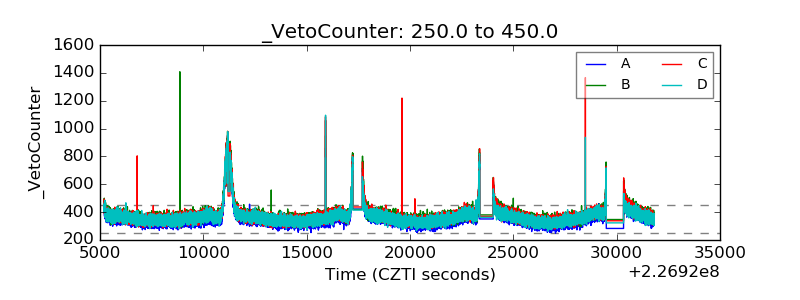 |