| Param | Original file | Final file |
|---|---|---|
| Filename | modeM0/AS1G06_077T02_9000001076_07854cztM0_level2.evt | modeM0/AS1G06_077T02_9000001076_07854cztM0_level2_quad_clean.evt |
| Size (bytes) | 3,230,749,440 | 568,886,400 |
| Size | 3.0 GB | 542.5 MB |
| Events in quadrant A | 21,175,747 | 3,518,617 |
| Events in quadrant B | 24,919,790 | 3,571,993 |
| Events in quadrant C | 23,296,973 | 3,587,887 |
| Events in quadrant D | 25,355,230 | 3,403,734 |
| Mode M9 | |||
|---|---|---|---|
| Quadrant | BADHDUFLAG | Total packets | Discarded packets |
| A | 0 | 45 | 0 |
| B | 0 | 45 | 0 |
| C | 0 | 45 | 0 |
| D | 0 | 45 | 0 |
| Mode M0 | |||
|---|---|---|---|
| Quadrant | BADHDUFLAG | Total packets | Discarded packets |
| A | 0 | 94433 | 9 |
| B | 0 | 104244 | 8 |
| C | 0 | 100484 | 8 |
| D | 0 | 106906 | 8 |
| Mode SS | |||
|---|---|---|---|
| Quadrant | BADHDUFLAG | Total packets | Discarded packets |
| A | 0 | 928 | 0 |
| B | 0 | 928 | 0 |
| C | 0 | 928 | 0 |
| D | 0 | 928 | 0 |
| Quadrant | Total seconds | Saturated seconds | Saturation percentage |
|---|---|---|---|
| A | 45867 | 990 | 2.158415% |
| B | 45867 | 1996 | 4.351713% |
| C | 45867 | 770 | 1.678767% |
| D | 45867 | 1599 | 3.486167% |
Noise dominated data is calculated using 1-second bins in cleaned event files. If a bin has >2000 counts, and if more than 50% of those come from <1% of pixels, then it is considered to be noise-dominated and hence unusable.
| Quadrant | # 1 sec bins | Bins with >0 counts | Bins with >2000 counts | High rate bins dominated by noise | Noise dominated (total time) | Noise dominated (detector-on time) | Marked lightcurve |
|---|---|---|---|---|---|---|---|
| A | 50247 | 45877 | 6 | 6 | 0.01% | 0.01% | 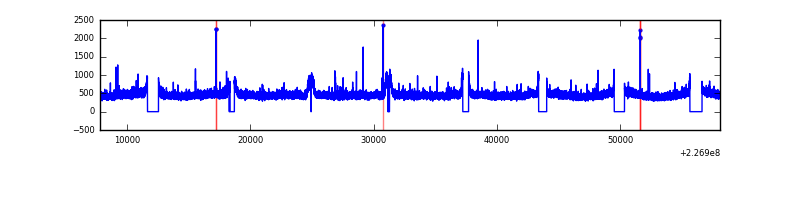 |
| B | 50247 | 45877 | 736 | 736 | 1.46% | 1.60% | 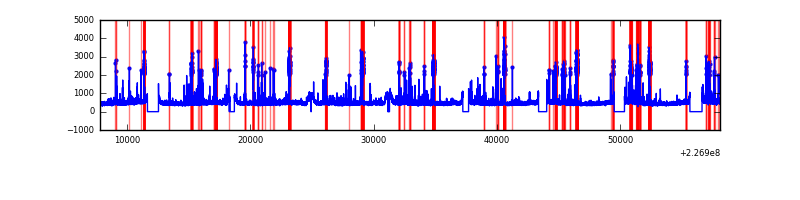 |
| C | 50247 | 45877 | 1 | 1 | 0.00% | 0.00% | 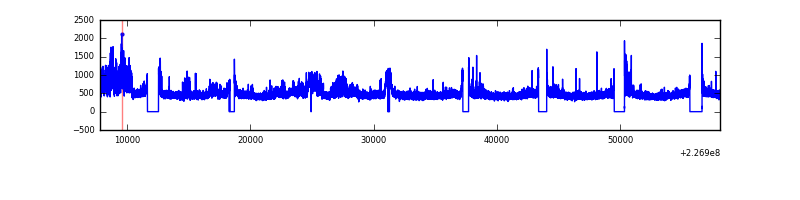 |
| D | 50247 | 45877 | 594 | 594 | 1.18% | 1.29% | 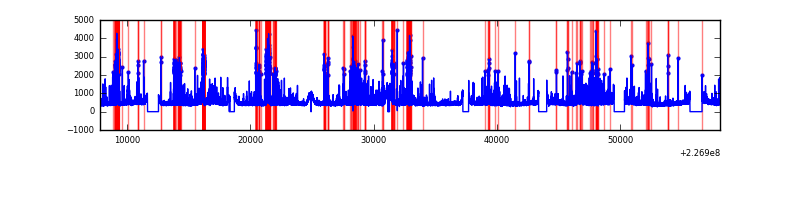 |
Top three noisy pixels from each quadrant. If the there are fewer than three noisy pixels in the level2.evt file, extra rows are filled as -1
| Pixel properties | Quadrant properties | ||||||
|---|---|---|---|---|---|---|---|
| Quadrant | DetID | PixID | Counts | Sigma | Mean | Median | Sigma |
| A | 15 | 174 | 56494 | 46.65 | 5460 | 5346 | 1096.3 |
| A | 0 | 226 | 52112 | 42.66 | 5460 | 5346 | 1096.3 |
| A | 12 | 194 | 48778 | 39.62 | 5460 | 5346 | 1096.3 |
| B | 4 | 239 | 2650985 | 2540.29 | 5466 | 5331 | 1041.5 |
| B | 4 | 173 | 333458 | 315.06 | 5466 | 5331 | 1041.5 |
| B | 0 | 214 | 121635 | 111.67 | 5466 | 5331 | 1041.5 |
| C | 1 | 16 | 2172451 | 1751.88 | 5373 | 5410 | 1237.0 |
| C | 8 | 229 | 111895 | 86.08 | 5373 | 5410 | 1237.0 |
| C | 13 | 61 | 41494 | 29.17 | 5373 | 5410 | 1237.0 |
| D | 12 | 233 | 1082519 | 832.96 | 5322 | 5163 | 1293.4 |
| D | 2 | 152 | 853243 | 655.69 | 5322 | 5163 | 1293.4 |
| D | 13 | 137 | 822726 | 632.1 | 5322 | 5163 | 1293.4 |
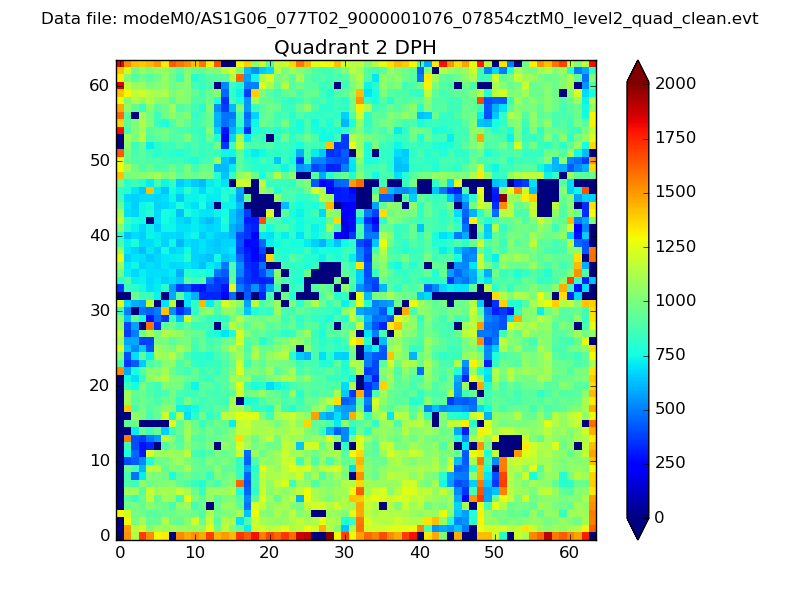
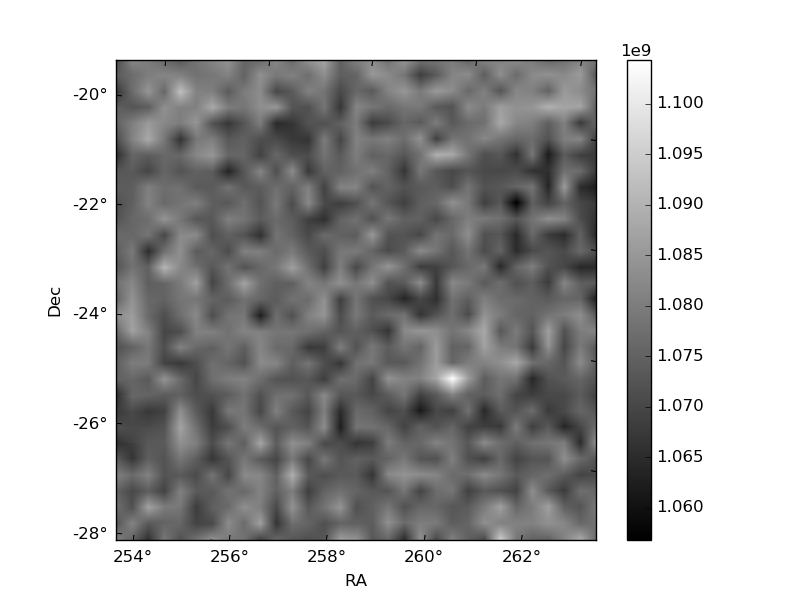
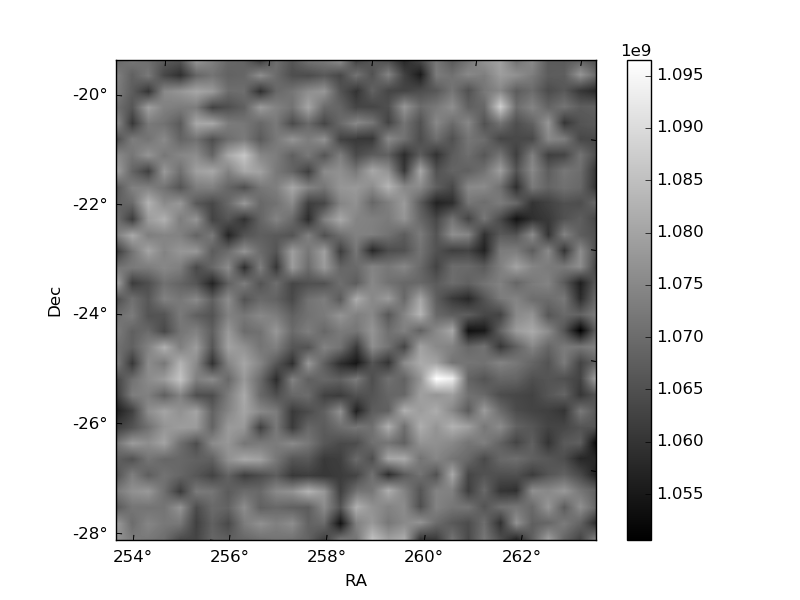
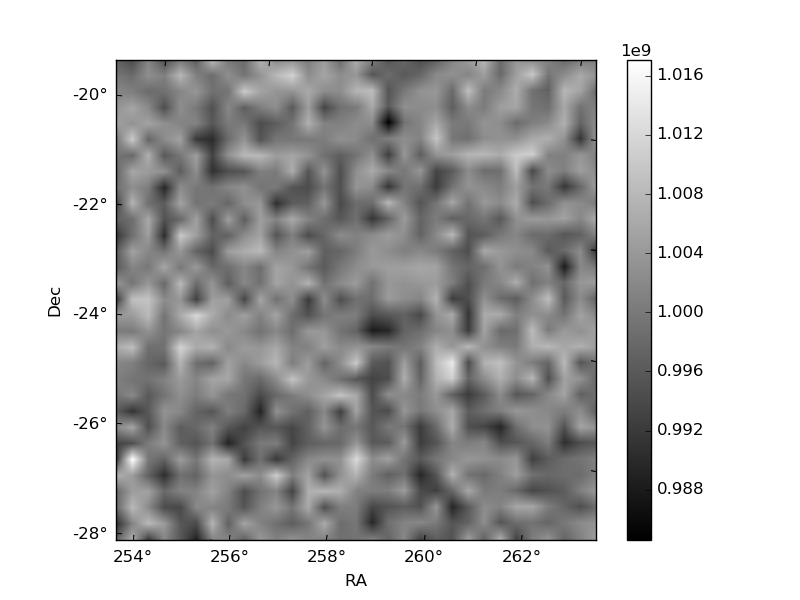
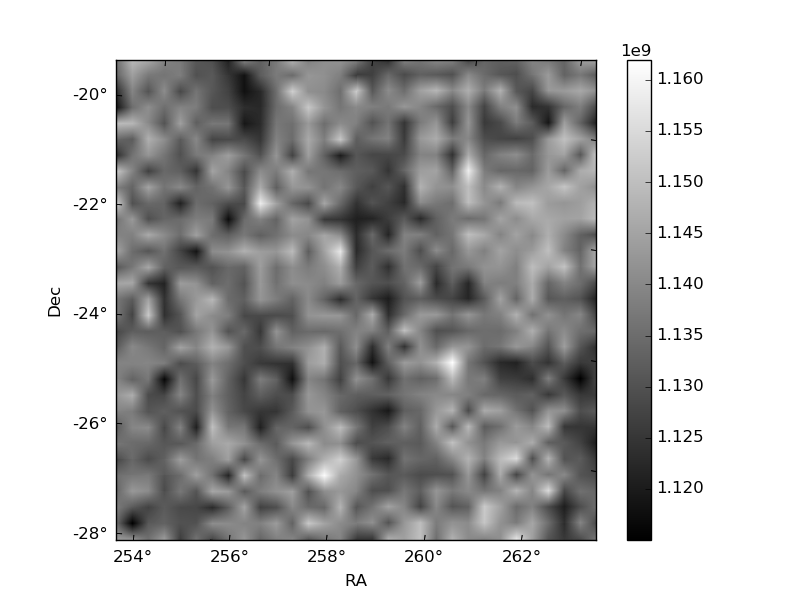
Histogram calculated using DETX and DETY for each event in the final _common_clean file
| Quadrant A | 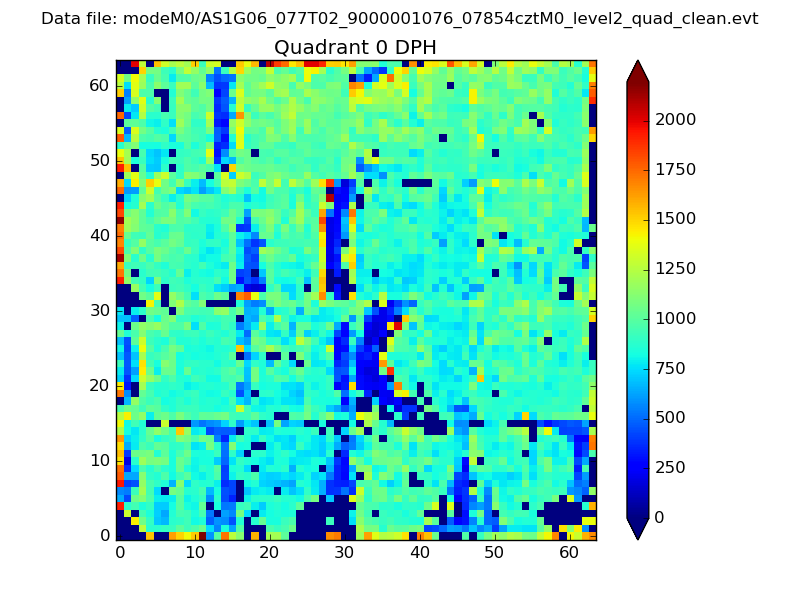 |
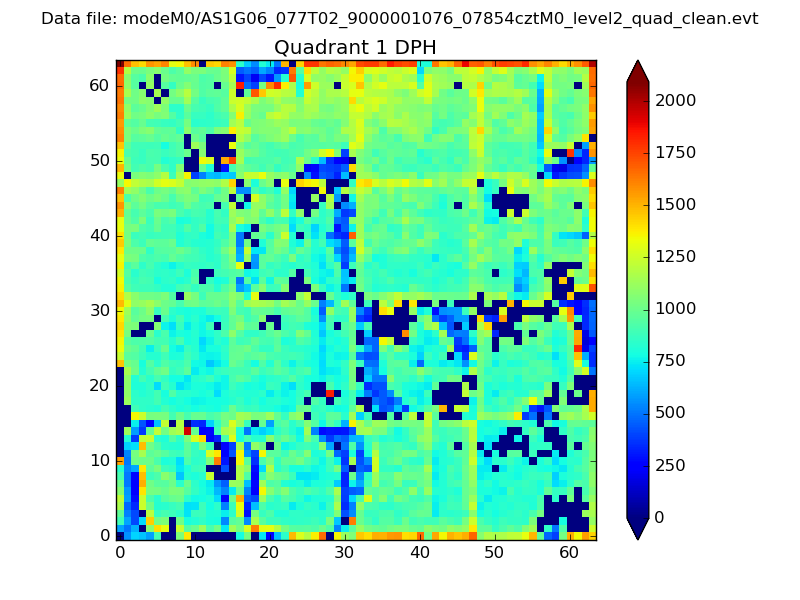 |
Quadrant B |
|---|---|---|---|
| Quadrant D | 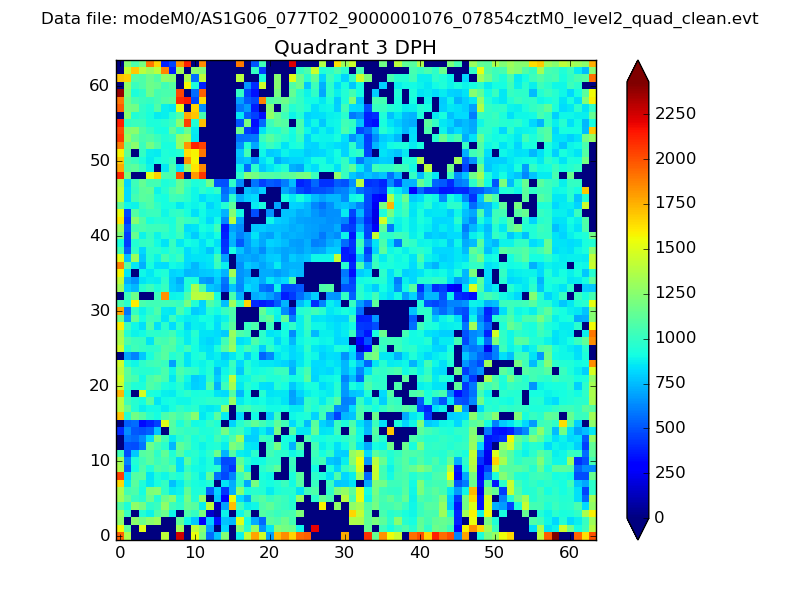 |
 |
Quadrant C |
| Plot type | Count rate plots | Images |
|---|---|---|
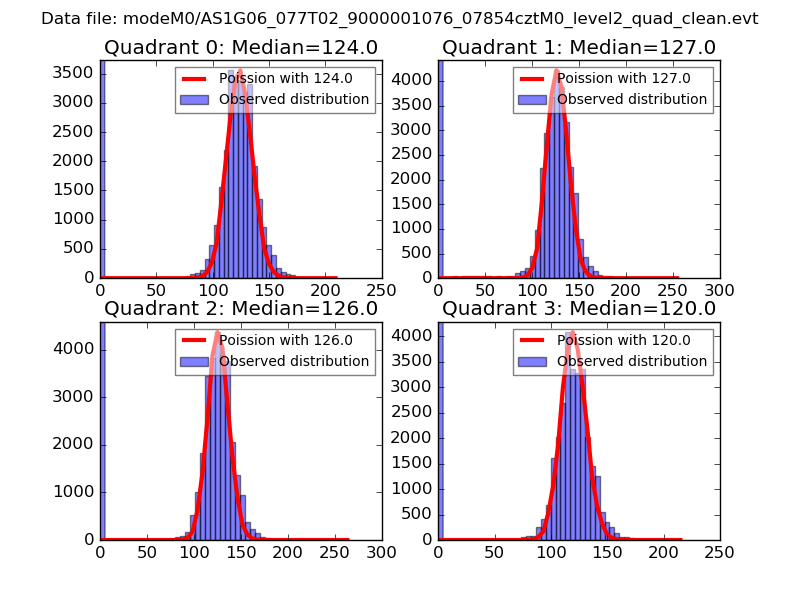
| Comparison with Poisson distribution Blue bars denote a histogram of data divided into 1 sec bins. Red curve is a Poisson curve with rate = median count rate of data. |
 |
 |
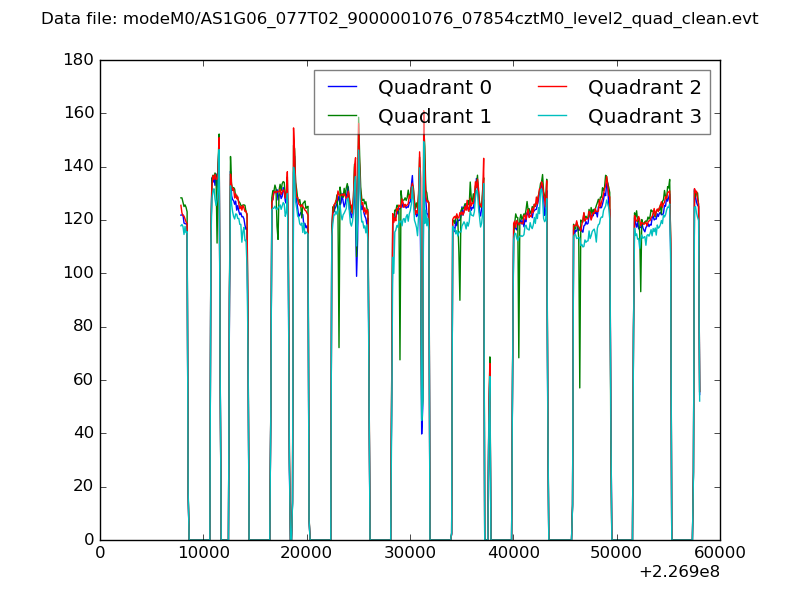
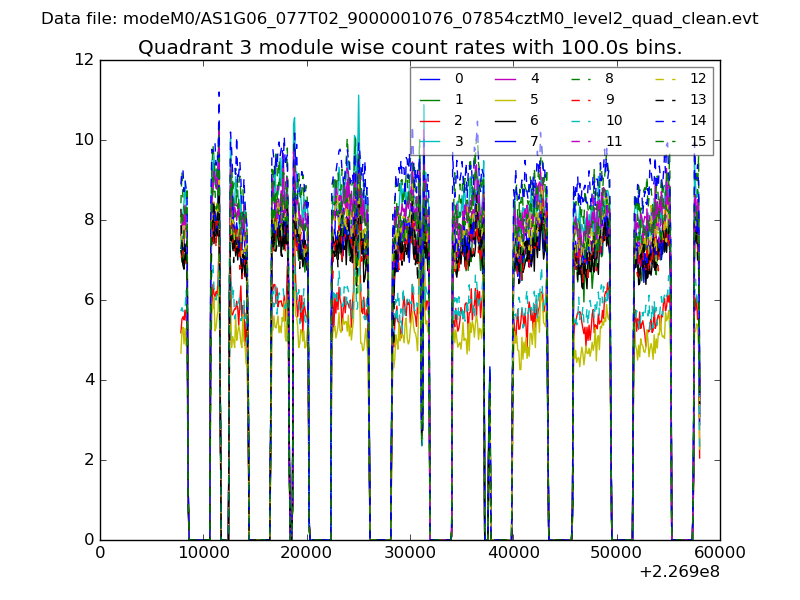
| Quadrant-wise count rates Data is divided into 100 sec bins |
 |
|
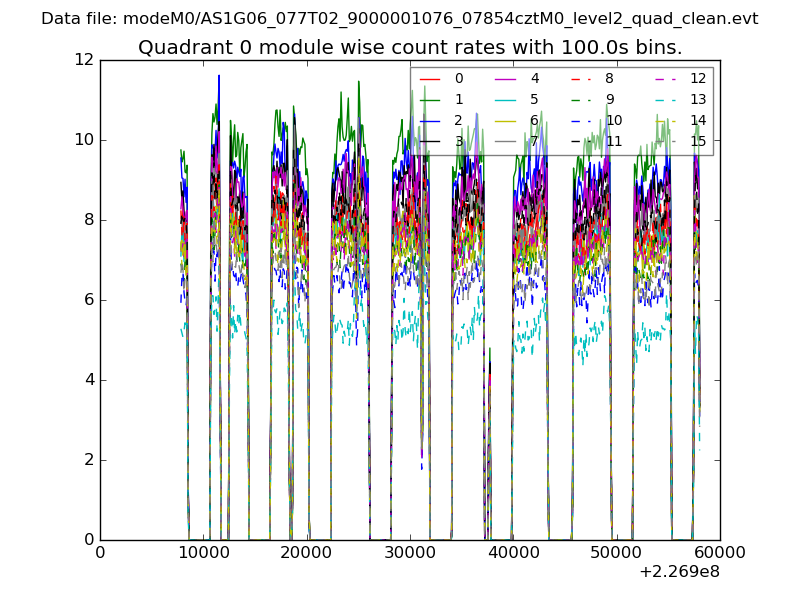
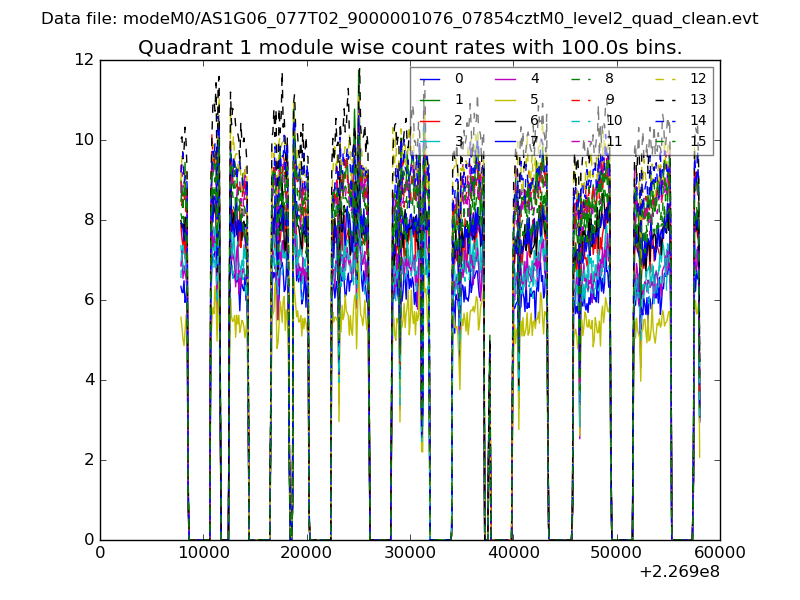
| Module-wise count rates for Quadrant A Data is divided into 100 sec bins |
 |
 |
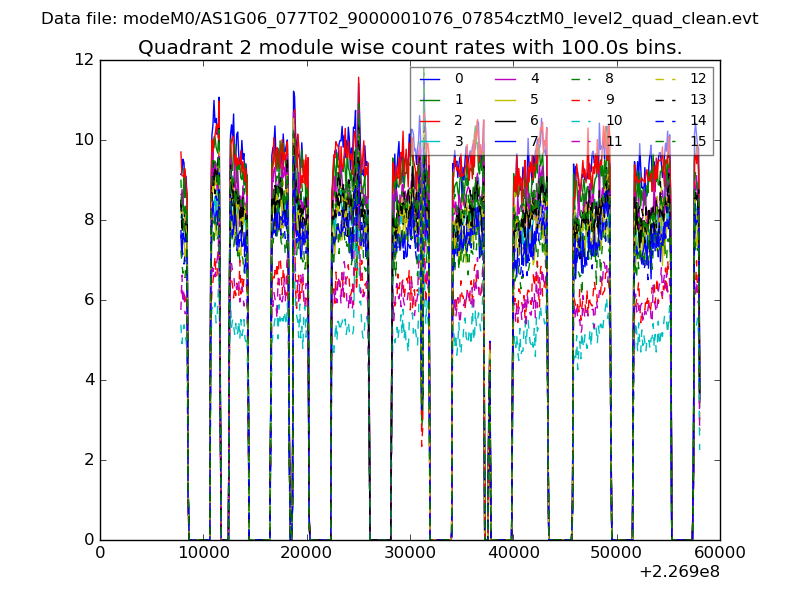
| Module-wise count rates for Quadrant B Data is divided into 100 sec bins |
 |
 |
| Module-wise count rates for Quadrant C Data is divided into 100 sec bins |
 |
 |
| Module-wise count rates for Quadrant D Data is divided into 100 sec bins |
 |
 |
| Parameter | Plot |
|---|---|
| CZT HV Monitor | 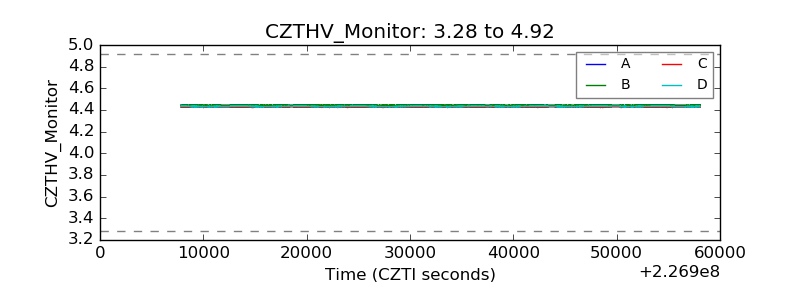 |
| D_VDD | 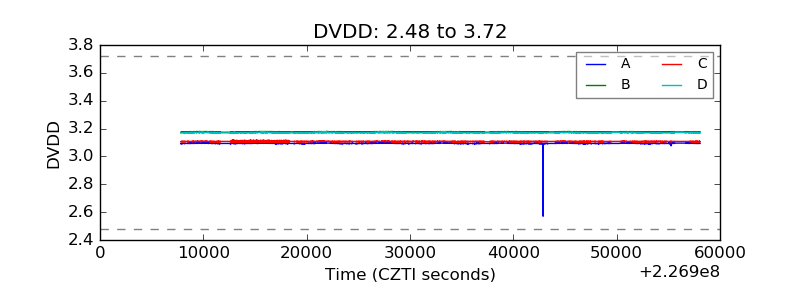 |
| Temperature 1 | 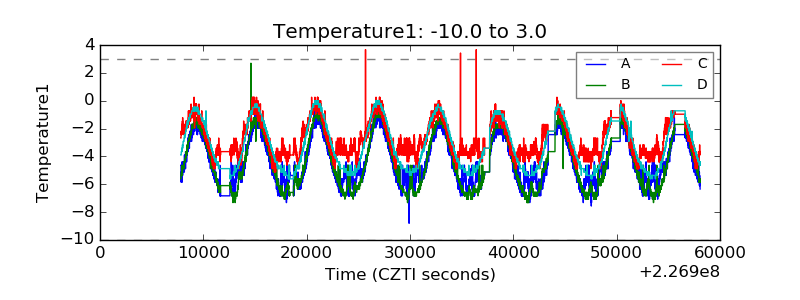 |
| Veto HV Monitor | 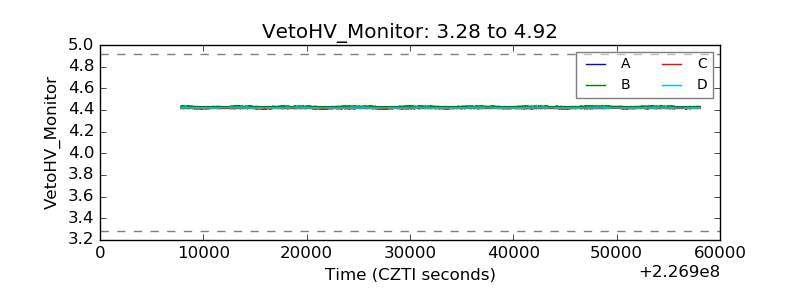 |
| Veto LLD | 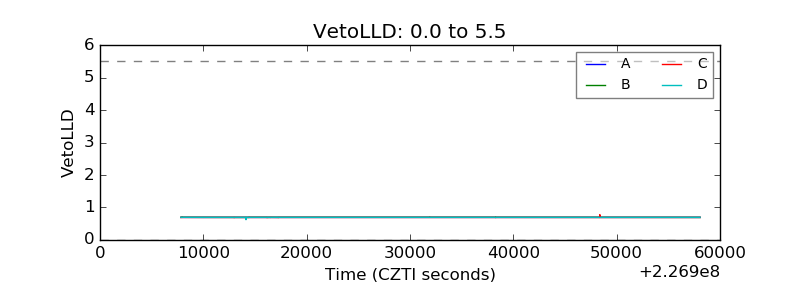 |
| Alpha Counter | 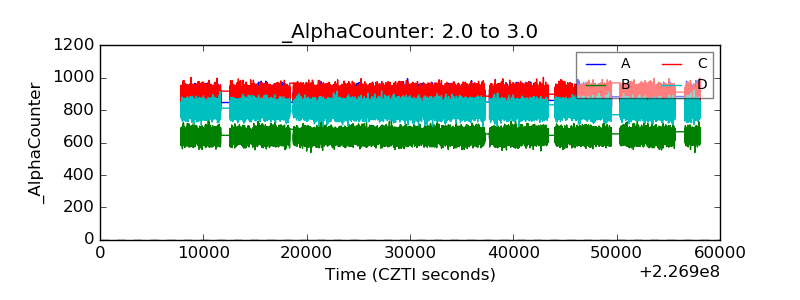 |
| _CPM_Rate | 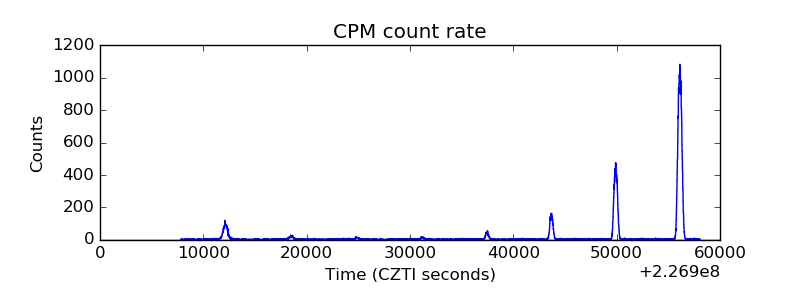 |
| CZT Counter | 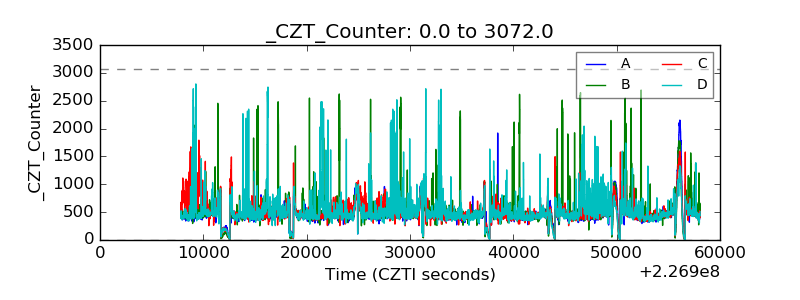 |
| +2.5 Volts monitor |  |
| +5 Volts monitor |  |
| _ROLL_ROT | 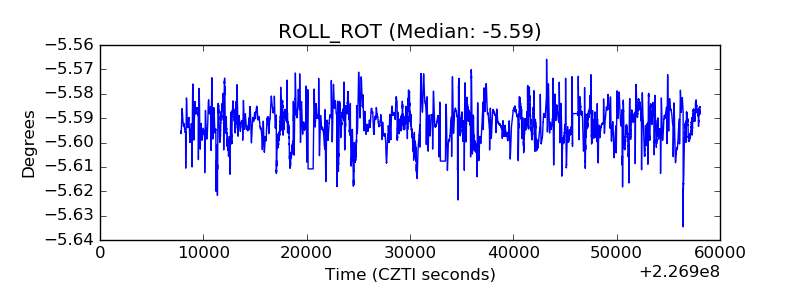 |
| _Roll_DEC | 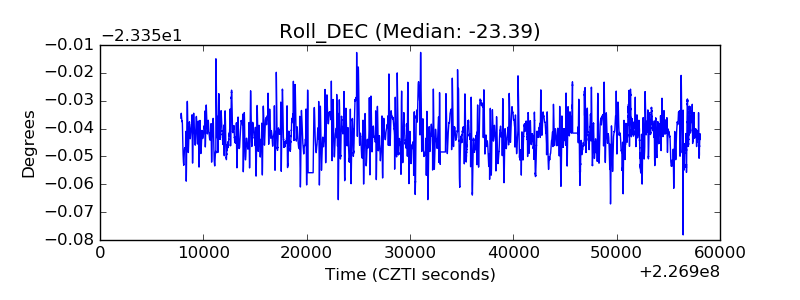 |
| _Roll_RA | 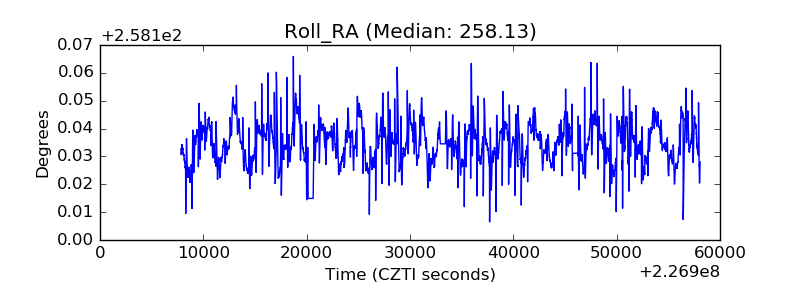 |
| Veto Counter | 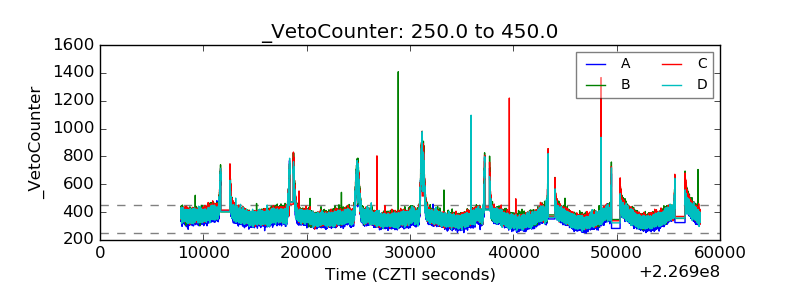 |